|
시장보고서
상품코드
2099503
AI 검색 최적화 소프트웨어 시장 : 점유율 분석, 업계 동향 및 통계, 성장 예측(2026-2031년)AI Search Optimization Software - Market Share Analysis, Industry Trends & Statistics, Growth Forecasts (2026 - 2031) |
||||||
 Mordor Intelligence
Mordor Intelligence에 의하면, AI 검색 최적화 소프트웨어 시장 규모는 2025년 10억 3,000만 달러에서 2026년에는 12억 3,000만 달러로 확대되어 2026년부터 2031년까지 CAGR 21.97%로 성장을 지속하여, 2031년에는 33억 2,000만 달러에 이를 것으로 예측됩니다.
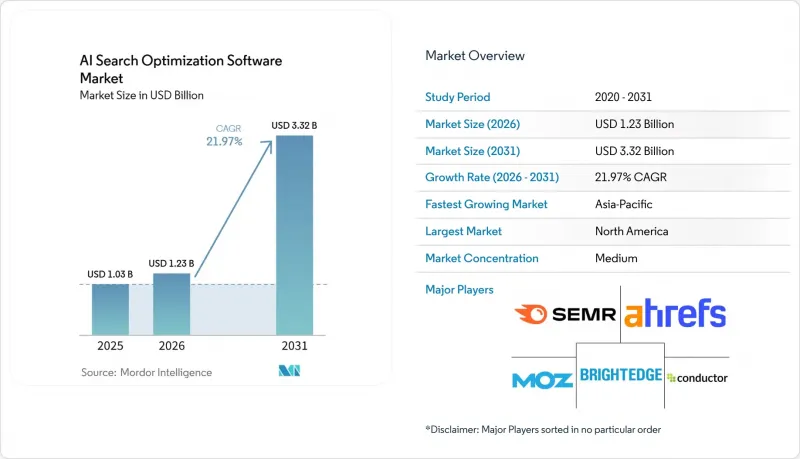
본 보고서는 구성 요소(소프트웨어 및 서비스), 도입 형태(클라우드 기반, On-Premise형, 하이브리드형), 최적화 유형(AI 검색 최적화 등), 기업 규모(대기업 및 중소기업), 최종 사용자 산업(소매 및 전자상거래, BFSI 등), 지역별로 분류되어 있습니다. 시장 전망은 금액(달러) 기준으로 제시되어 있습니다.
세계 AI 검색 최적화 소프트웨어 시장 동향 및 인사이트
AI 검색 가시성에 대한 기업 수요 증가
AI에 의한 검색 가시성 격차는 표준 순위 격차보다 감지하기 어렵기 때문에 전용 모니터링의 필요성이 더욱 절실해지고 있으며, 기업들의 도입이 급속히 진행되고 있습니다. 대규모 마케팅 팀이 AI에 의한 검색 가시성 부족을 단순한 성장 과제가 아닌 업무상 위험으로 인식하게 됨에 따라, AI 검색 최적화 소프트웨어 시장은 이러한 변화의 혜택을 누리고 있습니다. Semrush는 2026년 6월, 확장된 'AI 가시성 지수'를 통해 미국의 AI 검색 프롬프트 1억 2,600만 건을 분석한 결과, 동일 카테고리 내 경쟁 브랜드 간 브랜드 언급률에 큰 편차가 나타났습니다고 발표했습니다. 이러한 불균일한 언급 상황에서는 특히 다수의 브랜드, 제품, 컨텐츠 팀을 보유한 대규모 조직에서 수동 검토만으로는 관리 프로세스가 불충분해집니다. 그 결과, 기존 분석 도구로는 이러한 격차를 명확히 파악할 수 없기 때문에 재현 가능한 가시성 벤치마크를 제공할 수 있는 벤더에게는 고객 유지 측면에서 우위가 생깁니다. 기업들이 시범 운영을 거쳐 체계적인 플랫폼 도입으로 전환함에 따라, 이러한 추세는 AI 검색 최적화 소프트웨어 시장 전체의 지속적인 수요를 뒷받침하게 될 것입니다.
키워드 랭킹에서 답변 엔진 최적화로의 전환
키워드 순위에서 답변 엔진 최적화로의 전환은 구매자가 검색 소프트웨어에 기대하는 바를 변화시키고 있습니다. AI 검색 최적화 소프트웨어 시장은 이러한 전환의 혜택을 누리고 있습니다. 답변 환경에서는 단일 블루링크의 순위보다 언급의 존재 자체가 더 중요하게 여겨지기 때문입니다. 또한 구매자들이 단순한 키워드 대시보드가 아닌 모니터링, 경쟁사 벤치마킹, 응답 표면 인텔리전스에 대해 비용을 지불하게 됨에 따라 기업용 계약도 확대되고 있습니다. Conductor사는 2026년 4월, 답변 엔진 최적화를 위한 통합형 시스템 오브 레코드(System of Record)로서 차세대 AI 검색 성능 솔루션을 출시하며 이러한 방향성을 한층 더 강화했습니다. 이러한 움직임은 기존 플랫폼들이 답변 가시성, 워크플로우 실행 및 성능 관리를 중심으로 핵심 제품의 가치를 재구축하고 있음을 보여줍니다. 이러한 변화가 진행됨에 따라, AI 검색 최적화 소프트웨어 시장에서는 검색, 컨텐츠, 기술적 신호 및 인용 관리를 단일 운영 계층으로 통합할 수 있는 벤더가 우위를 점할 것으로 보입니다.
AI를 통한 가시화와 수익 간의 기여도(어트리뷰션)가 불분명
여전히 가장 큰 도입 장벽은 기여도 문제입니다. 많은 재무 부서는 AI에 의한 노출 이벤트와 그 이후의 수익 이벤트 사이에 직접적인 연관성을 요구하지만, 그 연관성은 프롬프트 수준에서는 종종 확인할 수 없습니다. BrightEdge는 2025년 현재 AI 검색이 조사 채널로 기능하고 있으며, 도입의 현 단계에서는 추적 가능한 직접 전환이 거의 제로에 가깝다고 밝혔습니다. 따라서 AI 검색 최적화 소프트웨어 시장의 벤더들은 마케팅 팀이 그 전략적 가치를 인식하고 있더라도, 라스트 클릭 논리를 통해 예산의 정당성을 설명하기 어려워지고 있습니다. 이 문제는 엄격한 구매 프로세스와 검증된 성과 증거에 대한 요구가 더 강한 대기업에서 더욱 두드러집니다. 벤더들이 더 우수한 어시스트 전환 모델이나 파이프라인 영향 모델을 구축할 때까지는 어트리뷰션의 불투명성이 이 부문의 더 빠른 전환을 가로막는 중대한 제약 요인으로 남아 있을 것입니다.
부문 분석
2025년에는 소프트웨어가 시장의 71.24%를 차지하고, 이는 이 카테고리의 초기 발전 단계에서 플랫폼 구독이 주요 수익 기반을 형성했음을 보여줍니다. AI 검색 최적화 소프트웨어 시장이 ‘소프트웨어 우선(Software First)’을 중시한 이유는 구매자들이 대규모 서비스 프로그램을 확장하기 전에 대시보드, 인용 모니터링, 기술 진단 및 보고 시스템을 필요로 했기 때문입니다. 이러한 경향은 응답 엔진이 변화함에 따라 플랫폼이 다수의 계정에 걸쳐 업데이트를 배포할 수 있는 이 카테고리의 SaaS 구조도 반영하고 있습니다. 가시성 모니터링에는 일회성 프로젝트 작업이 아닌 지속적인 이용이 필요하기 때문에 기업 팀들은 서비스 주도형 모델보다 이러한 도구를 더 신속하게 도입했습니다. 따라서 2025년에 소프트웨어 부문은 AI 검색 최적화 소프트웨어 시장의 수익 기반을 지탱하는 핵심이 되었습니다.
서비스 부문은 2031년까지 연평균 성장률(CAGR) 24.83%를 나타낼 것으로 예측되며, 예측 기간 동안 가장 빠르게 성장하는 구성 요소가 될 전망입니다. 서비스 부문의 성장은 도입의 복잡성에서 기인합니다. 많은 팀이 여전히 전략 수립, 통합, 워크플로우 설정 및 관리된 실행에 있어 지원이 필요하기 때문입니다. 이는 소프트웨어의 약점을 나타내는 것이 아니라, 이 카테고리가 도구 구매 단계에서 운영 단계로 전환되고 있음을 보여줍니다. BrightEdge는 2026년 3월 AI Hyper Cube를 출시함과 동시에 AI 에이전트 모니터링 및 가시성 분석과 관련된 기능을 확충하여 이러한 통합적인 접근 방식을 구체화했습니다. 구매자들은 대개 가이드형 도입으로 시작하여 이후 소프트웨어 주도형 워크플로로 활동을 전환하기 때문에 시간이 지남에 따라 서비스의 성장이 플랫폼 도입을 더욱 촉진할 것으로 예측됩니다.
2025년 AI 검색 최적화 소프트웨어 시장에서 클라우드 기반 도입이 68.41%를 차지하며, 다른 도입 모델을 크게 앞질렀습니다. 클라우드 모델이 이 카테고리에 적합한 이유는 응답 엔진이 변화함에 따라 공급업체가 프롬프트 라이브러리, 통합 기능, 추적 로직을 빈번하게 업데이트해야 하기 때문입니다. 또한, 분산된 팀 간의 벤치마크 공유, 신속한 온보딩, 도입 시 마찰 감소도 지원합니다. 이러한 장점 덕분에 속도와 폭넓은 기능에 대한 접근을 원하는 기업들에게 클라우드는 기본적인 선택지가 되었습니다. 그 결과, 2025년에도 클라우드는 AI 검색 최적화 소프트웨어 시장의 주요 제공 계층으로 자리매김했습니다.
하이브리드 배포는 2031년까지 연평균 성장률(CAGR) 23.19%를 나타낼 것으로 예측되며, 이는 데이터 및 거버넌스 요구 사항이 더 엄격한 부문 수요를 반영한 것입니다. 의료, 금융 서비스, 공공 부문의 구매자들은 대개 자사 데이터, 고객 기록 및 내부 테스트 환경에 대해 더 엄격한 관리를 필요로 합니다. 하이브리드 모델은 이러한 구매자들에게 기밀성이 높은 프로세스를 자사 인프라 내에 유지하면서, 필요에 따라 클라우드 기반의 벤치마크 및 인터페이스 계층을 활용할 수 있는 방법을 제공합니다. Botify는 2025년 6월, AI 에이전트와 MCP 서버의 통합을 확대하고 AWS ISV Accelerate Program에 참여함으로써 엔터프라이즈용 클라우드 보안 도입을 촉진했습니다. On-Premise는 여전히 가장 규모가 작은 도입 형태이지만, 엄격한 주권 및 보안 프레임워크 하에서 운영되는 제한된 구매자층에게는 여전히 이용되고 있습니다. 전반적인 추세로 볼 때, 단일 아키텍처가 아닌 유연성이 AI 검색 최적화 소프트웨어 시장 전체의 도입 형태를 결정짓게 될 것입니다.
지역별 분석
2025년, 북미는 AI 검색 최적화 소프트웨어 시장 점유율의 34.62%를 차지하며 최대 지역 부문이 되었습니다. 이 지역이 주도적인 위치를 차지한 것은 주요 기업 고객, 성숙한 디지털 마케팅 예산, 그리고 몇몇 주요 플랫폼 사업자가 미국에 집중되어 있기 때문입니다. 이로 인해 북미는 답변 엔진 최적화 도구 및 운영 워크플로우에 있어 가장 초기 단계부터 대규모 시험장이 되었습니다. 캐나다와 멕시코의 기여도는 비교적 작았으나, 두 국가 모두 기업의 디지털 기술 도입과 국경을 초월한 브랜드 활동을 통해 지역 수요를 뒷받침했습니다.
유럽은 독일, 영국, 프랑스가 기업 수요의 핵심을 차지하고 있어 AI 검색 최적화 소프트웨어 시장에 있어 구조적으로 중요한 지역으로 남아 있습니다. 또한, 이 지역의 비즈니스 및 정책 환경에서는 정확성, 투명성, 거버넌스에 대한 우려가 특히 중요하게 여겨지기 때문에 이 지역의 중요성은 더욱 커지고 있습니다. 유럽의 구매자들은 관리된 워크플로우와 문서화된 답변 품질을 중시하는 경향이 강하며, 이는 모니터링 및 거버넌스 기능을 갖춘 소프트웨어에 대한 수요를 뒷받침하고 있습니다. 아시아태평양은 2031년까지 연평균 성장률(CAGR) 27.84%를 나타낼 것으로 예측되며, AI 검색 최적화 소프트웨어 시장에서 가장 빠르게 성장하는 지역 부문이 될 것입니다. 이러한 성장은 답변 엔진 환경이 더욱 세분화되고 있음을 반영하며, 단일 플랫폼을 통한 최적화 접근 방식보다 다중 엔진을 지원하는 시각화 도구에 대한 수요가 증가하고 있습니다.
인도에서는 디지털 기업의 기반이 확대되고 있는 반면, 일본과 한국은 엔터프라이즈급 소프트웨어 및 관리형 실행 서비스에 있어 여전히 매력적인 시장으로 남아 있습니다. Semrush는 2026년 5월, AI 시각화 데이터베이스를 32개국으로 확대하고 17개의 새로운 지역 시장을 추가함으로써 프롬프트 기반을 2억 6,100만 건 이상의 LLM 프롬프트로 확장하여, 지역 전반 수요 증가를 뒷받침했습니다. 남미에서는 도입이 아직 초기 단계이지만, 디지털 마케팅의 성숙도가 높아짐에 따라 브라질과 아르헨티나에서의 중요성이 커지고 있습니다. 중동 및 아프리카는 여전히 규모가 가장 작은 지역이지만, 사우디아라비아와 아랍에미리트는 디지털 전환에 대한 투자가 활발하여 두드러지고 있습니다. 나이지리아와 남아프리카공화국은 비용 효율적인 도구가 아직 성숙도가 낮은 기업 인프라에도 대응할 수 있기 때문에 장기적인 잠재력을 지니고 있습니다. OECD는 2025년 12월, 전 세계적으로 중소기업의 AI 도입이 여전히 대기업에 뒤처져 있다고 밝히며, 남미, 중동 및 아프리카 전역에서 수요 확산이 미흡함을 시사했습니다.
기타 혜택:
- 엑셀 형식 시장 예측(ME) 시트
- 3개월간의 애널리스트 지원
자주 묻는 질문
목차
제1장 서론
제2장 조사 방법
제3장 주요 요약
제4장 시장 구도
제5장 시장 규모와 성장 예측
제6장 경쟁 구도
제7장 시장 기회와 향후 전망
JHS 26.08.05According to Mordor Intelligence, the AI search optimization software market size is expected to grow from USD 1.03 billion in 2025 to USD 1.23 billion in 2026 and is forecast to reach USD 3.32 billion by 2031 at 21.97% CAGR over 2026-2031.
This report is Segmented by Component (Software, and Services), Deployment Mode (Cloud-Based, On-Premise, and Hybrid), Optimization Type (AI Search Visibility Optimization, and More), Enterprise Size (Large Enterprises, and Small and Medium Enterprises), End-User Industry (Retail and E-Commerce, BFSI, and More), and Geography. The Market Forecasts are Provided in Terms of Value (USD).
Global AI Search Optimization Software Market Trends and Insights
Rising Enterprise Demand for AI Search Visibility
Enterprise adoption has moved quickly because AI citation gaps are harder to detect than standard ranking gaps, and that makes the need for dedicated monitoring more urgent. The AI search optimization software market is benefiting from this shift because large marketing teams now treat a lack of AI visibility as an operating risk rather than just a growth issue. Semrush stated in June 2026 that its expanded AI Visibility Index analyzed 126 million U.S. AI search prompts and found wide variation in brand mention rates across competing brands in the same category. That kind of uneven citation exposure makes manual review a weak control process, especially in large organizations with many brands, products, and content teams. The result is a retention advantage for vendors that can provide repeatable visibility benchmarks, because buyers cannot clearly see these gaps with conventional analytics tools. This pattern supports recurring demand across the AI search optimization software market as enterprises move from testing to structured platform adoption.
Shift from Keyword Ranking to Answer Engine Optimization
The move from keyword ranking to answer engine optimization is changing what buyers expect from search software. The AI search optimization software market is gaining from this transition because citation presence matters more in answer environments than a single blue-link position. Enterprise contracts have also expanded as buyers pay for monitoring, competitive benchmarking, and response-surface intelligence rather than for simple keyword dashboards. Conductor reinforced this direction in April 2026, when it launched its next-generation AI Search Performance offer as a unified system of record for answer engine optimization. That move shows how incumbent platforms are recasting core product value around answer visibility, workflow execution, and performance management. As this shift continues, the AI search optimization software market is likely to reward vendors that can integrate search, content, technical signals, and citation control into a single operating layer.
Unclear Attribution Between AI Visibility And Revenue
The largest buying barrier is still attribution. Many finance teams want a direct line between an AI citation event and a later revenue event, and that link is often not visible at the prompt level. BrightEdge stated in 2025 that AI search was functioning as a research channel with near-zero direct conversions tracked at that stage of adoption. That makes it harder for vendors in the AI search optimization software market to justify budgets through last-click logic, even when marketing teams can see the strategic value. The problem is sharper in large enterprises because they have strict buying processes and stronger demands for audited performance evidence. Until vendors build better assisted-conversion and pipeline-influence models, attribution opacity will remain a meaningful restraint on faster category conversion.
Other drivers and restraints analyzed in the detailed report include:
- Need to Reduce Organic Traffic Volatility from AI Overviews
- Content Scale Requirements Across Multi-Property Brands
- Fast-Changing Search Interfaces and Ranking Signals
For complete list of drivers and restraints, kindly check the Table Of Contents.
Segment Analysis
Software accounted for 71.24% of the market in 2025, indicating that platform subscriptions formed the primary revenue base early in the category's development. The AI search optimization software market favored software-first because buyers needed dashboards, citation monitoring, technical diagnostics, and reporting systems before they could scale large service programs. This pattern also reflects the SaaS structure of the category, where platforms can roll out updates across many accounts as answer engines change. Enterprise teams adopted these tools faster than services-led models because visibility monitoring requires repeat use, not one-time project work. The software segment, therefore, anchored the commercial base of the AI search optimization software market in 2025.
Services are projected to grow at a 24.83% CAGR through 2031, making them the fastest-growing component over the forecast period. Growth in services comes from implementation complexity, since many teams still need help with strategy, integration, workflow setup, and managed execution. This is not a sign of software weakness; it shows that the category is moving from tool purchase to operational use. BrightEdge illustrated this combined approach in March 2026 when it launched AI Hyper Cube and also expanded related capabilities around AI agent monitoring and visibility analysis. Over time, service growth is likely to further support platform adoption, as buyers often start with guided delivery before shifting more activity into software-led workflows.
Cloud-based deployment accounted for 68.41% of the AI search optimization software market in 2025, leaving it well ahead of other deployment models. The cloud model fits the category because vendors need to update prompt libraries, integrations, and tracking logic frequently as answer engines change. It also supports shared benchmarking, faster onboarding, and lower deployment friction across distributed teams. These benefits made the cloud the default choice for enterprises that wanted speed and broad feature access. As a result, cloud remained the main delivery layer for the AI search optimization software market in 2025.
Hybrid deployment is expected to grow at a 23.19% CAGR through 2031, reflecting demand from sectors with stricter data and governance requirements. Healthcare, financial services, and public sector buyers often need tighter control over proprietary data, customer records, and internal testing environments. Hybrid models give these buyers a way to keep sensitive processes within their own infrastructure while still using cloud-based benchmarking or interface layers where needed. Botify supported the enterprise cloud security case in June 2025 by expanding its AI agents and MCP Server integration, and by joining the AWS ISV Accelerate Program. On-premise remains the smallest mode, but it still serves a narrow group of buyers that operate under strict sovereignty and security frameworks. The broader direction suggests that flexibility, not a single architecture, will shape deployment choices across the AI search optimization software market.
Complete Report Scope:
- By Component
- Software
- Services
- By Deployment Mode
- Cloud-Based
- On-Premise
- Hybrid
- By Optimization Type
- AI Search Visibility Optimization
- Content Optimization
- Technical SEO Automation
- AI Analytics and Performance Monitoring
- Reputation and Brand Presence Optimization
- By Enterprise Size
- Large Enterprises
- Small And Medium Enterprises
- By End-User Industry
- Retail and E-Commerce
- BFSI
- Healthcare and Life Sciences
- IT and Telecom
- Media and Entertainment
- Government and Public Administration
- Education and Research Institutions
- Transportation and Logistics
- Other End-User Industries
- By Geography
- North America
- United States
- Canada
- Mexico
- South America
- Brazil
- Argentina
- Rest of South America
- Europe
- Germany
- United Kingdom
- France
- Italy
- Spain
- Russia
- Rest of Europe
- Asia-Pacific
- China
- India
- Japan
- South Korea
- Australia
- Rest of Asia-Pacific
- Middle East and Africa
- Middle East
- Saudi Arabia
- United Arab Emirates
- Rest of Middle East
- Africa
- South Africa
- Nigeria
- Rest of Africa
- Middle East
- North America
Geography Analysis
North America held 34.62% of the AI search optimization software market share in 2025, making it the largest regional segment. The region led because major enterprise buyers, mature digital marketing budgets, and several core platform operators are concentrated in the United States. This made North America the earliest large-scale testing ground for answer engine optimization tools and operating workflows. Canada and Mexico were smaller contributors, but both supported regional demand through enterprise digital adoption and cross-border brand activity.
Europe remained a structurally important region for the AI search optimization software market, as Germany, the United Kingdom, and France accounted for the core of enterprise demand. The region also carries added importance because accuracy, transparency, and governance concerns are especially relevant in its business and policy environment. Buyers in Europe are more likely to value controlled workflows and documented response quality, which supports demand for software with monitoring and governance layers. Asia-Pacific is projected to grow at a 27.84% CAGR through 2031, making it the fastest-growing regional segment in the AI search optimization software market. This growth reflects a more fragmented answer-engine environment, which increases the need for multi-engine visibility tools rather than single-platform optimization approaches.
India is expanding with its digital enterprise base, while Japan and South Korea remain attractive markets for enterprise-grade software and managed execution. Semrush supported the case for broader regional demand in May 2026, when it expanded its AI Visibility Database to 32 countries and added 17 new regional markets, bringing the prompt base to more than 261 million LLM prompts. South America is still earlier in adoption, but Brazil and Argentina are building relevance as digital marketing maturity improves. The Middle East and Africa remain the smallest region, though Saudi Arabia and the United Arab Emirates stand out because of digital transformation spending. Nigeria and South Africa offer longer-term potential where cost-efficient tools can match less mature enterprise infrastructure. The OECD stated in December 2025 that AI adoption among small and medium-sized enterprises still lagged that of larger firms globally, indicating underpenetrated demand across South America, the Middle East, and Africa.
- Semrush Holdings, Inc.
- Ahrefs Pte. Ltd.
- Moz, Inc.
- Conductor, Inc.
- BrightEdge Technologies, Inc.
- Similarweb Ltd.
- seoClarity, LLC
- Surfer Sp. z o.o.
- MarketMuse, Inc.
- Clearscope, Inc.
- Botify SAS
- ContentKing B.V.
- AccuRanker ApS
- Mangools s.r.o.
- Profound
- Otterly.AI
- Advanced Web Ranking SRL
- Serpstat Limited
- Peec AI
- Authoritas
Additional Benefits:
- The market estimate (ME) sheet in Excel format
- 3 months of analyst support
TABLE OF CONTENTS
1 INTRODUCTION
- 1.1 Study Assumptions and Market Definition
- 1.2 Scope of the Study
2 RESEARCH METHODOLOGY
3 EXECUTIVE SUMMARY
4 MARKET LANDSCAPE
- 4.1 Market Overview
- 4.2 Market Drivers
- 4.2.1 Rising Enterprise Demand for AI Search Visibility
- 4.2.2 Shift From Keyword Ranking to Answer Engine Optimization
- 4.2.3 Need To Reduce Organic Traffic Volatility From AI Overviews
- 4.2.4 Content Scale Requirements Across Multi-Property Brands
- 4.2.5 Budget Reallocation Toward Measurable Organic Efficiency
- 4.2.6 Early-Mover Advantage In Proprietary Citation Tracking
- 4.3 Market Restraints
- 4.3.1 Unclear Attribution Between AI Visibility And Revenue
- 4.3.2 Fast-Changing Search Interfaces and Ranking Signals
- 4.3.3 Limited Access To Closed or Restricted AI Search Systems
- 4.3.4 Buyer Skepticism Around New Category ROI
- 4.4 Impact of Macroeconomic Factors on the Market
- 4.5 Industry Value Chain Analysis
- 4.6 Technology Outlook
- 4.7 Regulatory Landscape
- 4.8 Porter's Five Forces Analysis
- 4.8.1 Threat of New Entrants
- 4.8.2 Bargaining Power of Suppliers
- 4.8.3 Bargaining Power of Buyers
- 4.8.4 Threat of Substitutes
- 4.8.5 Intensity of Competitive Rivalry
5 MARKET SIZE AND GROWTH FORECASTS (VALUE)
- 5.1 By Component
- 5.1.1 Software
- 5.1.2 Services
- 5.2 By Deployment Mode
- 5.2.1 Cloud-Based
- 5.2.2 On-Premise
- 5.2.3 Hybrid
- 5.3 By Optimization Type
- 5.3.1 AI Search Visibility Optimization
- 5.3.2 Content Optimization
- 5.3.3 Technical SEO Automation
- 5.3.4 AI Analytics and Performance Monitoring
- 5.3.5 Reputation and Brand Presence Optimization
- 5.4 By Enterprise Size
- 5.4.1 Large Enterprises
- 5.4.2 Small And Medium Enterprises
- 5.5 By End-User Industry
- 5.5.1 Retail and E-Commerce
- 5.5.2 BFSI
- 5.5.3 Healthcare and Life Sciences
- 5.5.4 IT and Telecom
- 5.5.5 Media and Entertainment
- 5.5.6 Government and Public Administration
- 5.5.7 Education and Research Institutions
- 5.5.8 Transportation and Logistics
- 5.5.9 Other End-User Industries
- 5.6 By Geography
- 5.6.1 North America
- 5.6.1.1 United States
- 5.6.1.2 Canada
- 5.6.1.3 Mexico
- 5.6.2 South America
- 5.6.2.1 Brazil
- 5.6.2.2 Argentina
- 5.6.2.3 Rest of South America
- 5.6.3 Europe
- 5.6.3.1 Germany
- 5.6.3.2 United Kingdom
- 5.6.3.3 France
- 5.6.3.4 Italy
- 5.6.3.5 Spain
- 5.6.3.6 Russia
- 5.6.3.7 Rest of Europe
- 5.6.4 Asia-Pacific
- 5.6.4.1 China
- 5.6.4.2 India
- 5.6.4.3 Japan
- 5.6.4.4 South Korea
- 5.6.4.5 Australia
- 5.6.4.6 Rest of Asia-Pacific
- 5.6.5 Middle East and Africa
- 5.6.5.1 Middle East
- 5.6.5.1.1 Saudi Arabia
- 5.6.5.1.2 United Arab Emirates
- 5.6.5.1.3 Rest of Middle East
- 5.6.5.2 Africa
- 5.6.5.2.1 South Africa
- 5.6.5.2.2 Nigeria
- 5.6.5.2.3 Rest of Africa
- 5.6.5.1 Middle East
- 5.6.1 North America
6 COMPETITIVE LANDSCAPE
- 6.1 Market Concentration
- 6.2 Strategic Moves
- 6.3 Market Share Analysis
- 6.4 Company Profiles (includes Global Level Overview, Market Level Overview, Core Segments, Financials as available, Strategic Information, Market Rank/Share, Products and Services, Recent Developments)
- 6.4.1 Semrush Holdings, Inc.
- 6.4.2 Ahrefs Pte. Ltd.
- 6.4.3 Moz, Inc.
- 6.4.4 Conductor, Inc.
- 6.4.5 BrightEdge Technologies, Inc.
- 6.4.6 Similarweb Ltd.
- 6.4.7 seoClarity, LLC
- 6.4.8 Surfer Sp. z o.o.
- 6.4.9 MarketMuse, Inc.
- 6.4.10 Clearscope, Inc.
- 6.4.11 Botify SAS
- 6.4.12 ContentKing B.V.
- 6.4.13 AccuRanker ApS
- 6.4.14 Mangools s.r.o.
- 6.4.15 Profound
- 6.4.16 Otterly.ai
- 6.4.17 Advanced Web Ranking SRL
- 6.4.18 Serpstat Limited
- 6.4.19 Peec AI
- 6.4.20 Authoritas
7 MARKET OPPORTUNITIES AND FUTURE OUTLOOK
- 7.1 White-Space and Unmet-Need Assessment