
|
시장보고서
상품코드
2119372
혁신 파이프라인 인텔리전스 : 시장 점유율 분석, 업계 동향 및 통계, 성장 예측(2026-2031년)Innovation Pipeline Intelligence - Market Share Analysis, Industry Trends & Statistics, Growth Forecasts (2026 - 2031) |
||||||
 Mordor Intelligence
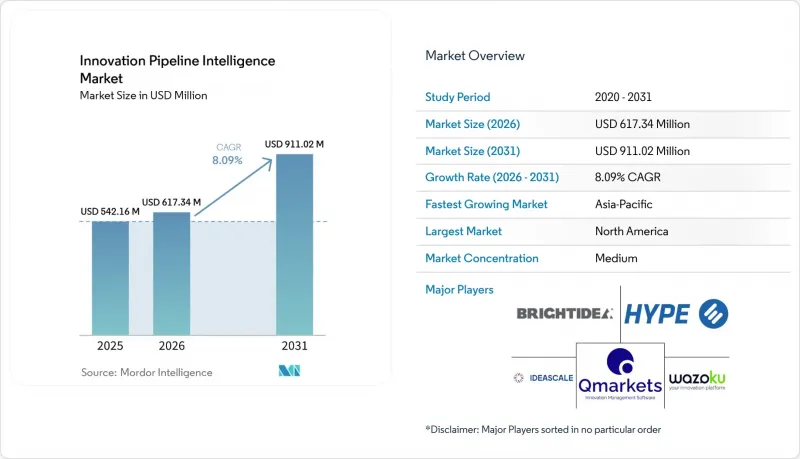
Mordor Intelligence에 의하면, 혁신 파이프라인 인텔리전스 시장 규모는 2025년 5억 4,216만 달러로 평가되었습니다. 2026년에는 6억 1,734만 달러에 이르고, 2031년까지 9억 1,102만 달러로 확대되며 2026년부터 2031년에 걸쳐 CAGR 8.09%를 기록할 전망입니다.
본 보고서는 제공 분야(솔루션 및 서비스), 배포 모델(클라우드 네이티브, 하이브리드, On-Premise), 조직 규모(대기업 및 중소기업), 용도(아이디어 관리 플랫폼 등), 산업 분야(기술 및 통신 등), 지역별로 분류되어 있습니다. 시장 예측은 금액(달러) 기준으로 제시되어 있습니다.
세계의 혁신 파이프라인 인텔리전스 시장 동향 및 인사이트력
구조화된 혁신 파이프라인에 대한 기업 수요
조직 내에서는 관리되지 않은 아이디어 창출이 선정 기준의 부실, 업무 중복, 설명 책임의 부재를 초래한다는 인식이 높아지고 있습니다. 혁신 파이프라인 인텔리전스 시장은 스테이지 게이트, 평가 기준, 포트폴리오 기록 및 공통 워크플로우를 통해 이러한 우려를 해결하고 있습니다. 이러한 기능을 통해 제안서 제출부터 실현 가능성 검토, 자금 조달, 구현, 상용화에 이르는 전 과정을 추적할 수 있습니다. 리더에게는 단순한 아이디어 저장소 이상의 것이 필요합니다. 실현 가능성, 자원 배분, 위험, 전략적 적합성 및 기대 가치를 비교 검토해야 하기 때문입니다. 혁신 리더가 투자 수익에 대해 설명 책임을 져야 하는 경우, 문서화된 의사결정 과정은 필수 요건이 됩니다. 이를 통해 소프트웨어 예산이 제한적인 상황에서도 거버넌스 플랫폼의 가치가 높아집니다.
아이디어 평가 및 포트폴리오 결정을 위한 생성형 AI
생성형 AI는 아이디어 정리, 중복 식별, 초기 심사 지원, 시나리오 모델링을 수행할 수 있습니다. 이러한 기능이 의사결정 주기를 연장하지 않으면서 심사 능력을 향상시킨다면, 혁신 파이프라인 인텔리전스 시장은 그 혜택을 누리게 될 것입니다. 아이디어의 양이 증가하면 제약 조건은 제안 생성 단계에서 그 품질 및 실현 가능성 판단 단계로 이동합니다. 벤더는 AI를 활용한 점수 산정이 투명하고 추적 가능하며, 자원 배분에 유용하다는 점을 입증해야 합니다. 이는 경영진이나 컴플라이언스 팀이 추후 결정 내용을 검토할 때 특히 중요합니다. Wazoku사는 독자적인 ‘기대 가치’ 알고리즘을 사용하여 정량적인 측면에서 아이디어를 평가했습니다.
분산된 기업 시스템 전반에 걸친 통합의 복잡성
대규모 조직에서는 재무, 고객 데이터, 프로젝트, 인사, 협업, 제품 개발 등 각 분야에서 별도의 시스템이 사용되고 있기 때문에 통합이 과제가 됩니다. 혁신 도구는 프로젝트 비용, 자원 요구 사항 및 비즈니스 가치를 보여주기 위해 이러한 데이터가 필요합니다. 연결을 위해 맞춤형 설계, 테스트, 보안 검토 또는 IT 부서의 승인이 필요한 경우, 혁신 파이프라인 인텔리전스 시장에서 도입 기간이 길어질 수 있습니다. 혁신 팀은 기존 아키텍처 내에서의 위치를 평가하기 전에 플랫폼을 구매하는 경우가 있습니다. 연결이 불완전하면 플랫폼 데이터를 재무 데이터나 실행 데이터와 비교할 수 없게 되어 보고서의 정확도가 떨어집니다. 신뢰할 수 있는 통합을 실현하면 도입 기간을 단축하고 포트폴리오 보고서의 품질을 향상시킬 수 있습니다.
부문 분석
2025년, 혁신 파이프라인 인텔리전스 시장의 매출 중 솔루션이 81.23%를 차지했습니다. 이러한 선두 위상은 분산된 기업 팀에 의한 아이디어 관리, 포트폴리오 관리 및 기술 스카우팅 소프트웨어의 활용이 정착되었음을 반영합니다. 조직들은 혁신 프로그램 전반에 걸친 워크플로우 공유, 데이터 표준화, 보고서 작성 및 책임 소재를 명확히 하기 위해 통합형 솔루션을 선택하고 있습니다. 이 소프트웨어는 프로젝트 접수, 심사, 우선순위 지정, 자금 조달 요청, 협업 및 의사결정 기록을 지원합니다. 또한 리더가 사업 부문이나 거점을 넘나드는 프로젝트를 관리하는 데에도 도움이 됩니다.
서비스 부문은 2026년부터 2031년까지 연평균 성장률(CAGR) 8.12%를 나타낼 것으로 예측됩니다. 구매자는 프로그램 설계, 도입, 교육, 거버넌스, 성과 측정과 관련하여 지원을 필요로 하는 경우가 많습니다. 혁신 프로세스를 확립된 프로젝트 관리 및 승인 관행과 조화시켜야 하는 경우, 이러한 지원은 중요합니다. 벤더들은 도입률을 높이고 유용한 지표를 정의하기 위해 서비스 활용을 점점 더 늘리고 있습니다. 혁신 파이프라인 인텔리전스 업계에서는 제품 기능과 효과적인 제공을 결합한 공급업체가 높이 평가받고 있습니다.
2025년, 혁신 파이프라인 인텔리전스 시장 매출 중 클라우드 네이티브 SaaS가 76.42%를 차지했습니다. 이러한 우위는 초기 비용의 낮음, 신속한 도입, 빈번한 업데이트, 그리고 사내 업그레이드 필요성의 낮음에 기인합니다. 클라우드 시스템은 서로 다른 IT 환경과 거점에 걸쳐 공통된 서비스를 제공합니다. 이는 전용 인프라를 유지하고 싶지 않은 소규모 구매자에게 유용합니다. 업데이트를 통해 새로운 분석 기능, 보안 제어, AI 기능을 더 신속하게 활용할 수 있게 됩니다.
하이브리드 배포는 2026년부터 2031년까지 연평균 성장률(CAGR) 8.34%를 나타낼 것으로 예측됩니다. 규제 대상 조직의 경우, 기밀성이 높은 조사 데이터, 제품 데이터, 개인정보 또는 기밀 데이터를 정해진 장소 내에 보관해야 할 수 있습니다. EU AI법은 2026년 8월에 전면 시행되며, AI 시스템에 대한 문서화, 거버넌스 및 추적 가능성이 강조될 것입니다. 하이브리드 환경에서는 협업을 위해 클라우드 서비스를 활용하면서도 기밀성이 높은 워크로드에 대한 관리를 유지할 수 있습니다. 혁신 파이프라인 인텔리전스 시장은 단일 클라우드 모델이 아닌 유연한 아키텍처를 지원해야 합니다.
지역별 분석
2025년 혁신 파이프라인 인텔리전스 시장 매출 중 북미가 38.42%를 차지했습니다. 이는 확립된 기업 소프트웨어 구매, 플랫폼 공급업체, 클라우드 도입 및 공식 혁신 프로그램에 힘입어 미국이 주도하고 있습니다. 캐나다에서는 토론토, 몬트리올, 밴쿠버의 대학과 연계된 AI 연구를 통해 도입이 촉진되고 있는 반면, 멕시코에서는 다국적 기업의 도입 수요가 증가하고 있습니다. 북미의 구매자들은 AI를 활용한 평가, 분석 및 Microsoft 365나 Salesforce와의 통합과 관련하여 벤더의 로드맵을 형성하는 경우도 적지 않습니다.
유럽은 혁신 파이프라인 인텔리전스 시장에서 성숙한 단계에 있으며, 규제의 영향을 받기 쉬운 지역입니다. 독일, 영국, 프랑스는 제조업, 금융 서비스, 제약, 연구 네트워크 및 공공 부문 수요 측면에서 도입을 주도하고 있습니다. Qmarkets는 2025년 10월, 프랑스의 국가 공공 조달 기관인 UGAP의 인증 공급업체가 되었습니다. EU AI법은 2026년 8월에 전면적으로 적용될 예정이며, AI 거버넌스에 대한 관심이 높아지고 있습니다. 이탈리아, 스페인, 북유럽 국가들은 성장 시장인 반면, 남미 수요는 브라질과 멕시코에 집중되어 있습니다.
아시아태평양은 2031년까지 연평균 성장률(CAGR) 9.94%를 나타낼 것으로 예측되며, 이는 ‘혁신 파이프라인 인텔리전스 시장’에서 지역별 가장 높은 성장률입니다. 중국, 인도, 일본, 한국은 연구개발(R&D) 활동, 클라우드 인프라 및 혁신에 대한 공공 지원을 확대되고 있습니다. 중국의 민간 기술 기업들은 체계적인 혁신 실천을 확대되고 있습니다. 인도의 성장은 ‘스타트업 인디아(Startup India)’ 및 ‘디지털 인디아(Digital India)’ 프로그램과 밀접한 관련이 있으며, IT 서비스 기업들은 사내 프로그램에 AI와 머신러닝을 도입하고 있습니다. 일본은 제품 개발 거버넌스를 디지털화하고 있으며, 중동 수요는 UAE와 사우디아라비아의 혁신 프로그램에 의해 뒷받침되고 있습니다. 아프리카는 여전히 초기 단계에 있으며, 남아프리카공화국과 나이지리아가 도입의 주요 중심지가 되고 있습니다.
기타 혜택 :
- 엑셀 형식 시장 예측(ME) 시트
- 3개월간의 애널리스트 지원
자주 묻는 질문
목차
제1장 서론
제2장 조사 방법
제3장 주요 요약
제4장 시장 구도
제5장 시장 규모 및 성장 예측
제6장 경쟁 구도
제7장 시장 기회 및 향후 전망
KTH 26.09.10According to Mordor Intelligence, the innovation pipeline intelligence market size is projected to expand from USD 542.16 million in 2025 to USD 617.34 million in 2026, and to USD 911.02 million by 2031, registering a CAGR of 8.09% between 2026 and 2031.
This report is Segmented by Offering (Solutions, and Services), Deployment Model (Cloud-Native, Hybrid, and On-Premises), Organization Size (Large Enterprises, and Small and Medium-Sized Enterprises), Application (Idea Management Platforms, and More), Industry Vertical (Technology and Telecommunications, and More), and Geography. The Market Forecasts are Provided in Terms of Value (USD).
Global Innovation Pipeline Intelligence Market Trends and Insights
Enterprise Demand for Structured Innovation Pipelines
Organizations increasingly view unmanaged idea generation as a source of weak selection, duplicated work, and limited accountability. The Innovation Pipeline Intelligence Market addresses this concern through stage gates, evaluation criteria, portfolio records, and common workflows. These capabilities track proposals from submission through feasibility review, funding, implementation, and commercialization. Leaders need more than an idea repository because they must compare feasibility, resourcing, risk, strategic fit, and expected value. A documented decision trail becomes a procurement requirement when innovation leaders are accountable for returns. This makes governance platforms valuable even when software budgets are constrained.
Generative AI for Idea Evaluation and Portfolio Decisions
Generative AI can organize ideas, identify duplicates, support early screening, and model scenarios. The Innovation Pipeline Intelligence Market benefits when these functions increase review capacity without extending decision cycles. Greater idea volume shifts the constraint from generating proposals to judging their quality and feasibility. Vendors must demonstrate that AI-supported scoring is transparent, traceable, and useful for resource allocation. This is especially important when executives or compliance teams later review decisions. Wazoku uses its Expected Value algorithm to assess ideas across quantitative dimensions.
Integration Complexity Across Fragmented Enterprise Systems
Integration is challenging because large organizations use separate systems for finance, customer data, projects, human resources, collaboration, and product development. Innovation tools need this data to show project costs, resourcing needs, and business value. The Innovation Pipeline Intelligence Market can face longer deployments when connections require custom design, testing, security review, or IT approval. Innovation teams may buy platforms before assessing their place within existing architecture. Incomplete links weaken reporting when platform data cannot be compared with financial or execution data. Reliable integrations can shorten implementation and improve portfolio reporting.
Other drivers and restraints analyzed in the detailed report include:
- Cloud-First Procurement and Subscription Economics
- Rising R&D Intensity and Ecosystem-Based Innovation
- Low Conversion From Ideas to Commercialized Outcomes
For complete list of drivers and restraints, kindly check the Table Of Contents.
Segment Analysis
Solutions accounted for 81.23% of Innovation Pipeline Intelligence Market revenue in 2025. This lead reflects the established use of idea management, portfolio management, and technology scouting software by dispersed enterprise teams. Organizations choose integrated solutions for shared workflows, data standards, reporting, and ownership across innovation programs. The software supports intake, review, prioritization, funding requests, collaboration, and decision records. It also helps leaders manage projects across business units and locations.
Services are forecast to grow at an 8.12% CAGR from 2026 to 2031. Buyers often need help with program design, adoption, training, governance, and outcome measurement. Support is important when innovation processes must align with established project management and approval practices. Vendors increasingly use services to improve adoption and define useful metrics. The Innovation Pipeline Intelligence industry rewards providers that combine product capability with effective delivery.
Cloud-Native SaaS represented 76.42% of Innovation Pipeline Intelligence Market revenue in 2025. Its lead reflects lower upfront costs, faster implementation, more frequent updates, and a reduced need for internal upgrades. Cloud systems offer a common service across different IT environments and locations. This is useful for smaller buyers who do not want to maintain specialized infrastructure. Updates can make new analytics, security controls, and AI functions available faster.
Hybrid deployment is forecast to grow at an 8.34% CAGR between 2026 and 2031. Regulated organizations may need sensitive research, product, personal, or confidential data to remain within defined locations. The EU AI Act is fully applicable in August 2026 and emphasizes documentation, governance, and traceability for AI systems. Hybrid environments retain control over sensitive workloads while using cloud services for collaboration. The Innovation Pipeline Intelligence Market must support flexible architectures rather than a single cloud model.
Complete Report Scope:
- By Offering
- Solutions
- Services
- By Deployment Model
- Cloud-Native
- Hybrid
- On-Premises
- By Organization Size
- Large Enterprises
- Small and Medium-Sized Enterprises
- By Application
- Idea Management Platforms
- Portfolio and Project Management Platforms
- Technology Scouting and Open Innovation Platforms
- Innovation Analytics and Prediction Platforms
- Other Applications
- By Industry Vertical
- Technology and Telecommunications
- Manufacturing and Automotive
- Financial Services and Insurance
- Healthcare and Life Sciences
- Consumer Goods and Retail
- Energy and Utilities
- Government and Education
- By Geography
- North America
- United States
- Canada
- Mexico
- South America
- Brazil
- Argentina
- Chile
- Rest of South America
- Europe
- Germany
- United Kingdom
- France
- Italy
- Spain
- Rest of Europe
- Asia-Pacific
- China
- Japan
- India
- South Korea
- Australia
- Rest of Asia-Pacific
- Middle East
- United Arab Emirates
- Saudi Arabia
- Qatar
- Rest of Middle East
- Africa
- South Africa
- Egypt
- Nigeria
- Rest of Africa
- North America
Geography Analysis
North America accounted for 38.42% of Innovation Pipeline Intelligence Market revenue in 2025, led by the United States, driven by established enterprise software purchasing, platform suppliers, cloud adoption, and formal innovation programs. Canada has supported adoption through AI research linked to universities in Toronto, Montreal, and Vancouver, while Mexico is gaining demand from multinational deployments. North American buyers often shape vendor road maps for AI-assisted evaluation, analytics, and integrations with Microsoft 365 and Salesforce.
Europe is a mature, regulation-sensitive region for the Innovation Pipeline Intelligence Market. Germany, the United Kingdom, and France lead in adoption across manufacturing, financial services, pharmaceuticals, research networks, and public-sector demand. Qmarkets became an accredited supplier on UGAP, France's national public procurement agency, in October 2025. The EU AI Act will be fully applicable in August 2026 and has drawn attention to AI governance. Italy, Spain, and the Nordic countries are growing markets, while demand in South America is concentrated in Brazil and Mexico.
Asia-Pacific is forecast to grow at a 9.94% CAGR through 2031, the fastest regional rate in the Innovation Pipeline Intelligence Market. China, India, Japan, and South Korea combine to expand R&D activity, cloud infrastructure, and public support for innovation. China's private technology firms are increasing structured innovation practices. India's growth is linked to Startup India and Digital India programs, while IT services firms are adding AI and machine learning to internal programs. Japan is digitizing product-development governance, and demand in the Middle East is supported by transformation programs in the UAE and Saudi Arabia. Africa remains in its early stages, with South Africa and Nigeria as the main centers of adoption.
- Brightidea Inc.
- HYPE Innovation GmbH
- IdeaScale Inc.
- Qmarkets Ltd.
- Wazoku Ltd.
- Sopheon plc
- Planbox Inc.
- InnovationCast B.V.
- Ideanote ApS
- Agorize SAS
- Accept Mission B.V.
- Viima Solutions Oy
- AEVO Innovate
- Vianeo SAS
- Exago S.L.
- Nosco ApS
- Crowdicity Ltd.
- Innosabi GmbH
- ITONICS GmbH
- CrowdWorx GmbH
- Catapult Innovations Ltd.
- Ezassi, Inc.
- Questel SAS
- Planview, Inc.
- Collaboration.Ai, Inc.
Additional Benefits:
- The market estimate (ME) sheet in Excel format
- 3 months of analyst support
TABLE OF CONTENTS
1 INTRODUCTION
- 1.1 Study Assumptions and Market Definition
- 1.2 Scope of the Study
2 RESEARCH METHODOLOGY
3 EXECUTIVE SUMMARY
4 MARKET LANDSCAPE
- 4.1 Market Overview
- 4.2 Market Drivers
- 4.2.1 Enterprise Demand for Structured Innovation Pipelines
- 4.2.2 Cloud-First Procurement and Subscription Economics
- 4.2.3 Generative AI for Idea Evaluation and Portfolio Decisions
- 4.2.4 Rising R&D Intensity and Ecosystem-Based Innovation
- 4.2.5 Pressure to Demonstrate Innovation ROI
- 4.2.6 Regulated-Industry Demand for Traceable Innovation Governance
- 4.3 Market Restraints
- 4.3.1 Integration Complexity Across Fragmented Enterprise Systems
- 4.3.2 Low Conversion from Ideas to Commercialized Outcomes
- 4.3.3 Data Residency and Confidentiality Constraints
- 4.3.4 Change-Management Friction and Weak Executive Sponsorship
- 4.4 Impact of Macroeconomic Factors on the Market
- 4.5 Industry Value-Chain Analysis
- 4.6 Technology Outlook
- 4.7 Regulatory Landscape
- 4.8 Porter's Five Forces Analysis
- 4.8.1 Threat of New Entrants
- 4.8.2 Bargaining Power of Suppliers
- 4.8.3 Bargaining Power of Buyers
- 4.8.4 Threat of Substitutes
- 4.8.5 Intensity of Competitive Rivalry
5 MARKET SIZE AND GROWTH FORECASTS (VALUE)
- 5.1 By Offering
- 5.1.1 Solutions
- 5.1.2 Services
- 5.2 By Deployment Model
- 5.2.1 Cloud-Native
- 5.2.2 Hybrid
- 5.2.3 On-Premises
- 5.3 By Organization Size
- 5.3.1 Large Enterprises
- 5.3.2 Small and Medium-Sized Enterprises
- 5.4 By Application
- 5.4.1 Idea Management Platforms
- 5.4.2 Portfolio and Project Management Platforms
- 5.4.3 Technology Scouting and Open Innovation Platforms
- 5.4.4 Innovation Analytics and Prediction Platforms
- 5.4.5 Other Applications
- 5.5 By Industry Vertical
- 5.5.1 Technology and Telecommunications
- 5.5.2 Manufacturing and Automotive
- 5.5.3 Financial Services and Insurance
- 5.5.4 Healthcare and Life Sciences
- 5.5.5 Consumer Goods and Retail
- 5.5.6 Energy and Utilities
- 5.5.7 Government and Education
- 5.6 By Geography
- 5.6.1 North America
- 5.6.1.1 United States
- 5.6.1.2 Canada
- 5.6.1.3 Mexico
- 5.6.2 South America
- 5.6.2.1 Brazil
- 5.6.2.2 Argentina
- 5.6.2.3 Chile
- 5.6.2.4 Rest of South America
- 5.6.3 Europe
- 5.6.3.1 Germany
- 5.6.3.2 United Kingdom
- 5.6.3.3 France
- 5.6.3.4 Italy
- 5.6.3.5 Spain
- 5.6.3.6 Rest of Europe
- 5.6.4 Asia-Pacific
- 5.6.4.1 China
- 5.6.4.2 Japan
- 5.6.4.3 India
- 5.6.4.4 South Korea
- 5.6.4.5 Australia
- 5.6.4.6 Rest of Asia-Pacific
- 5.6.5 Middle East
- 5.6.5.1 United Arab Emirates
- 5.6.5.2 Saudi Arabia
- 5.6.5.3 Qatar
- 5.6.5.4 Rest of Middle East
- 5.6.6 Africa
- 5.6.6.1 South Africa
- 5.6.6.2 Egypt
- 5.6.6.3 Nigeria
- 5.6.6.4 Rest of Africa
- 5.6.1 North America
6 COMPETITIVE LANDSCAPE
- 6.1 Market Concentration
- 6.2 Strategic Moves
- 6.3 Market Share Analysis
- 6.4 Company Profiles (includes Global Level Overview, Market Level Overview, Core Segments, Financials as available, Strategic Information, Market Rank/Share, Products and Services, Recent Developments)
- 6.4.1 Brightidea Inc.
- 6.4.2 HYPE Innovation GmbH
- 6.4.3 IdeaScale Inc.
- 6.4.4 Qmarkets Ltd.
- 6.4.5 Wazoku Ltd.
- 6.4.6 Sopheon plc
- 6.4.7 Planbox Inc.
- 6.4.8 InnovationCast B.V.
- 6.4.9 Ideanote ApS
- 6.4.10 Agorize SAS
- 6.4.11 Accept Mission B.V.
- 6.4.12 Viima Solutions Oy
- 6.4.13 AEVO Innovate
- 6.4.14 Vianeo SAS
- 6.4.15 Exago S.L.
- 6.4.16 Nosco ApS
- 6.4.17 Crowdicity Ltd.
- 6.4.18 Innosabi GmbH
- 6.4.19 ITONICS GmbH
- 6.4.20 CrowdWorx GmbH
- 6.4.21 Catapult Innovations Ltd.
- 6.4.22 Ezassi, Inc.
- 6.4.23 Questel SAS
- 6.4.24 Planview, Inc.
- 6.4.25 Collaboration.Ai, Inc.
7 MARKET OPPORTUNITIES AND FUTURE OUTLOOK
- 7.1 White-Space and Unmet-Need Assessment