

|
시장보고서
상품코드
2100545
제조업 분야 디지털 전환 시장 : 시장 점유율 분석, 업계 동향 통계, 성장 예측(2026-2031년)Digital Transformation In Manufacturing - Market Share Analysis, Industry Trends & Statistics, Growth Forecasts (2026 - 2031) |
||||||
 Mordor Intelligence
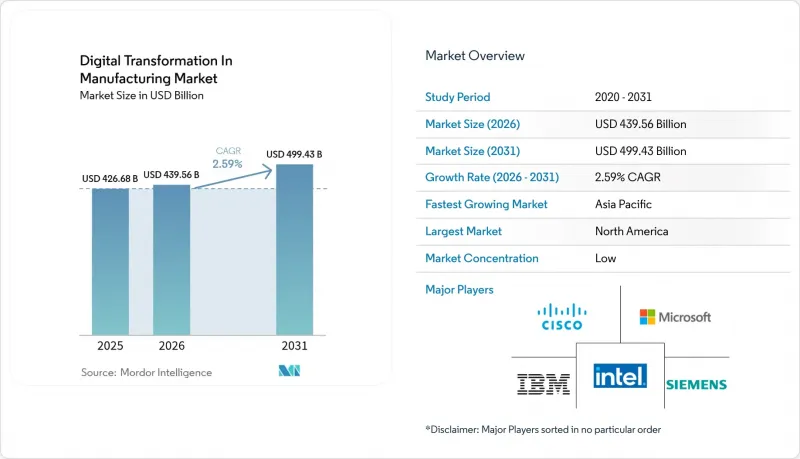
Mordor Intelligence에 의하면, 제조업 분야 디지털 전환 시장 규모는 2025년에 4,266억 8,000만 달러로 평가되었고, 2026년 4,395억 6,000만 달러에서 2031년까지 4,994억 3,000만 달러에 이를 것으로 예측되며, 2026-2031년 CAGR 2.59%로 성장할 전망입니다.
본 보고서는 기술 유형별(산업용 IoT 플랫폼, 로봇 공학 및 자동화 등), 도입 형태별(온프레미스, 클라우드 등), 기업 규모별(대기업, 중소기업), 최종 사용자 산업별(자동차, 항공우주 및 방위, 화학·소재, 식품 및 음료 등) 및 지역별로 분류되어 있습니다. 시장 전망은 금액(달러) 기준으로 제시되어 있습니다.
세계의 제조업 분야 디지털 전환 시장 동향 및 인사이트
산업용 IoT 플랫폼의 보급
산업용 IoT 플랫폼은 현재 예측 유지보수 및 인라인 품질 분석 기능을 생산 셀에 직접 통합하여, 자동차 및 항공우주 제조업체의 예기치 못한 가동 중단 시간을 최대 40%까지 줄이고 있습니다. 로봇, 무인 운반차(AGV), 시험대를 단일 디지털 스레드 하에 통합한 자동차 제조업체는 모델 전환 기간을 수 주에서 수일로 단축했으며, 이를 통해 맞춤형 트림 패키지의 생산 능력을 확보할 수 있게 되었습니다. 프라이빗 5G 도입으로 인해 과거 컨트롤러를 유선 연결에 묶어두었던 지연 문제가 해소되면서, IoT는 차세대 공장의 사실상 신경계 역할을 하고 있습니다. 조기 도입 기업들은 이상 감지 알고리즘이 스트리밍되는 센서 데이터를 기반으로 지속적으로 재학습을 수행하기 때문에 수율 향상이 분기마다 누적되고 있다고 보고하고 있습니다. 도입이 늦어지는 기업은 디지털 작업 지시서나 자가 복구형 생산 라인이 표준 조달 요건이 됨에 따라, 지속적인 비용 면에서 불이익을 입을 위험이 있습니다.
클라우드 네이티브 MES 및 SaaS 솔루션으로의 급속한 전환
구독형 MES 플랫폼은 막대한 설비 투자가 필요한 히스토리안이나 모니터링 시스템을 대체하며, 여러 거점의 기획 담당자는 수 주간에 걸친 ERP 재구성을 수행하는 대신 브라우저만으로 생산 균형을 재조정할 수 있게 됩니다. 2025년에는 1,000개 이상의 공장이 핵심 실행 기능을 클라우드로 이전했습니다. 이는 기존 제품군에서 50만 달러를 초과하는 영구 라이선스 비용을 훨씬 밑도는 종량제 가격 정책에 매력을 느꼈기 때문입니다. 현지 거점에서 호스팅되는 가상화 컨트롤러를 통해 안전상 중요한 루프는 온프레미스로 유지하면서, 대시보드, 머신러닝 훈련, 공급업체 포털은 오프프레미스에서 탄력적으로 확장됩니다. 이 모델은 그동안 데이터센터나 DevOps 팀을 보유하지 않았던 중소기업의 진입 장벽을 낮추고, 제조업 분야 디지털 전환 시장에서 공평한 경쟁 조건을 마련해 줍니다.
OT-IT 융합 분야의 기술 인력 부족
제조업 분야에서는 파이썬 코딩은 물론 래더 로직 문제 해결도 소화할 수 있는 엔지니어가 부족하여, 프로젝트 일정이 최대 2년까지 지연되고 있습니다. 교육 기관에서는 수백 명의 졸업생을 배출하고 있지만, 수요는 수천 명에 달하여 인력은 제조업 분야 디지털 전환 분야에서 가장 부족한 자원이 되고 있습니다. 대기업은 사내 부트캠프에 자금을 투입할 수 있는 반면, 중견 기업은 벤더의 전문 서비스를 기다려야 하기 때문에 이러한 인력 부족은 경쟁 격차를 확대시켜 직접 비용 증가와 기회 손실을 초래하고 있습니다. 자동화 벤더들은 로우코드 인터페이스로 대응하고 있지만, 복잡한 엣지 분석에는 여전히 해당 분야의 전문가가 필요하기 때문에 인적 자본이 병목 현상이 되고 있습니다.
부문 분석
2025년, 산업용 IoT 플랫폼은 제조업 분야 디지털 전환 시장 점유율의 34.42%를 차지했으며, 현장의 센서, 컨트롤러, 엔터프라이즈 애플리케이션을 연결하는 연결성의 첫 번째 계층으로서의 입지를 확고히 했습니다. 제조업 분야 디지털 전환 시장 규모에서 이 부분은 실시간 기계 데이터를 통합된 데이터 레이크로 집약하여, 예측 유지보수 알고리즘을 통해 계획 외 가동 중단 시간을 두 자릿수 비율로 줄일 수 있게 해줍니다. 현재 IoT 도입은 충분히 광범위한 단계에 도달했으며, 부가가치는 더욱 고도화된 용도으로 이동하고 있습니다. 바로 이러한 변화가 디지털 트윈 및 시뮬레이션 도구 시장 규모가 2031년까지 연평균 성장률(CAGR) 3.47%로 확대되고 있는 이유를 설명해 줍니다. 제조업체들은 가상 복제본을 활용하여 하드웨어가 현장에 도입되기 전에 조립 공정의 스트레스 테스트, 인체공학적 검증, 머신러닝 모델의 사전 훈련을 수행함으로써 프로그램 가동 기간을 수개월에서 수주일로 단축하고 있습니다.
로봇 공학, 적층 가공, 증강현실(AR)에 대한 지출은 여전히 중요한 수준을 유지하고 있지만, 그 성장세는 둔화되고 있습니다. 이는 많은 선행 도입 기업들이 하드웨어 추가 도입보다는 기존 생산 셀에서 생산성을 더욱 끌어내는 것을 우선시하고 있기 때문입니다. 과거에는 뒷전으로 밀리기 일쑤였던 사이버 보안도, 새로운 장치가 추가될 때마다 위협의 표적 범위가 넓어지기 때문에 현재는 자본 예산에서 독립된 항목으로 계상되고 있습니다. 비전 시스템에 내장된 엣지 프로세서는 테라바이트 규모의 이미지 데이터를 로컬에 저장함으로써 대역폭 비용을 대폭 절감하고, 인간의 눈으로는 도저히 따라잡을 수 없는 1초 미만의 검사 피드백 루프를 실현하고 있습니다. 예측 기간 동안 기술 선택은 기능의 수보다는 각 계층이 오픈 API에 얼마나 원활하게 통합되는지에 따라 좌우될 것입니다. 이를 통해 전체 스택을 재설계하지 않고도 향후 업그레이드가 가능해집니다.
2025년에는 온프레미스 도입이 지출의 56.91%를 차지한 것으로 평가되었으며, 이는 안전상 중요한 루프와 지적 재산을 엄격하게 관리하고자 하는 오랜 추세를 반영합니다. 그러나 하이브리드 및 엣지 구성이 4.82%라는 가장 높은 연평균 성장률(CAGR)을 기록하고 있으며, 공장 현장의 응답성과 클라우드의 확장성이라는 양자택일 구도가 해소되고 있기 때문에 온프레미스의 우위는 점차 약화되고 있습니다. 생산 팀은 현재 생산 라인에서 몇 미터 떨어진 마이크로 데이터센터에 결정론적 모션 제어 시스템을 배치하는 한편, 하이퍼스케일 지역에서 야간에 딥러닝 모델 훈련을 수행하고 있습니다. 이러한 분할 아키텍처를 통해 이미지 전송 대역폭을 약 80% 절감할 수 있으며, 제조업체는 분석 능력을 희생하지 않고도 데이터 주권 관련 조항을 준수할 수 있습니다.
밀리초 단위의 지연이 미션 크리티컬하지 않은 분야, 즉 공급업체와의 협업, 에너지 대시보드, 지속가능성 보고와 같은 분야에서는 여전히 순수한 클라우드 모델이 매력적입니다. 구매자에게 주는 교훈은 도입이 일회성 인프라 투자가 아니라 지속적인 워크로드 균형 조정 작업으로 변모하고 있다는 점입니다. 이러한 오케스트레이션을 자동화하는 벤더는 구체적인 비용 및 성능 면에서 우위를 제공합니다. 왜냐하면 공장 담당자가 금요일 야간 근무 중에 IP 주소 관리나 가상 머신 시동을 수행할 필요가 없어지기 때문입니다. 프라이빗 5G와 컨테이너화된 제어 소프트웨어가 성숙해짐에 따라, 제조업의 디지털 전환 시장에서는 택트 타임, 규제 요건 또는 제품 구성이 변화할 때, 연결성과 연산 위치를 자유롭게 조정 및 재설정할 수 있는 수단으로 활용될 것입니다.
지역별 분석
아시아태평양은 베이징과 뉴델리가 국내 IoT 및 분석 서비스 제공업체에 570억 달러의 인센티브를 투입하고 있어 연평균 3.54%라는 가장 높은 성장률을 기록하고 있습니다. 중국의 보조금 제도는 현지 스택 조달을 의무화하고 있으며, 이를 통해 화웨이와 알리바바 클라우드를 중심으로 한 병행 생태계가 조성되어 제조업 분야의 디지털 전환 시장 내 경쟁 역학이 재편되고 있습니다. 인도의 보조금 제도에서는 센서를 활용한 품질 관리와 연계된 ISO 9001 인증에 대해 포상금이 지급되고 있으며, 이를 통해 중소 부품 제조업체들이 데이터 플랫폼에 진출하도록 장려되고 있습니다. 일본과 한국은 로봇 공학 및 반도체 제조의 전 공정 자동화에 주력하고 있는 반면, 동남아시아의 전자 산업 거점들은 유럽으로부터 수주를 확보하기 위해 엔드투엔드 디지털 추적성을 요구하고 있습니다.
북미는 전기차 및 항공우주 분야의 조기 도입 기업과 3대 하이퍼스케일 클라우드의 존재로 인해 2025년 매출의 38.41%를 계속 차지하고 있습니다. 미국의 기가팩토리에서는 이미 프라이빗 5G를 통해 수천 대의 자율 이동 로봇을 연동하고 있으며, 연방 정부의 에너지 효율화 보조금 덕분에 공장은 전력 피크를 줄이는 엣지 AI 도입으로 나아가고 있습니다. 캐나다에서는 배터리 조립을 위한 디지털 트윈 시범 운영이 진행 중이며, 멕시코는 2시간 이내 배송을 보장하기 위해 실시간 가시성이 필요한 니어쇼어 공급업체를 유치하고 있습니다.
유럽은 급속한 보급과 규제상의 마찰 사이에서 진퇴양난에 처해 있습니다. 2027년에 시행될 ‘디지털 제품 여권’ 규정에 따라 배터리 및 섬유 제품 제조업체는 위조 불가능한 일련번호를 삽입해야 할 의무가 부과되며, 블록체인 지원 클라우드로의 전환이 가속화되는 한편, 분석 데이터는 데이터 주권 구역 간에 분산될 것입니다. 독일에서는 1억 4,000만 유로(1억 5,800만 달러) 규모의 ‘Manufacturing-X’ 바우처 제도를 통해 중소기업의 플랫폼 비용 절반을 지원하고 있습니다. 프랑스는 항공우주 분야의 검사 자동화에 자금을 지원하고 있으며, 영국은 로봇공학 분야에 대해 25%의 세액 공제를 시행하고 있습니다. 남미에서는 브라질과 아르헨티나를 중심으로 자동차 및 식품 공급망에 대한 지출이 집중되고 있습니다. 한편, 중동에서는 정부계 펀드를 통해 신규 스마트 팩토리에 자금을 지원하고 있습니다. 아프리카의 시범 사업은 여전히 소규모이지만, 전력 안정화에 대한 투자가 증가하고 있어 향후 10년 후반에는 보다 광범위한 프로그램이 전개될 가능성이 있습니다.
기타 혜택 :
- 엑셀 형식 시장 예측(ME) 시트
- 3개월간의 애널리스트 지원
자주 묻는 질문
목차
제1장 서론
제2장 조사 방법
제3장 주요 요약
제4장 시장 구도
제5장 시장 규모 및 성장 예측
제6장 경쟁 구도
제7장 시장 기회 및 향후 전망
AJY 26.08.07According to Mordor Intelligence, the digital transformation in manufacturing market size is projected to be USD 426.68 billion in 2025, USD 439.56 billion in 2026, and reach USD 499.43 billion by 2031, growing at a CAGR of 2.59% from 2026 to 2031.
This report is Segmented by Technology Type (Industrial IoT Platforms, Robotics and Automation, and More), Deployment Mode (On-Premises, Cloud, and More), Enterprise Size (Large Enterprises, and SMEs), End-User Industry (Automotive, Aerospace and Defense, Chemicals and Materials, Food and Beverage, and More), and Geography. The Market Forecasts are Provided in Terms of Value (USD).
Global Digital Transformation In Manufacturing Market Trends and Insights
Proliferation of Industrial IoT Platforms
Industrial IoT platforms now embed predictive maintenance and in-line quality analytics directly in production cells, cutting unplanned downtime for automotive and aerospace producers by up to 40%. Automakers that unify robots, automated guided vehicles and test benches under one digital thread have shortened model changeovers from weeks to days, which frees capacity for personalized trim packages. Private 5G removes the latency that once forced controllers to stay hard-wired, making IoT the de facto nervous system of next-generation plants. Early adopters report yield gains that compound every quarter because anomaly-detection algorithms continuously retrain on streaming sensor data. Delayed adopters risk permanent cost disadvantages as digital work-instructions and self-healing lines become standard procurement requirements.
Rapid Shift to Cloud-Native MES and SaaS Solutions
Subscription MES platforms replace cap-ex heavy historians and supervisory systems, allowing multi-site planners to rebalance production with a browser instead of weeks of ERP reconfiguration. More than one thousand plants moved core execution to the cloud during 2025, attracted by pay-as-you-go pricing that falls well below the half-million-dollar perpetual licenses of legacy suites. Virtualized controllers hosted on local outposts let safety-critical loops stay on-premises, while dashboards, machine learning training and supplier portals scale elastically off-premises. The model lowers barriers for small and medium enterprises that previously lacked data centers or DevOps teams, leveling the playing field across the digital transformation in manufacturing market.
Skills Shortage in OT-IT Convergence
Manufacturers lack engineers who can code Python and also troubleshoot ladder logic, stretching project timelines by up to two years. Training academies graduate hundreds yet demand runs into thousands, making talent the scarcest resource in the digital transformation in manufacturing industry. The deficit widens competitive gaps because large enterprises fund internal boot camps, while mid-tiers must wait for vendor professional services, adding direct cost and lost opportunity. Automation suppliers respond with low-code interfaces, but complex edge analytics still requires domain specialists, so human capital remains the bottleneck.
Other drivers and restraints analyzed in the detailed report include:
- Government Incentives for Industry 4.0 Adoption
- Availability of Private 5G Networks for Ultra-Reliable Low-Latency Control
- Escalating Cybersecurity Vulnerabilities Across Brown-Field Assets
For complete list of drivers and restraints, kindly check the Table Of Contents.
Segment Analysis
Industrial IoT platforms captured 34.42% of the digital transformation in manufacturing market share in 2025, underscoring their position as the first layer of connectivity that links shop-floor sensors, controllers and enterprise applications. This portion of the digital transformation in manufacturing market size channels real-time machine data into unified data lakes, allowing predictive maintenance algorithms to cut unplanned downtime by double-digit percentages. IoT adoption is now broad enough that incremental value shifts toward higher-order applications, and that shift explains why digital twin and simulation tools are scaling at a 3.47% CAGR through 2031. Manufacturers use virtual replicas to stress-test assembly sequences, validate ergonomics and pre-train machine-learning models before hardware is on the floor, shrinking program launches from months to weeks.
Spending on robotics, additive manufacturing and augmented reality remains meaningful but grows more slowly, because most early movers prefer to extract additional yield from existing cells rather than install more hardware. Cybersecurity, once an afterthought, now appears on capital budgets as a distinct line item because every new device widens the threat surface. Edge processors packed into vision systems keep terabytes of images local, slashing bandwidth fees and enabling sub-second inspection feedback loops that human eyes cannot match. Over the forecast window, technology choices will be driven less by feature counts and more by how seamlessly each layer plugs into open APIs, so that future upgrades can happen without re-engineering the entire stack.
On-premises installations held 56.91% of spending in 2025, reflecting a long-standing preference for tight control over safety-critical loops and intellectual property. That dominance is eroding as hybrid and edge configurations record the fastest 4.82% CAGR, removing the binary choice between plant-floor responsiveness and cloud scalability. Production teams now place deterministic motion control on micro-data-centers a few meters from the line, while training deep-learning models in hyperscale regions overnight. This split architecture trims image-transfer bandwidth by roughly 80% and lets manufacturers stay compliant with data-sovereignty clauses without forgoing analytics firepower.
Pure cloud models still appeal for supplier collaboration, energy dashboards and sustainability reporting, where millisecond latency is not mission-critical. The lesson for buyers is that deployment is becoming an ongoing workload-balancing exercise rather than a one-time infrastructure bet. Vendors that automate this orchestration create tangible cost and performance advantages, because plant personnel no longer need to manage IP addresses or spin up virtual machines on Friday night shifts. As private 5G and containerized control software mature, the digital transformation in manufacturing market will treat connectivity and compute location as levers that can be pulled and reset whenever takt times, regulatory demands or product mixes change.
Complete Report Scope:
- By Technology Type
- Industrial IoT Platforms
- Robotics and Automation
- Additive Manufacturing and 3D Printing
- Digital Twin and Simulation
- Cyber-Security Solutions
- Cloud Manufacturing Execution Systems
- Artificial Intelligence and Advanced Analytics
- Augmented and Virtual Reality
- Edge Computing Infrastructure
- Other Technology Types
- By Deployment Mode
- On-Premises
- Cloud
- Hybrid and Edge
- By Enterprise Size
- Large Enterprises
- Small and Medium Enterprises (SMEs)
- By End-User Industry
- Automotive
- Aerospace and Defense
- Electronics and Semiconductors
- Chemicals and Materials
- Food and Beverage
- Pharmaceuticals and Medical Devices
- Heavy Machinery and Industrial Equipment
- Consumer Goods
- Other End-User Industries
- By Geography
- North America
- United States
- Canada
- Mexico
- South America
- Brazil
- Argentina
- Rest of South America
- Europe
- Germany
- United Kingdom
- France
- Italy
- Spain
- Russia
- Rest of Europe
- Asia-Pacific
- China
- Japan
- India
- South Korea
- South East Asia
- Australia and New Zealand
- Rest of Asia-Pacific
- Middle East
- Saudi Arabia
- United Arab Emirates
- Turkey
- Rest of Middle East
- Africa
- South Africa
- Nigeria
- Egypt
- Rest of Africa
- North America
Geography Analysis
Asia-Pacific posts the highest 3.54% annual growth as Beijing and New Delhi channel USD 57 billion of incentives into domestic IoT and analytics providers. Chinese subsidies mandate local stack procurement, fostering parallel ecosystems around Huawei and Alibaba Cloud and reshaping competitive dynamics of the digital transformation in manufacturing market. Indian disbursements reward ISO 9001 certification tied to sensor-based quality, pulling small component makers onto data platforms. Japan and South Korea focus on robotics and front-end semiconductor automation, while Southeast Asian electronics hubs demand end-to-end digital traceability to win European orders.
North America retains 38.41% of 2025 sales thanks to early electric-vehicle and aerospace adopters and the presence of the three largest hyperscale clouds. U.S. gigafactories already coordinate thousands of autonomous mobile robots over private 5G, and federal energy-efficiency grants steer plants toward edge AI that trims electricity peaks. Canada pilots digital twins for battery assembly, and Mexico attracts near-shored suppliers that need real-time visibility to guarantee two-hour delivery windows.
Europe sits between rapid adoption and regulatory friction. The Digital Product Passport rule, enforceable in 2027, forces battery and textile producers to embed immutable serialization, accelerating migration to blockchain-ready clouds yet splintering analytics across data-sovereign zones. Germany's EUR 140 million (USD 158 million) Manufacturing-X vouchers subsidize half of small enterprise platform costs, France funds aerospace inspection automation, and the United Kingdom offers twenty-five percent tax relief on robotics. South America concentrates spending in Brazil and Argentina across automotive and food chains, while the Middle East funds greenfield smart factories through sovereign wealth channels. Africa's pilots remain small but rising power-stability investments may unlock broader programs later in the decade.
- Siemens AG
- Schneider Electric SE
- Cisco Systems Inc.
- IBM Corporation
- Microsoft Corporation
- Intel Corporation
- SAP SE
- Oracle Corporation
- Honeywell International Inc.
- Rockwell Automation Inc.
- PTC Inc.
- Dassault Systemes SE
- ABB Ltd.
- Fanuc Corporation
- Mitsubishi Electric Corporation
- General Electric Company
- Bosch Rexroth AG
- Aveva Group plc
- Autodesk Inc.
- Emerson Electric Co.
- Yokogawa Electric Corporation
- Plex Systems Inc.
- Tulip Interfaces Inc.
- Hewlett Packard Enterprise Company
- Nokia Corporation
- Stratasys Ltd.
- UiPath Inc.
- Tata Consultancy Services Ltd.
Additional Benefits:
- The market estimate (ME) sheet in Excel format
- 3 months of analyst support
TABLE OF CONTENTS
1 INTRODUCTION
- 1.1 Study Assumptions and Market Definition
- 1.2 Scope of the Study
2 RESEARCH METHODOLOGY
3 EXECUTIVE SUMMARY
4 MARKET LANDSCAPE
- 4.1 Market Overview
- 4.2 Market Drivers
- 4.2.1 Proliferation of Industrial IoT Platforms
- 4.2.2 Rapid Shift to Cloud-Native MES and SaaS Solutions
- 4.2.3 Government Incentives for Industry 4.0 Adoption
- 4.2.4 Availability of Private 5G Networks for Ultra-Reliable, Low-Latency Control
- 4.2.5 Integration of Quantum-Inspired Optimization for Complex Scheduling
- 4.2.6 Surge in Digital Product Passports Mandating End-to-End Traceability
- 4.3 Market Restraints
- 4.3.1 Skills Shortage in OT-IT Convergence
- 4.3.2 Escalating Cybersecurity Vulnerabilities Across Brown-Field Assets
- 4.3.3 Rising Proprietary Data-Sovereignty Clauses Restricting Multi-Plant Analytics
- 4.3.4 Hidden Carbon Footprint of High-Performance Compute Clusters
- 4.4 Industry Value Chain Analysis
- 4.5 Regulatory Landscape
- 4.6 Technological Outlook
- 4.7 Impact of Macroeconomic Factors on the Market
- 4.8 Porter's Five Forces Analysis
- 4.8.1 Bargaining Power of Suppliers
- 4.8.2 Bargaining Power of Buyers
- 4.8.3 Threat of New Entrants
- 4.8.4 Threat of Substitutes
- 4.8.5 Intensity of Competitive Rivalry
5 MARKET SIZE AND GROWTH FORECASTS (VALUE)
- 5.1 By Technology Type
- 5.1.1 Industrial IoT Platforms
- 5.1.2 Robotics and Automation
- 5.1.3 Additive Manufacturing and 3D Printing
- 5.1.4 Digital Twin and Simulation
- 5.1.5 Cyber-Security Solutions
- 5.1.6 Cloud Manufacturing Execution Systems
- 5.1.7 Artificial Intelligence and Advanced Analytics
- 5.1.8 Augmented and Virtual Reality
- 5.1.9 Edge Computing Infrastructure
- 5.1.10 Other Technology Types
- 5.2 By Deployment Mode
- 5.2.1 On-Premises
- 5.2.2 Cloud
- 5.2.3 Hybrid and Edge
- 5.3 By Enterprise Size
- 5.3.1 Large Enterprises
- 5.3.2 Small and Medium Enterprises (SMEs)
- 5.4 By End-User Industry
- 5.4.1 Automotive
- 5.4.2 Aerospace and Defense
- 5.4.3 Electronics and Semiconductors
- 5.4.4 Chemicals and Materials
- 5.4.5 Food and Beverage
- 5.4.6 Pharmaceuticals and Medical Devices
- 5.4.7 Heavy Machinery and Industrial Equipment
- 5.4.8 Consumer Goods
- 5.4.9 Other End-User Industries
- 5.5 By Geography
- 5.5.1 North America
- 5.5.1.1 United States
- 5.5.1.2 Canada
- 5.5.1.3 Mexico
- 5.5.2 South America
- 5.5.2.1 Brazil
- 5.5.2.2 Argentina
- 5.5.2.3 Rest of South America
- 5.5.3 Europe
- 5.5.3.1 Germany
- 5.5.3.2 United Kingdom
- 5.5.3.3 France
- 5.5.3.4 Italy
- 5.5.3.5 Spain
- 5.5.3.6 Russia
- 5.5.3.7 Rest of Europe
- 5.5.4 Asia-Pacific
- 5.5.4.1 China
- 5.5.4.2 Japan
- 5.5.4.3 India
- 5.5.4.4 South Korea
- 5.5.4.5 South East Asia
- 5.5.4.6 Australia and New Zealand
- 5.5.4.7 Rest of Asia-Pacific
- 5.5.5 Middle East
- 5.5.5.1 Saudi Arabia
- 5.5.5.2 United Arab Emirates
- 5.5.5.3 Turkey
- 5.5.5.4 Rest of Middle East
- 5.5.6 Africa
- 5.5.6.1 South Africa
- 5.5.6.2 Nigeria
- 5.5.6.3 Egypt
- 5.5.6.4 Rest of Africa
- 5.5.1 North America
6 COMPETITIVE LANDSCAPE
- 6.1 Market Concentration
- 6.2 Strategic Moves
- 6.3 Market Share Analysis
- 6.4 Company Profiles (includes Global Level Overview, Market Level Overview, Core Segments, Financials as available, Strategic Information, Market Rank/Share, Products and Services, Recent Developments)
- 6.4.1 Siemens AG
- 6.4.2 Schneider Electric SE
- 6.4.3 Cisco Systems Inc.
- 6.4.4 IBM Corporation
- 6.4.5 Microsoft Corporation
- 6.4.6 Intel Corporation
- 6.4.7 SAP SE
- 6.4.8 Oracle Corporation
- 6.4.9 Honeywell International Inc.
- 6.4.10 Rockwell Automation Inc.
- 6.4.11 PTC Inc.
- 6.4.12 Dassault Systemes SE
- 6.4.13 ABB Ltd.
- 6.4.14 Fanuc Corporation
- 6.4.15 Mitsubishi Electric Corporation
- 6.4.16 General Electric Company
- 6.4.17 Bosch Rexroth AG
- 6.4.18 Aveva Group plc
- 6.4.19 Autodesk Inc.
- 6.4.20 Emerson Electric Co.
- 6.4.21 Yokogawa Electric Corporation
- 6.4.22 Plex Systems Inc.
- 6.4.23 Tulip Interfaces Inc.
- 6.4.24 Hewlett Packard Enterprise Company
- 6.4.25 Nokia Corporation
- 6.4.26 Stratasys Ltd.
- 6.4.27 UiPath Inc.
- 6.4.28 Tata Consultancy Services Ltd.
7 MARKET OPPORTUNITIES AND FUTURE OUTLOOK
- 7.1 White-Space and Unmet-Need Assessment


