

|
시장보고서
상품코드
2100602
제3자 물류(3PL) 시장 : 점유율 분석, 업계 동향 및 통계, 성장 예측(2026-2031년)Third-Party Logistics (3PL) - Market Share Analysis, Industry Trends & Statistics, Growth Forecasts (2026 - 2031) |
||||||
 Mordor Intelligence
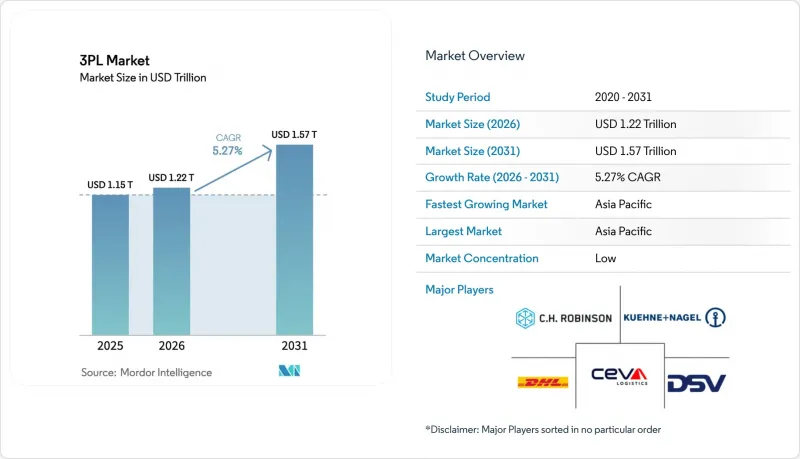
제3자 물류(3PL) 시장 규모는 2026년에 1조 2,200억 달러로 추정되고 있어 예측 기간(2026-2031년)에서 CAGR 5.27%로 확대되어 2031년에는 1조 5,700억 달러에 이를 전망입니다.
본 보고서는 서비스별(국내 운송 관리, 국제 운송 관리 등), 최종 사용자별(자동차, 에너지·유틸리티, 제조업 등), 물류 모델별(애셋 라이트, 애셋 헤비, 하이브리드), 지역별(북미, 남미, 유럽, 아시아태평양 등)로 분류되어 있습니다. 시장 전망은 금액(달러)으로 제시되어 있습니다.
세계 제3자 물류(3PL) 시장 동향 및 인사이트
비용 효율화 및 자산 경량화를 위한 아웃소싱
기업들은 고정적인 물류 비용을 변동비로 전환하고, 혁신을 위해 자금을 재배분하기 위해 아웃소싱을 더욱 추진했습니다. 자산 경량화 모델은 이미 제3자 물류(3PL) 시장의 55.13%를 차지하고 있으며, 이는 대차대조표의 유연성을 높이려는 경영진 차원의 지침을 반영한 것입니다. 변동적인 용량은 수요의 급격한 변동을 완화하며, 위험물 취급에서 초저온 콜드체인에 이르는 전문적인 기술도 수년에 걸친 설비 투자가 아닌 단일 청구서로 제공됩니다. 리드 로지스틱스 및 4PL 프레임워크를 통해 공급업체 목록이 통합되어 화주에게는 통합된 성과 대시보드와 간소화된 거버넌스가 제공되는 한편, 공급업체는 파트너 네트워크를 총괄함으로써 규모의 경제를 실현하고 있습니다.
AI를 활용한 컨트롤 타워형 물류 도입
컨트롤 타워 플랫폼에 내장된 머신러닝 엔진은 현재 혼란을 예측하고, 서비스 비용을 최적화한 경로를 제안하며, 자동화된 복구 조치를 시작하고 있습니다. 페덱스가 2024년에 ShipMatrix를 인수함에 따라 예측 분석 기능이 도입되어 예상 도착 시간(ETA)의 정확도가 향상되었고, 예외 처리와 관련된 수작업이 감소했습니다. 제3자 물류(3PL) 시장 전반에서도 유사한 움직임이 관찰되고 있으며, 납기 엄수 및 완전 납품이라는 지표가 필수 조건이 되는 가운데, 기술은 백오피스 도구에서 전략적 우위로 그 역할을 재정의하고 있습니다. 텔레매틱스, IoT 센서, 운송업체 API의 통합을 통해 데이터 레이크가 구축되고, 알고리즘이 지속적으로 정교해짐에 따라 연료비, 체류비, 재고 일수 측면에서 측정 가능한 비용 절감이 실현되고 있습니다.
창고 인력 부족과 임금 인플레이션
2025년, 미국에서는 운송·창고 업계에서 40만 명의 인력 부족이 기록되었습니다. 임금은 연간 8-12% 상승하여, 이미 연료 할증료로 인해 압박받고 있던 이익률을 더욱 악화시키고 있습니다. 이직률이 50% 이상의 상황은 채용 예산을 압박할 뿐만 아니라, 특히 자격을 갖춘 인력이 필요한 온도 관리 화물이나 위험물과 같은 틈새 분야에서 서비스의 정확성을 위협하고 있습니다. 자동화가 일조할 수는 있지만, 자본 측면의 장벽이 도입을 지연시키고 있어, 많은 제3자 물류(3PL) 시장 참여자들은 인건비 상승과 고객의 운임 인상 거부라는 양쪽에서 압박받는 상황에 놓여 있습니다.
부문 분석
2025년, 국내 운송 관리는 제3자 물류(3PL) 시장 규모의 45.64%를 차지하며, 2031년까지 연평균 성장률(CAGR) 5.91%를 나타낼 것으로 전망됩니다. '당일 배송'이나 '익일 배송' 약속에 따른 소포 발송량은 계속 증가하고 있으며, 서비스 제공업체들은 라스트 마일 네트워크의 밀도를 높이고 배송 비용을 절감하는 AI 경로 엔진을 도입할 수밖에 없는 상황입니다. 도어 투 도어(door-to-door) 방식의 유연성 덕분에 국내 매출의 70% 가까이를 육상 화물 운송이 차지하고 있지만, 장거리 운송의 경우 철도 운송의 경제성이 트럭 단독 운송을 능가하기 때문에 복합 운송 솔루션이 지지를 얻고 있습니다. 화이트 글러브 서비스나 특대형 물품 취급에 대한 수요는 업무의 복잡성을 가중시키고 있지만, 이로 인해 전문 장비와 훈련을 받은 직원을 보유한 사업자가 유리한 입지를 점하고 있습니다.
2026년 이후, 당일 배송에 대한 기대는 교외 및 지방 도시의 소비자들에게도 확산될 전망이며, 소포 운송 밀도는 더욱 높아질 것입니다. 전국 규모의 허브를 대신해 지역별 풀필먼트가 주류를 이루는 가운데, 제3자 물류(3PL) 시장에 진출한 기업들은 예측 재고 배치와 통합된 소규모 크로스독에 대한 투자를 추진하고 있습니다. 운전자 부족과 전자운전기록장치(ELD)와 관련된 가동률 저하로 인해 사업자들은 도시 지역의 배기가스 규제에 대응하기 위해 자율주행 트럭의 시범 운영과 전기 배송 밴 도입을 추진하고 있습니다. 기술을 최우선으로 여기는 신규 진출기업들은 API 네이티브 TMS 플랫폼을 활용해 DTC 브랜드를 유치하고 있으며, 기존 기업들은 가시화 서비스를 혁신해야 하는 압박을 받고 있습니다. 그렇지 않으면 시장 점유율 하락을 초래할 우려가 있습니다.
지역별 분석
아시아태평양은 2025년에 전 세계 매출의 41.02%를 차지하며, 2031년까지 연평균 성장률(CAGR) 6.36%를 기록할 전망입니다. 중국은 소포 밀도와 옴니채널의 고도화를 주도하고 있지만, 제조 리스크 분산화를 통해 베트남, 인도네시아, 인도에 대한 새로운 투자가 진행되고 있습니다. 내륙 각 성에서는 고급 식품 및 백신 유통을 뒷받침하는 콜드체인 구축이 호재로 작용하고 있습니다. 한편, 일본과 한국에서는 로봇을 적극 활용한 풀필먼트와 프리미엄 서비스에 대한 기대가 높아지고 있어, 자동화 및 부가가치 조립 서비스를 제공하는 제3자 물류(3PL) 시장 진출기업들에게 혜택을 주고 있습니다.
북미는 선진적인 인프라와 높은 디지털 보급률을 유지하고 있습니다. 미국에서는 수입 파트너로서 멕시코가 중국을 제치고 국경을 넘는 화물량이 급증하고 있으며, 이에 따라 드레이지 야드 및 국경 인근의 시퀀싱 센터에 대한 수요가 높아지고 있습니다. 캐나다의 ‘퍼시픽 게이트웨이’는 아시아에서 수입된 물품을 중서부 지역 소비자에게 전달하고 있으며, 한편 멕시코의 자동차 산업 클러스터는 ‘저스트-인-시퀀싱(Just-in-Sequence)’ 방식을 통해 부품 흐름을 촉진하고 있습니다. 인력 부족이 자동화 투자를 촉진하고 있으며, 텍사스주와 캘리포니아주 간 반복적인 노선에서 자율주행 트럭의 시범 도입이 진행되고 있습니다.
남미, 중동 및 아프리카는 시장 점유율 면에서는 뒤처져 있지만, 비대칭적인 성장 가능성을 내포하고 있습니다. 브라질에서는 전자상거래의 급증으로 항만 및 도로 수용 능력에 부담이 가중되고 있으나, 산토스와 내륙 주를 연결하는 복합 운송 회랑에 대한 투자를 유치하고 있습니다. 중동에서는 석유 달러의 다각화가 자유무역지대와 항공 화물 슈퍼허브로 이어지고 있으며, 두바이와 리야드는 대륙 횡단 환적 거점으로서의 위상을 확립하고 있습니다. 아프리카의 AfCFTA(아프리카 대륙 자유무역협정)는 제각각인 관세 제도의 통일을 목표로 하고 있으며, 제3자 물류(3PL) 시장에서 지역 횡단형 컨트롤 타워와 라스트 마일 네트워크를 조기에 구축한 기업은 개인 소비 증가에 따라 선구자로서의 우위를 누릴 수 있을 전망입니다.
기타 혜택:
- 엑셀 형식 시장 예측(ME) 시트
- 3개월간의 애널리스트 지원
자주 묻는 질문
목차
제1장 서론
제2장 조사 방법
제3장 주요 요약
제4장 시장 구도
제5장 시장 규모와 성장 예측
제6장 경쟁 구도
제7장 시장 기회와 향후 전망
JHS 26.08.11According to Mordor Intelligence, the third-Party logistics (3PL) market size is estimated at USD 1.22 trillion in 2026, and is expected to reach USD 1.57 trillion by 2031, at a CAGR of 5.27% during the forecast period (2026-2031).
This report is Segmented by Service (Domestic Transportation Management, International Transportation Management, and More), by End User (Automotive, Energy and Utilities, Manufacturing and More), by Logistics Model (Asset-Light, Asset-Heavy, and Hybrid), by Region (North America, South America, Europe, Asia-Pacific and More). The Market Forecasts are Provided in Terms of Value (USD).
Global Third-Party Logistics (3PL) Market Trends and Insights
Outsourcing for Cost-Efficiency & Asset-Light Focus
Enterprises deepened outsourcing to convert fixed logistics costs into variable terms and redirect cash toward innovation. Asset-light models already make up 55.13% of the Third-Party Logistics (3PL) Market , a reflection of board-level mandates for balance-sheet agility. Variable capacity cushions demand shocks, and specialized skills ranging from hazardous materials handling to ultra-cold chain arrive wrapped in a single invoice rather than multiyear capex. Lead-logistics and 4PL frameworks consolidate vendor rosters, granting shippers unified performance dashboards and streamlined governance while providers unlock scale by orchestrating partner networks.
AI-Enabled Control-Tower Logistics Adoption
Machine-learning engines embedded in control-tower platforms now predict disruptions, suggest cost-to-serve-optimized routes, and initiate automated recovery steps. FedEx's 2024 purchase of ShipMatrix injected predictive analytics that sharpened ETA accuracy and reduced manual exception labor. Similar moves across the Third-Party Logistics (3PL) Market are recasting technology from back-office tool to strategic moat as on-time-in-full metrics become table stakes. Integration of telematics, IoT sensors, and carrier APIs feeds data lakes that continually refine algorithms, driving measurable savings in fuel, detention, and inventory days of supply.
Warehouse-Labor Scarcity & Wage Inflation
The United States logged a 400,000-worker shortfall in transportation and warehousing roles during 2025. Pay climbed 8-12% annually, squeezing margins already thinned by fuel surcharges. Turnover exceeding 50% burns recruitment budgets and imperils service accuracy, especially for temperature-controlled and hazardous-materials niches requiring certified staff. While automation offers relief, capital hurdles slow adoption, leaving many Third-Party Logistics (3PL) Market players caught between rising payrolls and customer rate resistance.
Other drivers and restraints analyzed in the detailed report include:
- Near-/Friend-Shoring Redefining Trade Corridors
- ESG-Driven "Green Logistics" Premium Services
- Cybersecurity Exposure from Multi-Tenant Platforms
For complete list of drivers and restraints, kindly check the Table Of Contents.
Segment Analysis
Domestic transportation management held a 45.64% share of the Third-Party Logistics (3PL) Market size in 2025 and is forecast to log a 5.91% CAGR to 2031. Parcel outflows tied to same-day and next-day promises continue to swell, compelling providers to densify last-mile networks and deploy AI route engines that compress delivery costs. Road freight accounts for nearly 70% of domestic revenue thanks to door-to-door flexibility, while intermodal solutions gain favor on long hauls where rail economics beat pure truckload. Demand for white-glove and oversized-item handling is adding complexity that rewards operators with specialized equipment and trained crews.
Beyond 2026, same-day expectations will likely reach suburban and secondary-city consumers, further swelling parcel density. As regional fulfillment replaces national hubs, Third-Party Logistics (3PL) Market participants invest in smaller cross-docks integrated with predictive inventory positioning. Driver shortages and ELD-related utilization dips are nudging providers toward autonomous-truck pilots and electric delivery vans that tackle urban emission regulations. Technology-first entrants wield API-native TMS platforms that court DTC brands, forcing incumbents to refresh visibility offerings or risk share erosion.
Complete Report Scope:
- By Service
- Domestic Transportation Management (DTM)
- Roadways
- Railways
- Airways
- Waterways
- International Transportation Management (ITM)
- Roadways
- Railways
- Airways
- Waterways
- Value-Added Warehousing and Distribution (VAWD)
- Domestic Transportation Management (DTM)
- By End User
- Automotive
- Energy and Utilities
- Manufacturing
- Life Sciences and Healthcare
- Technology and Electronics
- Retail and E-commerce
- Consumer Goods and FMCG
- Food and Beverages
- Others
- By Logistics Model
- Asset-Light (Management-Based)
- Asset-Heavy (Own Fleet and Warehouses)
- Hybrid
- By Region
- North America
- United States
- Canada
- Mexico
- South America
- Brazil
- Argentina
- Chile
- Rest of South America
- Europe
- Germany
- United Kingdom
- France
- Spain
- Italy
- Netherlands
- Russia
- Rest of Europe
- Asia-Pacific
- China
- India
- Japan
- South Korea
- Singapore
- Vietnam
- Indonesia
- Australia
- Rest of Asia-Pacific
- Middle East and Africa
- United Arab Emirates
- Saudi Arabia
- South Africa
- Nigeria
- Rest of Middle East and Africa
- North America
Geography Analysis
Asia-Pacific generated 41.02% of global revenue in 2025 and is on track for a 6.36% CAGR through 2031. China drives scale in parcel density and omnichannel sophistication, yet manufacturing risk diversification steers fresh investment to Vietnam, Indonesia, and India. Inland provinces benefit from cold-chain rollouts that support premium food and vaccine distribution. Meanwhile, Japan and South Korea showcase robotics-dense fulfillment and premium service expectations, rewarding Third-Party Logistics (3PL) Market participants that offer automation and value-added assembly.
North America retains advanced infrastructure and high digital adoption. The United States sees cross-border volume surging as Mexico overtakes China among import partners, amplifying demand for drayage yards and near-border sequencing centers. Canada's Pacific Gateway funnels Asian imports to Midwest consumers, while Mexico's automotive clusters spur just-in-sequence parts flows. Labor scarcity pushes automation spend, fostering pilot deployments of autonomous trucks on repetitive lanes between Texas and California.
South America, the Middle East, and Africa trail in share yet offer asymmetric upside. Brazil's e-commerce surge strains port and road capacity but invites investment in multimodal corridors linking Santos to interior states. The Middle East channels petro-dollar diversification into free-trade zones and air-cargo super hubs, positioning Dubai and Riyadh as cross-continental transshipment pivots. Africa's AfCFTA aims to unify a patchwork of customs regimes, and early movers in the Third-Party Logistics (3PL) Market who establish pan-regional control towers and last-mile networks stand to capture first-mover premiums as consumer spending rises.
- DHL Supply Chain and Global Forwarding
- Kuehne + Nagel International AG
- GXO Logistics
- C.H. Robinson Worldwide Inc.
- DSV A/S
- Nippon Express Holdings
- Sinotrans Ltd.
- CEVA Logistics (CMA CGM)
- XPO Inc.
- FedEx Logistics
- UPS Supply Chain Solutions
- GEODIS
- Kerry Logistics Network
- Yusen Logistics (NYK)
- Hitachi Transport System (LOGISTEED)
- J.B. Hunt Transport Services Inc.
- CJ Logistics
- Samsung SDS
- Americold Logistics LLC
- Penske Logistics
- Expeditors
Additional Benefits:
- The market estimate (ME) sheet in Excel format
- 3 months of analyst support
TABLE OF CONTENTS
1 Introduction
- 1.1 Study Assumptions and Market Definition
- 1.2 Scope of the Study
2 Research Methodology
3 Executive Summary
4 Market Landscape
- 4.1 Market Overview
- 4.2 Market Drivers
- 4.2.1 Explosive e-commerce & omni-channel fulfillment
- 4.2.2 Globalization & cross-border trade rebound
- 4.2.3 Outsourcing for cost-efficiency & asset-light focus
- 4.2.4 AI-enabled control-tower logistics adoption
- 4.2.5 Near-/friend-shoring redefining trade corridors
- 4.2.6 ESG-driven "green logistics" premium services
- 4.3 Market Restraints
- 4.3.1 Volatile fuel & freight-rate environment
- 4.3.2 High capex for warehouse automation & tech
- 4.3.3 Warehouse-labour scarcity & wage inflation
- 4.3.4 Cyber-security exposure from multi-tenant platforms
- 4.4 Value / Supply-Chain Analysis
- 4.5 Technology Snapshot (IoT, AI, etc.)
- 4.6 Key Government Regulations and Initiatives
- 4.7 Insights into E-commerce Business
- 4.8 Warehousing Market Trends
- 4.9 Demand Trend Analysis (CEP, Last-Mile, Cold-Chain etc.)
- 4.10 Porter's Five Forces
- 4.10.1 Threat of New Entrants
- 4.10.2 Bargaining Power of Buyers
- 4.10.3 Bargaining Power of Suppliers
- 4.10.4 Threat of Substitutes
- 4.10.5 Intensity of Competitive Rivalry
- 4.11 Impact of Geopolitical Events on the Market
5 Market Size & Growth Forecasts (Value)
- 5.1 By Service
- 5.1.1 Domestic Transportation Management (DTM)
- 5.1.1.1 Roadways
- 5.1.1.2 Railways
- 5.1.1.3 Airways
- 5.1.1.4 Waterways
- 5.1.2 International Transportation Management (ITM)
- 5.1.2.1 Roadways
- 5.1.2.2 Railways
- 5.1.2.3 Airways
- 5.1.2.4 Waterways
- 5.1.3 Value-Added Warehousing and Distribution (VAWD)
- 5.1.1 Domestic Transportation Management (DTM)
- 5.2 By End User
- 5.2.1 Automotive
- 5.2.2 Energy and Utilities
- 5.2.3 Manufacturing
- 5.2.4 Life Sciences and Healthcare
- 5.2.5 Technology and Electronics
- 5.2.6 Retail and E-commerce
- 5.2.7 Consumer Goods and FMCG
- 5.2.8 Food and Beverages
- 5.2.9 Others
- 5.3 By Logistics Model
- 5.3.1 Asset-Light (Management-Based)
- 5.3.2 Asset-Heavy (Own Fleet and Warehouses)
- 5.3.3 Hybrid
- 5.4 By Region
- 5.4.1 North America
- 5.4.1.1 United States
- 5.4.1.2 Canada
- 5.4.1.3 Mexico
- 5.4.2 South America
- 5.4.2.1 Brazil
- 5.4.2.2 Argentina
- 5.4.2.3 Chile
- 5.4.2.4 Rest of South America
- 5.4.3 Europe
- 5.4.3.1 Germany
- 5.4.3.2 United Kingdom
- 5.4.3.3 France
- 5.4.3.4 Spain
- 5.4.3.5 Italy
- 5.4.3.6 Netherlands
- 5.4.3.7 Russia
- 5.4.3.8 Rest of Europe
- 5.4.4 Asia-Pacific
- 5.4.4.1 China
- 5.4.4.2 India
- 5.4.4.3 Japan
- 5.4.4.4 South Korea
- 5.4.4.5 Singapore
- 5.4.4.6 Vietnam
- 5.4.4.7 Indonesia
- 5.4.4.8 Australia
- 5.4.4.9 Rest of Asia-Pacific
- 5.4.5 Middle East and Africa
- 5.4.5.1 United Arab Emirates
- 5.4.5.2 Saudi Arabia
- 5.4.5.3 South Africa
- 5.4.5.4 Nigeria
- 5.4.5.5 Rest of Middle East and Africa
- 5.4.1 North America
6 Competitive Landscape
- 6.1 Strategic Moves
- 6.2 Market Share Analysis
- 6.3 Company Profiles (includes Global level Overview, Market level overview, Core Segments, Financials as available, Strategic Information, Market Rank/Share for key companies, Products and Services, and Recent Developments)
- 6.3.1 DHL Supply Chain and Global Forwarding
- 6.3.2 Kuehne + Nagel International AG
- 6.3.3 GXO Logistics
- 6.3.4 C.H. Robinson Worldwide Inc.
- 6.3.5 DSV A/S
- 6.3.6 Nippon Express Holdings
- 6.3.7 Sinotrans Ltd.
- 6.3.8 CEVA Logistics (CMA CGM)
- 6.3.9 XPO Inc.
- 6.3.10 FedEx Logistics
- 6.3.11 UPS Supply Chain Solutions
- 6.3.12 GEODIS
- 6.3.13 Kerry Logistics Network
- 6.3.14 Yusen Logistics (NYK)
- 6.3.15 Hitachi Transport System (LOGISTEED)
- 6.3.16 J.B. Hunt Transport Services Inc.
- 6.3.17 CJ Logistics
- 6.3.18 Samsung SDS
- 6.3.19 Americold Logistics LLC
- 6.3.20 Penske Logistics
- 6.3.21 Expeditors
7 Market Opportunities and Future Outlook
- 7.1 White-space and Unmet-Need Assessment
- 7.2 Emergence of 4PL and Digital Freight Marketplaces
- 7.3 Sustainability and Green Logistics Initiatives
- 7.4 Automation and Robotics in Warehouses
- 7.5 Near-shoring and Regionalisation Impact on Contract Structures


