|
시장보고서
상품코드
2113188
인도네시아의 석유 및 가스 업스트림 : 시장 점유율 분석, 업계 동향 및 통계, 성장 예측(2026-2031년)Indonesia Oil And Gas Upstream - Market Share Analysis, Industry Trends & Statistics, Growth Forecasts (2026 - 2031) |
||||||
 Mordor Intelligence
Mordor Intelligence에 의하면, 인도네시아의 석유 및 가스 업스트림 시장 규모는 2025년 101억 5,000만 달러로 평가되었습니다. 2026년에는 107억 2,000만 달러로 확대되어 2026년부터 2031년에 걸쳐 CAGR 5.63%로 성장을 지속하여, 2031년에는 140억 9,000만 달러에 이를 것으로 예측됩니다.
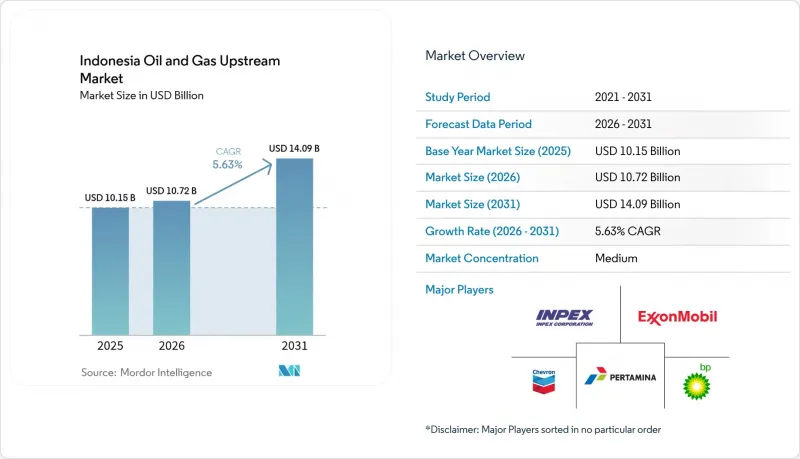
본 보고서는 개발 지역(온쇼어·오프쇼어), 자원 유형(원유·가스), 유정 유형(전통형·비전통형), 서비스(탐사, 개발·생산, 폐광 조치)별로 분류되어 있습니다. 시장 규모 및 전망은 금액(달러)으로 표시되어 있습니다.
인도네시아의 석유 및 가스 업스트림 시장 동향 및 인사이트
세제 및 라이선싱 제도 개혁이 투자 유입을 가속화
정부 규정 제35/2004호의 개정에 따라, 비전통형 프로젝트에서 계약자에게 최대 95%의 수익 분배를 허용하는 선택 가능한 총수익 분배 제도가 도입되었습니다. 이를 통해 순현재가치가 향상되고 투자 회수 기간이 단축됩니다. 사업자들은 현재 프로젝트의 위험도에 따라 원가 회수형과 총수익 배분형 체계를 전환하고 있으며, 이러한 선택권은 이미 에니(Eni), 하버 에너지(Harbour Energy), 엑슨모빌(ExxonMobil), BP의 공동 조사를 유도하고 있습니다. 이번 규제 개정은 재정적 경직성에 대한 투자자들의 기존 우려에 직접 대응하는 것이며, 프론티어 지역, 특히 위험 가중 경제성으로 인해 계약업체의 수익 분배 비율을 높이는 것이 유리해지는 심해 광구에서의 라이선스 취득을 촉진하고 있습니다. 동시에, MEMR(에너지·광물자원부) 규정 제13/2024호에 따른 허가 절차의 합리화를 통해 라이선스 승인 기간이 24개월에서 12개월로 단축되어 탐사 주기를 단축할 수 있게 되었습니다.
심해 가스 발견으로 자원 포트폴리오 재편
남안다만해의 라야란-1호 유정 발견을 통해 6 TCF의 자원량과 30 MMSCFD의 시험 유량이 확인되었습니다. 한편, 틴팡-1호 유정은 5-6 TCF의 자원량과 27 MMSCFD의 생산 잠재력을 지니고 있습니다. 에니(Eni)사의 5 TCF 규모의 노스 가날(North Ganal) 발견과 맞물려, 인도네시아의 확인 매장량은 평가 조사 결과에 따라 달라지겠지만 약 30% 증가했습니다. SKK Migas는 2028년부터 2030년 사이에 첫 가스 선적을 예정하고 있으며, 이를 위해서는 해저 파이프라인과 부유식 LNG 저장 시설이 필요하며, 이들이 새로운 수출 회랑의 기반이 될 것입니다. 2024년에 FEED를 완료한 INPEX의 ‘아바디 LNG’는 연간 9.5 MTPA의 생산과 200억 달러의 설비 투자를 목표로 하고 있으며, 이는 지역 LNG 공급에서 인도네시아의 석유 및 가스 업스트림 시장의 리더십을 강화할 것입니다.
노후화된 육상 성숙 유전이 생산 확대의 걸림돌로
인도네시아의 4만 4,985개 석유 유정 중 약 70%는 성숙 단계에 접어들었으며, 연간 21%의 비율로 생산량이 감소하고 있어, 1만 6,990곳의 휴지 유정에 대해 개보수 또는 영구 폐쇄(P&A) 결정이 필요합니다. 중부 수마트라의 두리 란타우 바이스 유전에서는 API 비중이 25° 미만인 중질이 주를 이루기 때문에 열적·화학적 증산(EOR) 비용이 증가하고 있습니다. 4,500개의 유정을 대상으로 한 재가동 프로그램이 계획되어 있지만, 추가적인 재정적 인센티브가 없다면 경제적 장벽에 직면하게 될 것입니다. 그 결과, 기초 생산량 유지를 위해 자본 지출이 배정되게 되어 인도네시아의 석유 및 가스 업스트림 시장의 성장 곡선이 둔화될 것입니다.
부문별 분석
2025년 매출 중 해양 자산이 56.20%를 차지했으며, 연평균 성장률(CAGR) 5.88%로 확대될 것으로 예측됩니다. 이에 따라 2031년까지 인도네시아 석유 및 가스 업스트림 시장의 해양 자산 시장 규모는 80억 1,000만 달러에 달할 것으로 전망됩니다. 안다만-마세라에 위치한 대규모 가스 클러스터가 장기적인 현금 흐름을 뒷받침하는 한편, 마하캄 주변의 브라운필드 해저 타이백은 생산량의 안정성을 유지하고 있습니다. 각 운영사들은 잭업 리그의 재투입으로 인해 인가부터 첫 가스 생산까지의 기간이 단축될 것이라고 지적하고 있으며, 유연한 재정 조건 덕분에 원유 가격이 배럴당 65달러 미만인 시나리오에서도 프로젝트의 내부수익률(IRR)이 두 자릿수로 개선될 것으로 전망됩니다.
육상 생산은 성숙한 저류층에 제약을 받지만, 낮은 개발 비용과 인프라와의 근접성에 힘입어 지탱되고 있습니다. 로칸에서 AI를 활용한 개조 작업을 통해 2025년 6월에는 하루 15만 2,161배럴의 생산량을 달성하여, 디지털 최적화가 생산성 격차를 줄이는 데 도움이 됨을 입증했습니다. 그러나 중질 원유의 점도와 수분 함량 문제로 인해 채굴 비용은 해상 생산의 배럴당 16달러에 비해 22달러로 증가했습니다. 정부가 4,500개의 유휴 유정을 재가동하는 것을 목표로 함에 따라 생산량 감소 속도는 둔화될 전망이지만, 인도네시아의 석유 및 가스 업스트림 시장의 주요 성장 동력은 여전히 해양 분야입니다.
2025년 시점에서 원유는 52.35%의 점유율을 차지하여 인도네시아의 석유 및 가스 업스트림 시장 규모 중 53억 1,000만 미달러에 해당했지만, 성숙한 유전이 주류를 이루고 있어 연평균 성장률(CAGR)은 3.95%로 완만한 확대에 그칠 전망입니다. 대조적으로, 가스는 라야란, 틴팡, 아바디 각 프로젝트의 가동 개시 예정에 힘입어 연평균 성장률(CAGR) 6.05%를 기록하며, 2031년까지 46.40%의 점유율에 도달할 것으로 예측됩니다. 가격 연동형 LNG 계약은 아시아 현물 가격이 16달러/MMBtu를 상회하는 추세를 보일 경우, 프로젝트의 순수익을 향상시켜 에너지 전환을 둘러싼 논의가 계속되는 가운데서도 설비 투자를 유치하고 있습니다.
나투나 D-알파에서 CO2 농도 상승으로 인해 입찰이 무산된 것은 거대 가스전 개발에 CCS가 필수적임을 여실히 보여주고 있습니다. 한편, 국내 가스화 프로그램으로 인해 비료 및 발전소 수요가 가속화되면서 판매처 확보가 추진되고 있습니다. 종합적으로 볼 때, 천연가스의 성장은 인도네시아의 석유 및 가스 업스트림 시장의 수익 구성을 대폭 재편하고 있습니다.
기타 혜택 :
- 엑셀 형식 시장 예측(ME) 시트
- 3개월간의 애널리스트 지원
자주 묻는 질문
목차
제1장 서론
제2장 조사 방법
제3장 개요
제4장 시장 구도
제5장 시장 규모 및 성장 예측
제6장 경쟁 구도
제7장 시장 기회 및 향후 전망
KTH 26.08.31According to Mordor Intelligence, the Indonesia oil and gas upstream market size is expected to grow from USD 10.15 billion in 2025 to USD 10.72 billion in 2026 and is forecast to reach USD 14.09 billion by 2031 at 5.63% CAGR over 2026-2031.
This report is Segmented by Location of Deployment (Onshore and Offshore), Resource Type (Crude Oil and Natural Gas), Well Type (Conventional and Unconventional), and Service (Exploration, Development and Production, and Decommissioning). The Market Sizes and Forecasts are Provided in Terms of Value (USD).
Indonesia Oil And Gas Upstream Market Trends and Insights
Fiscal & Licensing Reform Accelerates Investment Flows
Revisions to Government Regulation 35/2004 introduce a selectable gross-split regime that awards contractors up to a 95% revenue share for unconventional projects, thereby improving the net present value and shortening the payback period. Operators now switch between cost-recovery and gross-split frameworks to match project risk, an option that has already attracted joint studies from Eni, Harbour Energy, ExxonMobil, and BP. The regulatory update directly addresses earlier investor concerns about fiscal rigidity and stimulates license uptake in frontier acreage, particularly in deep-water tracts where risk-weighted economics favor higher contractor shares. Concurrently, streamlined permitting under MEMR Regulation 13/2024 reduces license approval time from 24 months to 12 months, enabling faster exploration cycles.
Deep-Water Gas Discoveries Reshape Resource Portfolio
The Layaran-1 find in South Andaman validated a 6 TCF resource base and 30 MMSCFD test flow, while the Timpan-1 well holds 5-6 TCF and 27 MMSCFD output potential. Alongside Eni's 5 TCF North Ganal discovery, Indonesia's proven reserves increased by roughly 30%, contingent upon appraisal. SKK Migas schedules the first gas between 2028 and 2030, necessitating subsea pipelines and floating LNG storage that anchor a new export corridor. INPEX's Abadi LNG, which completed FEED in 2024, targets 9.5 MTPA and USD 20 billion capex, reinforcing Indonesia's oil & gas upstream market leadership in regional LNG supply.
Aging Onshore Mature Fields Constrain Production Growth
Roughly 70% of Indonesia's 44,985 oil wells are mature, declining at a rate of 21% annually, and leaving 16,990 idle sites that require workovers or permanent abandonment (P&A) decisions. The heavy oil dominance in Central Sumatra's Duri and Rantau Bais fields, with API gravities below 25°, increases thermal and chemical EOR costs. Reactivation programs target 4,500 wells but face economic hurdles without further fiscal sweeteners. Consequently, sustaining base output diverts capital expenditures from exploration, moderating the growth curve of the Indonesian oil & gas upstream market.
Other drivers and restraints analyzed in the detailed report include:
- AI-Led Subsurface Imaging Transforms Operational Efficiency
- CCS-EOR Hubs Enable Tertiary Recovery Potential
- ESG-Driven Capital Scarcity Pressures Project Financing
For complete list of drivers and restraints, kindly check the Table Of Contents.
Segment Analysis
Offshore assets accounted for 56.20% of 2025 revenue and are expected to advance at a 5.88% CAGR, increasing the Indonesian oil & gas upstream market size for offshore assets to USD 8.01 billion by 2031. Massive gas clusters in Andaman and Masela underpin long-cycle cash flows, while brownfield subsea tie-backs around Mahakam preserve volume stability. Operators cite shorter sanction-to-first-gas timelines for jack-up re-entries, and flexible fiscal terms improve project IRR to double-digits under USD 65/bbl scenarios.
Onshore output trails, constrained by mature reservoirs but buffered by lower development costs and proximity to infrastructure. AI-aided workovers at Rokan achieved 152,161 bpd in June 2025, demonstrating that digital optimization can help narrow productivity gaps. Still, heavy crude viscosity and water-cut issues inflate lifting cost to USD 22/bbl versus offshore's USD 16/bbl. The government's aim to revive 4,500 idle wells should slow the decline; yet, offshore remains the main growth engine for the Indonesian oil & gas upstream market.
Crude oil held a 52.35% share in 2025, translating to USD 5.31 billion of the Indonesian oil & gas upstream market size, but expands modestly at a 3.95% CAGR as mature fields dominate the slate. Gas, in contrast, is expected to reach a 46.40% share by 2031, driven by a 6.05% CAGR, backed by startup schedules from Layaran, Timpan, and Abadi. Price-indexed LNG contracts enhance project netbacks when Asian spot prices trend above USD 16/MMBtu, attracting capital expenditure even amid debates about the energy transition.
Elevated CO2 in Natuna D-Alpha kept bids away, underscoring the need for CCS to unlock mega-gas. Meanwhile, domestic gasification programs accelerate demand from fertilizers and power plants, ensuring offtake security. Collectively, the growth of natural gas materially reshapes the revenue mix within the Indonesian oil & gas upstream market.
Complete Report Scope:
- By Location of Deployment
- Onshore
- Offshore
- By Resource Type
- Crude Oil
- Natural Gas
- By Well Type
- Conventional
- Unconventional
- By Service
- Exploration
- Development and Production
- Decomissioning
List of Companies Covered in this Report:
- PT Pertamina (Persero)
- Chevron Corp.
- ExxonMobil Corp.
- BP plc
- TotalEnergies SE
- INPEX Corp.
- Eni SpA
- CNOOC Ltd.
- Petroliam Nasional Berhad (Petronas)
- Medco Energi Internasional Tbk
- Energi Mega Persada Tbk
- Harbour Energy (Premier Oil)
- ConocoPhillips Indonesia Inc.
- Mubadala Energy
- Santos Ltd.
- Repsol SA
- Saka Energi Indonesia
- Black Platinum Energy Ltd.
- Indrillco Group
- KUFPEC Indonesia
Additional Benefits:
- The market estimate (ME) sheet in Excel format
- 3 months of analyst support
TABLE OF CONTENTS
1 Introduction
- 1.1 Study Assumptions & Market Definition
- 1.2 Scope of the Study
2 Research Methodology
3 Executive Summary
4 Market Landscape
- 4.1 Market Overview
- 4.2 Market Drivers
- 4.2.1 Fiscal & licensing reform (GR 35/2004 revisions)
- 4.2.2 Deep-water gas discoveries (Abadi, Andaman)
- 4.2.3 LNG export price-linkage upside
- 4.2.4 Production-sharing contract (PSC) extensions
- 4.2.5 CCS-EOR hubs enabling tertiary recovery
- 4.2.6 AI-led subsurface imaging accuracy
- 4.3 Market Restraints
- 4.3.1 Aging onshore mature fields
- 4.3.2 Regulatory & contract uncertainty
- 4.3.3 Deep-water talent gap
- 4.3.4 ESG-driven capital scarcity
- 4.4 Supply-Chain Analysis
- 4.5 Technological Outlook
- 4.6 Regulatory Landscape
- 4.7 Crude-Oil Production & Consumption Outlook
- 4.8 Natural-Gas Production & Consumption Outlook
- 4.9 Unconventional Resources CAPEX Outlook (tight oil, oil sands, deep-water)
- 4.10 Porter's Five Forces
- 4.10.1 Threat of New Entrants
- 4.10.2 Bargaining Power of Suppliers
- 4.10.3 Bargaining Power of Buyers
- 4.10.4 Threat of Substitutes
- 4.10.5 Competitive Rivalry
- 4.11 PESTLE Analysis
5 Market Size & Growth Forecasts
- 5.1 By Location of Deployment
- 5.1.1 Onshore
- 5.1.2 Offshore
- 5.2 By Resource Type
- 5.2.1 Crude Oil
- 5.2.2 Natural Gas
- 5.3 By Well Type
- 5.3.1 Conventional
- 5.3.2 Unconventional
- 5.4 By Service
- 5.4.1 Exploration
- 5.4.2 Development and Production
- 5.4.3 Decomissioning
6 Competitive Landscape
- 6.1 Market Concentration
- 6.2 Strategic Moves (M&A, Partnerships, PPAs)
- 6.3 Market Share Analysis (Market Rank/Share for key companies)
- 6.4 Company Profiles (includes Global level Overview, Market level overview, Core Segments, Financials as available, Strategic Information, Products & Services, and Recent Developments)
- 6.4.1 PT Pertamina (Persero)
- 6.4.2 Chevron Corp.
- 6.4.3 ExxonMobil Corp.
- 6.4.4 BP plc
- 6.4.5 TotalEnergies SE
- 6.4.6 INPEX Corp.
- 6.4.7 Eni SpA
- 6.4.8 CNOOC Ltd.
- 6.4.9 Petroliam Nasional Berhad (Petronas)
- 6.4.10 Medco Energi Internasional Tbk
- 6.4.11 Energi Mega Persada Tbk
- 6.4.12 Harbour Energy (Premier Oil)
- 6.4.13 ConocoPhillips Indonesia Inc.
- 6.4.14 Mubadala Energy
- 6.4.15 Santos Ltd.
- 6.4.16 Repsol SA
- 6.4.17 Saka Energi Indonesia
- 6.4.18 Black Platinum Energy Ltd.
- 6.4.19 Indrillco Group
- 6.4.20 KUFPEC Indonesia
7 Market Opportunities & Future Outlook
- 7.1 White-space & Unmet-Need Assessment