|
시장보고서
상품코드
2113193
인도네시아의 석유 및 가스 다운스트림 시장 : 시장 점유율 분석, 업계 동향과 통계, 성장 예측(2026-2031년)Indonesia Oil And Gas Downstream - Market Share Analysis, Industry Trends & Statistics, Growth Forecasts (2026 - 2031) |
||||||
 Mordor Intelligence
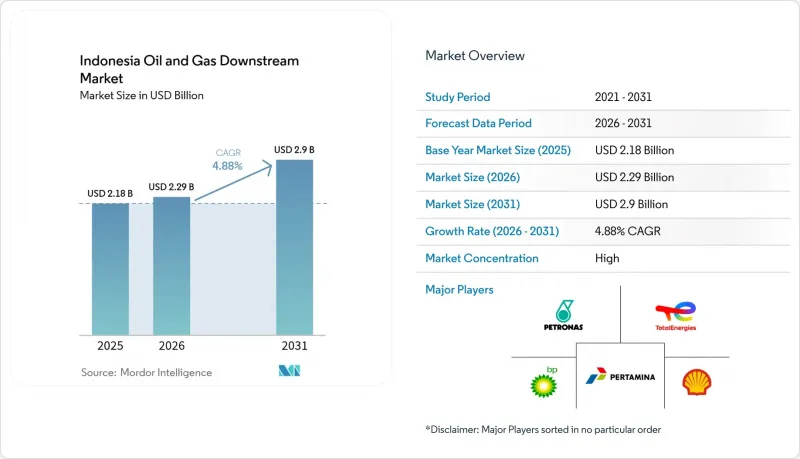
Mordor Intelligence에 의하면, 2026년 인도네시아의 석유 및 가스 다운스트림 시장 규모는 22억 9,000만 달러로 추정되며, 2025년 21억 8,000만 달러에서 확대되어 2031년에는 29억 달러에 달할 것으로 예측됩니다.
2026년부터 2031년에 걸쳐 연평균 성장률(CAGR) 4.88%로 성장할 것으로 전망됩니다.
본 보고서는 유형별(정유시설 및 석유화학 플랜트), 제품 유형별(정제 석유 제품, 석유화학제품, 윤활유), 유통 채널별(직접 판매/도매, 유통업체/상업, 소매)로 분류되어 있습니다. 시장 규모 및 전망은 금액(미 달러)으로 표시되어 있습니다.
인도네시아의 석유 및 가스 다운스트림 시장 동향 및 인사이트
국내 정제 능력 확대를 위한 정부의 이니셔티브
인도네시아는 16개 거점에서 계획했던 증설량을 하루 50만 배럴에서 100만 배럴로 두 배로 늘려, 물류 비용을 절감하고 에너지 안보를 강화하는 지역 허브를 구축하고 있습니다. 현재 91%의 완공률을 보이고 있는 발릭파판의 개보수 공사는 유로 4 규격의 연료 기준을 준수하기 위해 필요한 첨단 기술력과 막대한 설비 투자를 여실히 보여주고 있습니다. 또한, 이러한 분산형 생산 능력 구축은 원자재 수출에서 정제 연료로의 부가가치 전환을 도모하는 산업 정책과도 부합합니다. 성공의 열쇠는 원유의 안정적인 공급 확보와 첨단 수소화 처리 장비를 운용할 수 있는 인재 양성에 달려 있습니다. 이 프로그램을 통해 인도네시아는 수입 의존도를 낮추는 동시에, 미래 석유화학 산업의 통합을 지원할 체제를 갖추게 될 것입니다.
운송·산업 분야의 국내 연료 수요 증가
GDP 성장과 도시화로 인해 자동차 보유 대수, 항공 교통량, 공장 생산량이 가속화되고 있으며, 이로 인해 현지 공급 능력이 한계에 달하고, 수입 대금이 증가하고 있습니다. 새로운 유료 도로 및 산업 단지 등의 인프라 확충은 지역 내 연료 수요를 더욱 심화시키고 있습니다. 항공 노선의 확대는 제트 연료 수요를 증가시키고 있으며, 이에 대응하기 위해서는 더욱 고성능의 정제 설비가 필요합니다. 수요가 지속되고 있어 원유 가격 변동에도 불구하고 투자자들의 신뢰는 유지되고 있지만, 한편으로는 외부에서 발생하는 원유 가격 충격에 대한 취약성도 커지고 있습니다.
화석 연료 자산에 대한 환경 및 탈탄소화 압력
인도네시아의 ‘2060년 넷제로’ 공약에 따라 배출 규제가 엄격해지고 탄소 가격 책정 제도가 도입될 가능성이 있어, 이로 인해 운영 비용이 상승할 전망입니다. 전 세계 금융기관들은 ESG 기준을 적용하고 있으며, 탄소 포집 모듈이 통합되지 않은 한 기존 방식의 플랜트에 대한 대출을 제한하고 있습니다. 허가 취득 기간의 장기화나 시민 사회의 감시로 인해 신규 건설이 저해될 가능성이 있으며, 더 깨끗한 대체 에너지가 확대됨에 따라 좌초 자산이 될 우려가 커지고 있습니다. 사업자는 단기적인 수요와 장기적인 기후 변화 관련 부채를 신중하게 비교 검토해야 합니다.
부문별 분석
정유시설는 여전히 핵심을 차지하고 있으며, 2025년에는 인도네시아의 석유 및 가스 다운스트림 시장에서 63.32%의 점유율을 기록했습니다. 이는 국내 처리량을 두 배로 늘리려는 정부의 프로그램에 힘입은 결과입니다. 발릭파판 및 투반의 가동 개시에 따라, 정유시설가 주도하는 인도네시아의 석유 및 가스 다운스트림 시장 규모는 2031년까지 꾸준히 확대될 것으로 전망됩니다. 그러나 환경 규정 준수 비용의 상승과 지역 내 경쟁 심화로 인해 이익률은 압박을 받고 있습니다. 세계적 규모의 복합 단지에 기반을 둔 석유화학 플랜트는 고수익 화학제품으로의 가치 전환을 반영하여 연평균 성장률(CAGR) 6.55%를 나타낼 것으로 전망됩니다. 국제적인 대기업들은 첨단 공정 기술과 자본을 공급하는 반면, 국내 기업들은 규제 관련 전문 지식과 현지 물류 역량을 제공합니다.
이러한 통합 추세로 인해 정유시설와 화학 사업의 경계가 모호해지면서, 원료의 공동 최적화와 범위 경제성이 가능해졌습니다. 통합된 부지에서는 크래커 설비를 위한 나프타 공급원을 확보하여 전반적인 가동률을 높이고 있습니다. 고도의 기술을 갖춘 엔지니어들이 해외로 유출되는 경향이 있어 인재 확보 문제는 여전히 남아 있으며, 공동 교육 프로그램 개발이 진행되고 있습니다. 정부의 감독을 통해 안전성과 환경 성과는 확보되고 있으나, 규제 집행의 일관성은 주마다 차이가 있습니다.
기타 혜택:
- 엑셀 형식 시장 예측(ME) 시트
- 3개월간의 애널리스트 지원
자주 묻는 질문
목차
제1장 서론
제2장 조사 방법
제3장 주요 요약
제4장 시장 구도
제5장 시장 규모와 성장 예측
제6장 경쟁 구도
제7장 시장 기회와 향후 전망
LSH 26.08.24According to Mordor Intelligence, Indonesia oil and gas downstream market size in 2026 is estimated at USD 2.29 billion, growing from 2025 value of USD 2.18 billion with 2031 projections showing USD 2.9 billion, growing at 4.88% CAGR over 2026-2031.
This report is Segmented by Type (Refineries and Petrochemical Plants), Product Type (Refined Petroleum Products, Petrochemicals, and Lubricants), and Distribution Channel (Direct Sales/Wholesale, Distributors/Commercial, and Retail). The Market Sizes and Forecasts are Provided in Terms of Value (USD).
Indonesia Oil And Gas Downstream Market Trends and Insights
Government Push to Expand Domestic Refining Capacity
Indonesia doubled its planned additions from 500,000 to 1 million barrels per day across 16 sites, creating regional hubs that cut logistics costs and lift energy security. Balikpapan's upgrade, now 91% complete, illustrates the technical depth and capital outlay required for Euro-4 fuel compliance. Distributed capacity also aligns with the industrial policy that shifts value from raw exports to processed fuels. Success hinges on securing crude supplies and training personnel capable of operating advanced hydrotreaters. The program positions Indonesia to reduce import dependence while supporting future petrochemical integration.
Rising Domestic Fuel Demand from Transport & Industry
GDP growth and urbanization accelerate vehicle ownership, aviation traffic, and factory output, stretching local supply and raising import bills. Infrastructure, such as new toll roads and industrial estates, deepens regional fuel demand. Aviation route expansion increases jet-fuel needs, which require higher-spec refiners. Sustained demand gives investors confidence despite crude price swings, yet it magnifies exposure to external oil-price shocks.
Environmental and Decarbonization Pressures on Fossil Assets
Indonesia's Net Zero 2060 pledge attracts stricter emission rules and potential carbon pricing that inflate operating costs. Global lenders deploy ESG filters, limiting finance for traditional plants unless carbon-capture modules are integrated. Extended permitting and civil-society scrutiny can hold back new builds, raising the specter of stranded assets as cleaner energy alternatives scale up. Operators must weigh near-term demand against long-run climate liabilities.
Other drivers and restraints analyzed in the detailed report include:
- Surge in Investments for World-Scale Petrochemical Complexes
- Implementation of B35-to-B40 Biodiesel Mandate
- Chronic Delays and Cost Overruns in Refinery Megaprojects
For complete list of drivers and restraints, kindly check the Table Of Contents.
Segment Analysis
Refineries remained the backbone, with a 63.32% share of Indonesia's oil and gas downstream market in 2025, underpinned by government programs aimed at doubling national throughput. The Indonesian oil and gas downstream market size attributed to refineries is forecast to expand steadily through 2031 as Balikpapan and Tuban come online. Margins, however, face pressure from higher environmental compliance costs and tighter regional competition. Petrochemical plants, aided by world-scale complexes, are projected to record a 6.55% CAGR, reflecting shifting value toward higher-margin chemicals. International majors supply advanced process technology and capital, while domestic firms provide regulatory insight and local logistics.
The integration trend blurs the boundaries between refinery and chemical operations, allowing for shared feedstock optimization and an economy of scope. Combined sites capture naphtha streams for cracker units, improving overall utilization. Workforce challenges persist, as high-skill engineers often migrate abroad, prompting the development of joint training programs. Government oversight ensures safety and environmental performance, though enforcement consistency varies across provinces.
Complete Report Scope:
- By Type
- Refineries
- Petrochemical Plants
- By Product Type
- Refined Petroleum Products
- Petrochemicals
- Lubricants
- By Distribution Channel
- Direct Sales/Wholesale
- Distributors/Commercial
- Retail
List of Companies Covered in this Report:
- PT Pertamina (Persero)
- PT Kilang Pertamina Internasional
- PT Perusahaan Gas Negara Tbk
- PT Chandra Asri Petrochemical Tbk
- TotalEnergies SE
- Shell plc
- Chevron Corporation
- Exxon Mobil Corporation
- BP plc
- Eni S.p.A.
- PETRONAS
- Sinopec (China Petroleum & Chemical Corp.)
- China National Petroleum Corp.
- PT Trans-Pacific Petrochemical Indotama
- Lotte Chemical Titan
- PT Pupuk Kalimantan Timur
- ConocoPhillips
- PT Medco Energi Internasional Tbk
- Korea National Oil Corp.
- PT Badak NGL
Additional Benefits:
- The market estimate (ME) sheet in Excel format
- 3 months of analyst support
TABLE OF CONTENTS
1 Introduction
- 1.1 Study Assumptions & Market Definition
- 1.2 Scope of the Study
2 Research Methodology
3 Executive Summary
4 Market Landscape
- 4.1 Market Overview
- 4.2 Market Drivers
- 4.2.1 Government push to expand domestic refining capacity
- 4.2.2 Rising domestic fuel demand from transport & industry
- 4.2.3 Surge in investments for world-scale petrochemical complexes
- 4.2.4 Implementation of B35 biodiesel blending mandate
- 4.2.5 Mandatory Euro-4 sulfur limits driving refinery upgrades
- 4.2.6 Airport network expansion spurring jet-fuel value-chain projects
- 4.3 Market Restraints
- 4.3.1 Environmental & decarbonization pressures on fossil assets
- 4.3.2 Chronic delays & cost overruns in refinery megaprojects
- 4.3.3 Shortage of advanced downstream technical workforce
- 4.3.4 Margin squeeze from Singapore/Malaysia hub competition
- 4.4 Supply-Chain Analysis
- 4.5 Regulatory Landscape
- 4.6 Technological Outlook
- 4.7 Refining Capacity Analysis
- 4.8 Porter's Five Forces
- 4.8.1 Threat of New Entrants
- 4.8.2 Bargaining Power of Suppliers
- 4.8.3 Bargaining Power of Buyers
- 4.8.4 Threat of Substitutes
- 4.8.5 Competitive Rivalry
- 4.9 PESTLE Analysis
5 Market Size & Growth Forecasts
- 5.1 By Type
- 5.1.1 Refineries
- 5.1.2 Petrochemical Plants
- 5.2 By Product Type
- 5.2.1 Refined Petroleum Products
- 5.2.2 Petrochemicals
- 5.2.3 Lubricants
- 5.3 By Distribution Channel
- 5.3.1 Direct Sales/Wholesale
- 5.3.2 Distributors/Commercial
- 5.3.3 Retail
6 Competitive Landscape
- 6.1 Market Concentration
- 6.2 Strategic Moves (M&A, Partnerships, PPAs)
- 6.3 Market Share Analysis (Market Rank/Share for key companies)
- 6.4 Company Profiles (includes Global level Overview, Market level overview, Core Segments, Financials as available, Strategic Information, Products & Services, and Recent Developments)
- 6.4.1 PT Pertamina (Persero)
- 6.4.2 PT Kilang Pertamina Internasional
- 6.4.3 PT Perusahaan Gas Negara Tbk
- 6.4.4 PT Chandra Asri Petrochemical Tbk
- 6.4.5 TotalEnergies SE
- 6.4.6 Shell plc
- 6.4.7 Chevron Corporation
- 6.4.8 Exxon Mobil Corporation
- 6.4.9 BP plc
- 6.4.10 Eni S.p.A.
- 6.4.11 PETRONAS
- 6.4.12 Sinopec (China Petroleum & Chemical Corp.)
- 6.4.13 China National Petroleum Corp.
- 6.4.14 PT Trans-Pacific Petrochemical Indotama
- 6.4.15 Lotte Chemical Titan
- 6.4.16 PT Pupuk Kalimantan Timur
- 6.4.17 ConocoPhillips
- 6.4.18 PT Medco Energi Internasional Tbk
- 6.4.19 Korea National Oil Corp.
- 6.4.20 PT Badak NGL
7 Market Opportunities & Future Outlook
- 7.1 White-space & Unmet-need Assessment