|
시장보고서
상품코드
2121521
미국의 석유 및 가스 다운스트림 공정 : 시장 점유율 분석, 산업 동향 및 통계 데이터, 성장 예측(2026-2031년)United States Oil And Gas Downstream - Market Share Analysis, Industry Trends & Statistics, Growth Forecasts (2026 - 2031) |
||||||
 Mordor Intelligence
Mordor Intelligence에 의하면, 2026년 미국의 석유 및 가스 다운스트림 공정 시장 규모는 226억 2,000만 달러로 추정되고 있으며, 2025년 217억 6,000만 달러에서 2031년 예측은 274억 6,000만 달러에 이르고, 2026-2031년 CAGR 3.95%를 기록할 전망입니다.
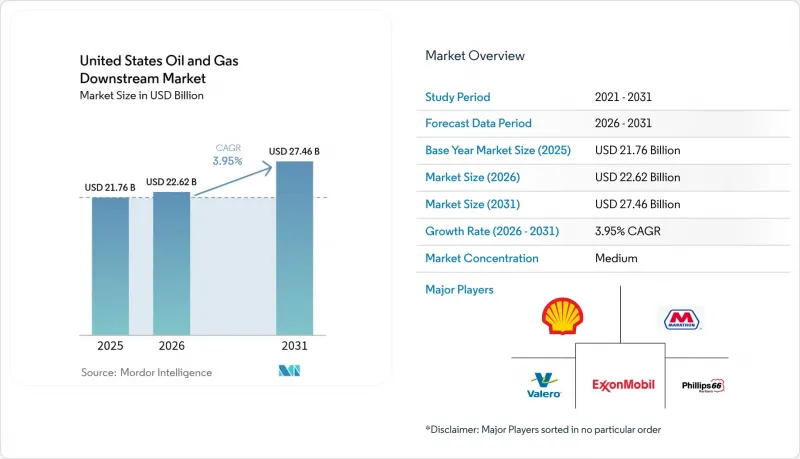
본 보고서는 유형별(정유시설, 석유화학 플랜트), 제품 유형별(석유 정제 제품, 석유화학제품, 윤활유), 유통 채널별(직접 판매/도매, 유통업체/상업, 소매)로 분류되어 있습니다. 시장 규모 및 전망은 금액(달러)으로 표시되어 있습니다.
미국 석유 및 가스 다운스트림 시장 동향 및 인사이트
VMT의 지속적인 증가에 따른 휘발유 수요 증가
2023년 VMT(연간 주행 마일 수)는 3조 2,600억 마일에 달하여 전년 대비 2.1% 증가했습니다. 이러한 추세는 전기차(EV) 보급이 가속화되고 있는 상황에서도 운송용 연료 수요의 기반을 지탱하고 있습니다. 전자상거래 주문 처리 및 라스트 마일 물류로 인해 디젤 및 휘발유 소비량이 증가하고 있으며, 그 속도는 승용차 판매 대수 증가세 둔화를 상쇄할 정도입니다. 선벨트 지역 각 주는 인구 유입과 건설 활동에 힘입어 연간 VMT 성장률이 3%를 상회하며 선두를 달리고 있습니다. 미국 교통부는 2027년까지 상용차의 주행 거리가 승용차의 2배 속도로 증가할 것으로 예측하고 있으며, 이로 인해 정유사에게는 휘발유, 디젤, 제트 연료 생산을 위한 안정적인 수요 기반이 제공될 것입니다. 이러한 예측 가능한 수요 동향은 생산 능력 계획에 대한 의사 결정을 용이하게 하며, 미국 석유 및 가스 다운스트림 시장의 연평균 성장률(CAGR) 4.00% 전망을 뒷받침하고 있습니다.
계획된 정유시설 현대화 및 생산 능력 증강
발표된 프로젝트 총액은 150억 달러 이상에 달하며, 미국 내 플랜트의 개보수가 진행되고 있는데, 그 중 멕시코만 연안 지역이 가장 큰 비중을 차지하고 있습니다. 엑슨모빌의 20억 달러 규모 보몬트 확장 프로젝트에서는 처리 능력이 하루 25만 배럴(b/d) 증가할 것이며, 한편,셰브론의 4억 7,500만 달러 규모의 패서디나 개보수 프로젝트에서는 처리 능력이 15% 향상되어, 해당 시설이 중질 원유 처리에 대응할 수 있게 됩니다. 마라톤 페트롤리엄의 25억 달러 규모 재생 가능 디젤 생산 설비 확충은 기존 연료 라인과 저탄소 연료 라인 모두에 대한 투자를 병행하는 이중 전략을 상징합니다. 새로운 수소화 분해 장치와 유동 접촉 분해 장치는 중간 증류분의 수율을 높이고, 에너지 효율을 최대 8% 향상시키며, 원유 조성의 변화에도 대응할 수 있는 미래 지향적인 플랜트를 실현합니다. 이러한 현대화 주기를 통해 미국의 석유 및 가스 다운스트림 공정 시장을 뒷받침하는 설비 기반이 확대되는 동시에, 평균 운영 비용 절감도 추진됩니다.
전기차(EV) 보급 가속화로 휘발유 수요 억제
2023년 전기차(EV) 판매 대수는 140만 대를 돌파하여, 미국 경차 신규 등록 대수 전체의 9.1%를 차지했습니다. 캘리포니아주가 25%의 점유율로 선두를 달리고 있으며, 워싱턴주와 오리건주도 합쳐 15% 이상을 차지하고 있어, 이들 지역에서는 휘발유 수요의 국지적인 감소가 나타나고 있습니다. ‘인프라 투자 및 고용법’에 따른 75억 달러 규모의 전국 충전 네트워크 구축으로 전기차 보급 일정이 앞당겨지고 있으며, 2032년까지 유효한 구매 크레딧이 소비자들의 관심을 높이고 있습니다. 인구 밀도가 높은 도시 지역에서는 차량 운영 업체들이 수명 주기 비용 절감을 위해 밴과 스텝 트럭을 전기화함으로써, 특정 노선에서의 디젤 수요를 줄이고 있습니다.
부문 분석
정유시설로 분류되는 시설은 2025년 미국 내 석유 및 가스 다운스트림 시장 매출의 56.75%를 창출했으나, 석유화학 시설은 2031년까지 연평균 성장률(CAGR) 4.12%로 확대될 것으로 예상되며, 이는 자산 유형 중 가장 빠른 성장 속도입니다. 엑슨모빌의 20억 달러 규모의 베이트타운 투자는 유틸리티를 공유하고, 원료 운송 비용을 절감하며, 고수익률의 화학제품 생산을 가능하게 하는 통합형 거점으로의 전략적 전환을 강조하는 것입니다.
통합형 복합 시설에서는 크랙 스프레드가 축소되었을 때 나프타, 부탄, 에탄을 에틸렌 및 프로파일렌 생산에 전환할 수 있어 현금 흐름의 안정화에 기여합니다. 과거 데이터에 따르면, 석유화학 플랜트는 2019년부터 2024년까지 연평균 2.8%의 성장이 예상되지만, 4.12%로 성장세가 가속화되는 것은 북미 천연가스 액체(NGL)의 우위와 아시아 수출 확대에 기인한 것으로 분석됩니다. 독립 정유사들은 유사한 설비 현대화를 추진할지, 아니면 연료만을 취급하는 비즈니스 모델로 수익성 저하를 감수할지 결정을 내려야 하는 상황에 직면해 있습니다. 이러한 변화는 다각화를 추진하고 있는 사업자의 장기적인 경쟁력을 강화하고, 미국의 석유 및 가스 다운스트림 공정 시장의 깊이를 더하는 결과로 이어질 것입니다.
기타 혜택:
- Excel 형식 시장 예측(ME) 시트
- 3개월간의 애널리스트 지원
자주 묻는 질문
목차
제1장 서론
제2장 분석 방법
제3장 주요 요약
제4장 시장 구도
제5장 시장 규모와 성장 예측
제6장 경쟁 구도
제7장 시장 기회와 향후 전망
LSH 26.09.02According to Mordor Intelligence, the United States oil and gas downstream market size in 2026 is estimated at USD 22.62 billion, growing from 2025 value of USD 21.76 billion with 2031 projections showing USD 27.46 billion, growing at 3.95% CAGR over 2026-2031.
This report is Segmented by Type (Refineries and Petrochemical Plants), Product Type (Refined Petroleum Products, Petrochemicals, and Lubricants), and Distribution Channel (Direct Sales/Wholesale, Distributors/Commercial, and Retail). The Market Sizes and Forecasts are Provided in Terms of Value (USD).
United States Oil And Gas Downstream Market Trends and Insights
Rising Gasoline Demand from Sustained VMT Growth
U.S. VMT reached 3.26 trillion miles in 2023, a 2.1% year-over-year increase, and this momentum anchors the baseline transportation fuel demand even as EV penetration accelerates. E-commerce fulfillment and last-mile logistics are lifting diesel and gasoline consumption at a pace that counterbalances slower passenger-car volumes. Sun Belt states lead with annual VMT increases above 3%, propelled by population inflows and construction activity. The U.S. Department of Transportation projects that commercial-vehicle mileage will grow at double the pace of passenger travel through 2027, providing refiners with a reliable user base for gasoline, diesel, and jet fuel production. The predictable demand profile aids capacity-planning decisions and undergirds the 4.00% CAGR outlook for the United States oil and gas downstream market.
Planned Refinery Modernization & Capacity Additions
More than USD 15 billion in announced projects are revamping U.S. plants, with the Gulf Coast absorbing the largest share. ExxonMobil's USD 2 billion Beaumont expansion adds 250,000 barrels per day (b/d) of throughput, while Chevron's USD 475 million Pasadena revamp lifts capacity by 15% and equips the site to process heavier crudes. Marathon Petroleum's USD 2.5 billion renewable-diesel build-out exemplifies the dual path of investing in both legacy and low-carbon fuel lines. New hydrocrackers and fluid catalytic crackers raise middle-distillate yields, improve energy efficiency by up to 8%, and future-proof plants for shifting crude slates. The modernization cycle expands the installed base that feeds the United States oil and gas downstream market while nudging average operating costs downward.
Accelerating EV Adoption Curbing Gasoline Demand
Electric-vehicle (EV) sales crossed 1.4 million units in 2023, taking 9.1% of total U.S. light-duty registrations. California leads with a 25% share, while Washington and Oregon account for over 15%, creating localized dips in gasoline demand. The USD 7.5 billion national charging-network rollout under the Infrastructure Investment and Jobs Act compresses adoption timelines, and purchase credits valid through 2032 keep consumer interest high. Fleet operators in dense urban corridors are electrifying vans and step-trucks to capture lifecycle savings, reducing diesel demand on specific routes.
Other drivers and restraints analyzed in the detailed report include:
- Surging Petrochemical Feedstock Demand
- Expansion of Renewable Diesel & SAF Projects
- Federal & State Decarbonization Compliance Costs
For complete list of drivers and restraints, kindly check the Table Of Contents.
Segment Analysis
Plants classified as refineries generated 56.75% of 2025 revenue inside the United States oil and gas downstream market, but petrochemical facilities are expected to advance at a 4.12% CAGR to 2031, the fastest pace among asset types. ExxonMobil's USD 2 billion Baytown investment underscores the strategic migration toward integrated footprints that share utilities, lower feedstock transport costs, and unlock high-margin chemical streams.
Integrated complexes can divert naphtha, butane, and ethane toward ethylene or propylene production when crack spreads narrow, cushioning cash flow. Historical data indicate that petrochemical plants are expected to grow at a rate of 2.8% annually from 2019 to 2024; the acceleration to 4.12% is attributed to the advantages of North American natural-gas liquids and expanding exports to Asia. Independent refineries must decide whether to pursue similar upgrades or risk compressing profitability in fuel-only models. The shift bolsters the long-term competitiveness of diversified operators and enhances the depth of the United States' oil and gas downstream market.
Complete Report Scope:
- By Type
- Refineries
- Petrochemical Plants
- By Product Type
- Refined Petroleum Products
- Petrochemicals
- Lubricants
- By Distribution Channel
- Direct Sales/Wholesale
- Distributors/Commercial
- Retail
List of Companies Covered in this Report:
- Marathon Petroleum Corporation
- Valero Energy Corporation
- Phillips 66
- Exxon Mobil Corporation
- Chevron Corporation
- Shell plc
- PBF Energy Inc.
- HF Sinclair Corporation
- CITGO Petroleum Corporation
- HollyFrontier Cheyenne Refining (HF Sinclair)
- Delek US Holdings
- Koch Industries - Flint Hills Resources
- LyondellBasell (Houston Refining)
- Calumet Specialty Product Partners
- Monroe Energy (Delta Air Lines)
- Hunt Refining Company
- U.S. Oil & Refining Co.
- Par Pacific Holdings
- Chalmette Refining (PBF/Torres)
- Delta's Trainer Refinery (Monroe)
Additional Benefits:
- The market estimate (ME) sheet in Excel format
- 3 months of analyst support
TABLE OF CONTENTS
1 Introduction
- 1.1 Study Assumptions & Market Definition
- 1.2 Scope of the Study
2 Research Methodology
3 Executive Summary
4 Market Landscape
- 4.1 Market Overview
- 4.2 Market Drivers
- 4.2.1 Rising gasoline demand from sustained VMT growth
- 4.2.2 Planned refinery modernization & capacity additions
- 4.2.3 Surging petrochemical feed-stock demand
- 4.2.4 Expansion of renewable diesel & SAF projects
- 4.2.5 Carbon capture tax credit driven projects
- 4.2.6 AI-based refinery optimization & margin gains
- 4.3 Market Restraints
- 4.3.1 Accelerating EV adoption curbing gasoline demand
- 4.3.2 Federal & state decarbonization compliance costs
- 4.3.3 Water-stress-driven effluent restrictions at refineries
- 4.3.4 Skilled labor shortages for turn-arounds & projects
- 4.4 Supply-Chain Analysis
- 4.5 Regulatory Landscape
- 4.6 Technological Outlook
- 4.7 Refining Capacity Analysis
- 4.8 Porters Five Forces
- 4.8.1 Threat of New Entrants
- 4.8.2 Bargaining Power of Suppliers
- 4.8.3 Bargaining Power of Buyers
- 4.8.4 Threat of Substitutes
- 4.8.5 Competitive Rivalry
- 4.9 PESTLE Analysis
5 Market Size & Growth Forecasts
- 5.1 By Type
- 5.1.1 Refineries
- 5.1.2 Petrochemical Plants
- 5.2 By Product Type
- 5.2.1 Refined Petroleum Products
- 5.2.2 Petrochemicals
- 5.2.3 Lubricants
- 5.3 By Distribution Channel
- 5.3.1 Direct Sales/Wholesale
- 5.3.2 Distributors/Commercial
- 5.3.3 Retail
6 Competitive Landscape
- 6.1 Market Concentration
- 6.2 Strategic Moves (M&A, Partnerships, PPAs)
- 6.3 Market Share Analysis (Market Rank/Share for key companies)
- 6.4 Company Profiles (includes Global level Overview, Market level overview, Core Segments, Financials as available, Strategic Information, Products & Services, and Recent Developments)
- 6.4.1 Marathon Petroleum Corporation
- 6.4.2 Valero Energy Corporation
- 6.4.3 Phillips 66
- 6.4.4 Exxon Mobil Corporation
- 6.4.5 Chevron Corporation
- 6.4.6 Shell plc
- 6.4.7 PBF Energy Inc.
- 6.4.8 HF Sinclair Corporation
- 6.4.9 CITGO Petroleum Corporation
- 6.4.10 HollyFrontier Cheyenne Refining (HF Sinclair)
- 6.4.11 Delek US Holdings
- 6.4.12 Koch Industries - Flint Hills Resources
- 6.4.13 LyondellBasell (Houston Refining)
- 6.4.14 Calumet Specialty Product Partners
- 6.4.15 Monroe Energy (Delta Air Lines)
- 6.4.16 Hunt Refining Company
- 6.4.17 U.S. Oil & Refining Co.
- 6.4.18 Par Pacific Holdings
- 6.4.19 Chalmette Refining (PBF/Torres)
- 6.4.20 Delta's Trainer Refinery (Monroe)
7 Market Opportunities & Future Outlook
- 7.1 White-space & Unmet-Need Assessment