

|
시장보고서
상품코드
2113824
비즈니스 인텔리전스(BI) : 시장 점유율 분석, 업계 동향 및 통계, 성장 예측(2026-2031년)Business Intelligence (BI) - Market Share Analysis, Industry Trends & Statistics, Growth Forecasts (2026 - 2031) |
||||||
 Mordor Intelligence
Mordor Intelligence에 의하면, 비즈니스 인텔리전스(BI) 시장 규모는 2026년에 411억 6,000만 달러에 이르고, 2031년까지 623억 8,000만 달러로 확대되어 CAGR은 8.67%를 나타낼 것으로 예측됩니다.
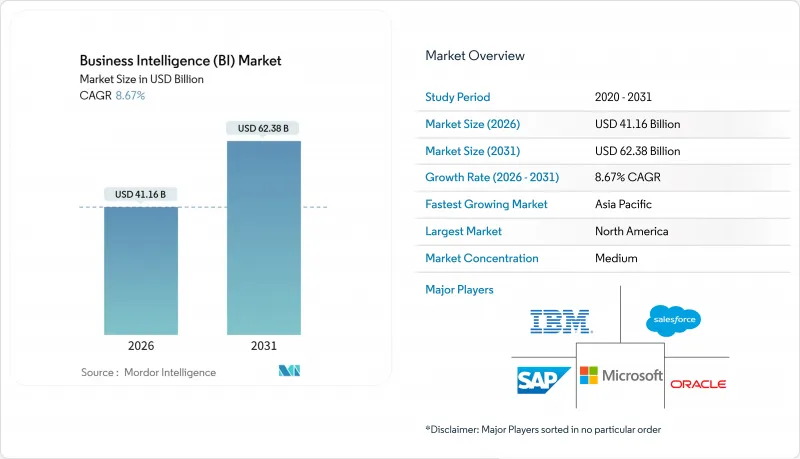
본 보고서는 구성 요소(소프트웨어 및 플랫폼, 서비스), 도입 형태(On-Premise, 클라우드), 비즈니스 모델(구독/SaaS 라이선스, 영구 라이선스 등), 최종 사용자 산업(은행, 금융서비스 및 보험(BFSI), IT 및 통신 등), 지역별로 분류되어 있습니다. 시장 예측은 금액(미 달러) 기준으로 제시되어 있습니다.
세계의 비즈니스 인텔리전스(BI) 시장 동향 및 인사이트
클라우드 우선 분석 도입
기업들은 초 단위의 종량제 과금제를 통해 실제 사용량에 따른 지출이 가능해짐에 따라, 분석 워크로드를 매니지드 클라우드 생태계로 지속적으로 이전하고 있습니다. Amazon Redshift Serverless와 같은 서버리스 데이터 웨어하우스는 수천 건의 동시 쿼리를 처리할 수 있도록 자동 스케일링을 수행하며, 이를 통해 팀은 과거 On-Premise 구축에 수년이 소요되던 파일럿용 대시보드를 불과 몇 주 만에 완성할 수 있게 되었습니다. Google BigQuery의 스트리밍 삽입 기능과 Gemini AI의 통합을 통해 비즈니스 사용자는 자연어로 질문을 입력할 수 있고, 플랫폼이 이를 SQL로 변환해 주기 때문에 전문 분석가 이외의 사용자도 참여할 수 있는 범위가 넓어지고 있습니다. Microsoft Power BI와 Fabric을 결합하면 새로운 데이터가 도착할 때마다 시각화를 업데이트할 수 있어, 매일 밤 수행되던 배치 처리 시간을 없앨 수 있습니다. 금융 서비스 기업들은 하이브리드 운영 패턴을 유지하고 있으며, 규제 대상 기록은 On-Premise에 보관하는 한편, 탐색적 모델은 클라우드로 이전하고 있습니다. 이는 미국 감독 당국의 지침에서도 언급된 도입 방식입니다.
반구조화된 IoT 데이터의 폭발적 증가
산업용 센서, 차량 텔레매틱스, 스마트 시티 네트워크에서는 기존 관계형 데이터베이스로는 효율적으로 처리할 수 없는 양의 JSON, Avro, Parquet 파일이 매일 생성되고 있습니다. 컬럼나르형 레이크하우스 엔진은 ‘스키마 온 리드(Schema-on-Read)’를 채택하여, 트랜잭션 데이터와 병행하여 원시 디바이스 메시지를 쿼리함으로써, 제조 현장의 시범 운영에서 예상치 못한 다운타임을 20-30% 줄이는 예측 유지보수를 실현하고 있습니다. 피어 리뷰를 거친 벤치마크에 따르면, GPU 가속 SQL 엔진은 TPC-H 워크로드에서 CPU 시스템에 비해 8-60배 빠른 속도를 실현하여 최종 사용자의 대기 시간을 1초 미만으로 단축하고 있습니다. Snowflake의 VARIANT 데이터형과 Databricks의 Delta Lake는 구조화된 주문 데이터와 원시 텔레메트리 데이터를 단일 환경에서 호스팅하는 통합 스토리지의 좋은 예입니다. 5G 커버리지가 확대됨에 따라, 엣지 게이트웨이가 집계된 센서 스냅샷을 클라우드 오브젝트 스토어로 전송함으로써, 대역폭 비용을 관리 가능한 수준으로 억제하면서 거의 실시간으로 분석을 실현하고 있습니다.
데이터 리터러시를 갖춘 인재 부족
액센츄어의 2025년 조사에 따르면, 실용적인 데이터 기술을 갖춘 직원은 21%에 불과하며, 87%의 기업이 분석가 채용에 어려움을 겪고 있습니다. 세계경제포럼(WEF)은 데이터 분석을 2030년까지 미래에 필요한 상위 5대 기술로 꼽고 있지만, 학계에서는 수요를 충족시킬 만큼의 졸업생을 충분히 배출하지 못하고 있습니다. 급여 상승으로 인해 플랫폼 투자 예산이 인건비로 전환되면서, 신규 도입이 지연되는 사례도 나타나고 있습니다. 로우코드 도구는 유용하지만, 상충되는 정보원을 통합하거나 표본 편향을 처리할 때는 인간의 판단을 대체할 수 없습니다. 기업들은 사내 교육 프로그램이나 자격증 취득을 위한 보조금으로 대응하고 있지만, 기술 습득까지 걸리는 기간은 여전히 길어 비즈니스 인텔리전스(BI) 시장의 도입 곡선을 장기화시키고 있습니다.
부문 분석
서비스 매출은 연평균 성장률(CAGR) 9.23%로 확대되어 비즈니스 인텔리전스(BI) 시장 전체의 성장률을 상회했습니다. 이는 기업들이 해당 분야의 전문가를 기용하여 시맨틱 모델 설계, 쿼리 로직 최적화, 시민 분석가 양성을 진행하고 있기 때문입니다. 소프트웨어 및 플랫폼은 2025년 매출의 68.73%를 계속 차지했습니다. 이는 특히 단일 시각화 레이어를 표준화하고 있는 조직에서 라이선스 구독이 여전히 기반을 이루고 있기 때문입니다. 시스템 통합사업자들은 대시보드 지연 시간을 1초 미만으로 억제하거나 99.9%의 업데이트 신뢰성을 보장하는 등 서비스 수준 목표를 확약함으로써 차별화를 꾀하고, 시간 단위 과금이 아닌 성과 기반 계약을 통해 수익화를 도모하고 있습니다. 라이선스, 클라우드 인프라, 지속적인 최적화를 포괄하고 사용량에 따른 지불 방식을 채택한 매니지드 서비스 번들은 중견 기업의 구매자에게 자본 부담을 경감시켜 줄 뿐만 아니라, 영업 비용 모델로의 전환이라는 광범위한 IT 트렌드에도 부합합니다.
플랫폼 벤더는 시각화 자료나 DAX 수식을 자동 생성하는 AI 코파일럿을 통합함으로써 외부 컨설팅 수요를 줄이고, 경쟁 압박에 대응하고 있습니다. Oracle Autonomous Database와 SAP Analytics Cloud가 스토리지, 변환, 프리젠테이션 각 계층을 통합하여 기업의 데이터 자산을 고정화함으로써, 하이퍼스케일러의 수렴이 가속화되고 있습니다. 이에 반해, 서비스 제공업체는 크로스 플랫폼 거버넌스를 전문 분야로 삼아, 다국적 기업이 합병을 통해 확보한 여러 BI 스택을 통합할 수 있도록 지원하고 있습니다. 비즈니스 인텔리전스(BI) 시장 규모가 확대됨에 따라, 의약품 안전성 모니터링 신호 감지나 소매 수요 예측과 같은 산업별 이용 사례에 특화된 전문 부티크 기업들이 부상하고 있으며, 플랫폼 단순화라는 추세에도 불구하고 활기찬 자문 생태계가 유지되고 있습니다.
클라우드 부문은 2025년 매출의 65.87%를 차지했으며, 2031년까지 연평균 성장률(CAGR) 9.54%로 확대되고 있습니다. 클라우드 도입 부문이 시장을 독점하고 있는 이유는 가변형 컴퓨팅과 서버리스 스토리지로 인해 유휴 용량 비용이 제거되는 한편, 자동 스케일링이 예측 불가능한 분석 수요의 급증에 대응할 수 있기 때문입니다. 지속적인 데이터 수집 파이프라인을 통해 전자상거래 플래시 세일 모니터링을 위한 거의 실시간 대시보드가 제공됩니다. 이는 기존의 On-Premise형 어플라이언스에서는 구현하기 어려웠던 기능입니다. 인도나 인도네시아 등의 국가에서는 현지 데이터 처리가 요구되고 있으며, 이에 따라 각 하이퍼스케일러 기업들은 주권 요건을 충족하고 비즈니스 인텔리전스(BI) 시장의 추가 성장을 뒷받침하기 위해 국내 리전 구축을 추진하고 있습니다.
규제상의 제약으로 인해 환자 기록이나 신용 데이터를 오프사이트로 이동할 수 없는 병원이나 은행에서는 여전히 On-Premise 클러스터가 사용되고 있으며, 그 결과 기밀성이 높은 워크로드는 On-Premise에 남겨두고 고객 경험 실험은 클라우드에서 수행하는 하이브리드 아키텍처가 형성되고 있습니다. 멀티 클라우드 전략은 Amazon Web Services, Microsoft Azure, Google Cloud Platform에 리스크를 분산시킵니다만, 아웃바운드 통신료가 발생하여 그 비용이 컴퓨팅 비용을 초과하는 경우도 있어, Cloudflare R2와 같이 아웃바운드 통신료가 무료인 오브젝트 스토리지에 대한 관심이 높아지고 있습니다. 각 벤더사는 현재 쿼리 단위의 비용을 모델링하는 비용 최적화 대시보드를 통합하여, 재무 팀이 청구액을 예측하고 예상치 못한 고액 청구를 방지할 수 있도록 지원하고 있습니다.
지역별 분석
북미는 대시보드의 왕복 지연 시간을 10밀리초 미만으로 억제하는 하이퍼스케일러 데이터센터가 집중되어 있어, 2025년 매출의 39.85%를 차지했습니다. 성숙한 벤처 캐피털 생태계는 전문적인 AI 코파일럿을 제공하는 스타트업에 자금을 지원하고 있으며, 이로 인해 비즈니스 인텔리전스(BI) 시장의 채택이 훈련된 분석가의 범위를 넘어 확대되고 있습니다. 그러나 분석 역량을 갖춘 직원은 21%에 불과하여, 풍부한 기술이 있음에도 불구하고 플랫폼 활용이 제한되고 있습니다. 데이터 집약적 워크로드의 경우, 멀티클라우드 아웃바운드 통신 비용이 컴퓨팅 비용을 초과하는 경우가 있어, 처리와 스토리지를 동일한 장소에 배치하도록 아키텍처를 재설계해야 할 필요성이 대두되고 있습니다.
중국이 2025년까지 디지털 경제의 GDP 기여율을 60%로 만들겠다는 목표를 내걸고 국내 BI 플랫폼에 대한 투자를 장려하고 있는 만큼, 아시아태평양은 2031년까지 연평균 성장률(CAGR) 10.12%를 나타낼 것으로 예측됩니다. 인도의 ‘디지털 인디아(Digital India)’ 프로그램은 광대역 확충과 클라우드 도입에 대한 지원을 통해 현지화된 분석 솔루션에 대한 새로운 수요를 창출하고 있습니다. 동남아시아국가연합(ASEAN)은 2030년까지 디지털 경제 규모가 1조 달러에 달할 것으로 전망하고 있으며, 전자상거래 및 핀테크 분야가 분석 지출을 주도하고 있습니다. 그러나 중국, 인도, 동남아시아의 개인정보 보호 체계 차이로 인해 지역별 데이터 거주 요건이 필요해지면서 벤더의 규정 준수 비용이 증가하고 있습니다.
유럽에서는 기업들이 일반 데이터 보호 규정(GDPR(EU 개인정보보호규정))을 준수하기 위해 ‘프라이버시 바이 디자인’을 접목한 분석을 도입하고 있어 시장이 꾸준히 성장하고 있습니다. 이 규정에 따라 2023년에는 16억 유로의 벌금이 부과되었습니다. 남미에서는 브라질과 아르헨티나에서 기업들이 업무의 디지털화를 추진함에 따라 수요가 증가하고 있지만, 환율 변동으로 인해 대규모 프로젝트의 진전이 더딘 상황입니다. 중동 및 아프리카에서는 아랍에미리트와 사우디아라비아의 스마트 시티 계획을 통해 초기 단계의 기반이 마련되고 있지만, 인프라 격차와 기술 인력 부족이 단기적인 규모 확대를 제약하고 있어 지역 시스템 통합사업자와의 제휴가 필수적입니다.
기타 혜택 :
- 엑셀 형식 시장 예측(ME) 시트
- 3개월간의 애널리스트 지원
자주 묻는 질문
목차
제1장 서론
제2장 조사 방법
제3장 주요 요약
제4장 시장 구도
제5장 시장 규모 및 성장 예측
제6장 경쟁 구도
제7장 시장 기회 및 향후 전망
KTH 26.08.26According to Mordor Intelligence, the business intelligence (BI) market size reached USD 41.16 billion in 2026 and is projected to climb to USD 62.38 billion by 2031, registering an 8.67% CAGR.
This report is Segmented by Component (Software and Platform, and Services), Deployment (On-Premise, and Cloud), Business Model (Subscription / SaaS License, Perpetual License, and More), End-User Industry (BFSI, IT and Telecommunication, and More), and Geography. The Market Forecasts are Provided in Terms of Value (USD).
Global Business Intelligence (BI) Market Trends and Insights
Cloud-first analytics adoption
Enterprises continue to migrate analytic workloads into managed cloud ecosystems because pay-per-second pricing matches spending to actual consumption. Serverless warehouses such as Amazon Redshift Serverless auto-scale to meet thousands of concurrent queries, letting teams finish pilot dashboards in weeks rather than the multi-year timelines once associated with on-premise builds. Google BigQuery's streaming inserts and Gemini AI integration allow business users to issue natural-language questions that the platform translates into SQL, widening participation beyond specialized analysts. Microsoft Power BI paired with Fabric can refresh visuals whenever new data lands, eliminating nightly batch windows. Financial-services firms maintain hybrid patterns, keeping regulated records on-premise while exploratory models move to the cloud, a deployment style referenced in U.S. supervisory guidance.
Explosion of Semi-Structured IoT Data
Industrial sensors, vehicle telematics, and smart-city networks push daily payloads of JSON, Avro, and Parquet files that traditional relational databases cannot absorb efficiently. Columnar lakehouse engines use schema-on-read to query raw device messages alongside transactional data, enabling predictive maintenance that cuts unplanned downtime by 20-30% in manufacturing trials. Peer-reviewed benchmarks show GPU-accelerated SQL engines delivering 8-60X speed-ups versus CPU systems on TPC-H workloads, reducing end-user wait times to sub-second levels. Snowflake's VARIANT data type and Databricks Delta Lake illustrate unified storage that hosts structured orders and raw telemetry in a single environment. As 5G coverage expands, edge gateways forward aggregated sensor snapshots to cloud object stores, keeping bandwidth costs manageable while still enabling near-real-time analytics.
Shortage of Data-Literate Workforce
Accenture's 2025 survey shows only 21% of employees possess functional data skills, leaving 87% of enterprises struggling to fill analyst roles. The World Economic Forum ranks data analysis among the top five future skills through 2030, yet academic programs are not producing graduates fast enough to meet demand. Rising salaries divert budgets away from platform investments into compensation, sometimes delaying new deployments. Low-code tools help but cannot replace human judgment when reconciling conflicting sources or addressing sampling bias. Companies respond with internal academies and certification stipends, yet ramp-up timelines remain lengthy, extending the adoption curve in the Business Intelligence (BI) market.
Other drivers and restraints analyzed in the detailed report include:
- Mainstream Embedded BI in SaaS Apps
- Data Clean-Room Partnerships
- Up-Front Integration Cost for Legacy Systems
For complete list of drivers and restraints, kindly check the Table Of Contents.
Segment Analysis
Services revenue expanded at a 9.23% CAGR, outpacing the Business Intelligence (BI) market because companies enlist domain experts to design semantic models, optimize query logic, and train citizen analysts. Software and platforms retained 68.73% 2025 revenue as license subscriptions remain foundational, particularly for organizations standardizing on a single visualization layer. Systems integrators differentiate by guaranteeing service-level objectives such as sub-second dashboard latency or 99.9% refresh reliability, monetizing outcome-based contracts rather than billable hours. Managed-service bundles that wrap licenses, cloud infrastructure, and ongoing optimization into usage-based payments reduce capital strain for mid-market buyers, aligning with broader IT shifts toward operating-expense models.
Platform vendors counter competitive pressure by embedding AI copilots that auto-generate visuals and DAX formulas, lowering external consulting needs. Hyperscaler convergence accelerates, as Oracle Autonomous Database and SAP Analytics Cloud combine storage, transformation, and presentation layers to lock in enterprise data estates. Services providers respond by specializing in cross-platform governance, helping multinational clients reconcile multiple BI stacks acquired through mergers. As the Business Intelligence (BI) market size rises, specialist boutiques emerge around vertical use cases such as pharmacovigilance signal detection and retail demand sensing, sustaining a vibrant advisor ecosystem despite platform simplification trends.
The cloud segment accounted for 65.87% of 2025 revenue and is advancing at a 9.54% CAGR through 2031. The cloud implementations segment dominates the market because variable compute and serverless warehousing eliminate idle capacity costs while auto-scaling meets unpredictable analytical surges. Continuous ingestion pipelines feed near-real-time dashboards for e-commerce flash-sale monitoring, a capability historically out of reach for on-premise appliances. Nations such as India and Indonesia require local data processing, prompting hyperscalers to launch in-country regions that meet sovereignty mandates and support further growth of the Business Intelligence (BI) market.
On-premises clusters persist in hospitals and banks that cannot move patient records or credit data off-site due to regulatory constraints, resulting in hybrid architectures where sensitive workloads remain on-premises while customer experience experimentation occurs in the cloud. Multi-cloud strategies spread risk across Amazon Web Services, Microsoft Azure, and Google Cloud Platform but incur egress charges that sometimes eclipse compute costs, prompting interest in zero-egress object stores such as Cloudflare R2. Vendors now integrate cost-optimizer dashboards that model query-level spend, helping finance teams predict invoices and avoid sticker shock.
Complete Report Scope:
- By Component
- Software and Platform
- Services
- By Deployment
- On-Premise
- Cloud
- By End-User Industry
- BFSI
- IT and Telecommunication
- Retail and e-Commerce
- Healthcare
- Manufacturing
- Government and Public Sector
- By Business Model
- Subscription / SaaS License
- Perpetual License
- Freemium / Usage-Based
- Managed Service / BI-as-a-Service
- By Geography
- North America
- United States
- Canada
- Mexico
- South America
- Brazil
- Argentina
- Rest of South America
- Europe
- United Kingdom
- Germany
- France
- Italy
- Spain
- Russia
- Rest of Europe
- Asia-Pacific
- China
- Japan
- India
- South Korea
- Australia and New Zealand
- Southeast Asia
- Rest of Asia-Pacific
- Middle East and Africa
- Middle East
- Saudi Arabia
- United Arab Emirates
- Turkey
- Rest of Middle East
- Africa
- South Africa
- Nigeria
- Kenya
- Rest of Africa
- Middle East
- North America
Geography Analysis
North America captured 39.85% of 2025 revenue thanks to concentrated hyperscaler data centers that keep dashboard round-trip latency below 10 milliseconds. Mature venture-capital ecosystems fund start-ups offering specialized AI copilots that broaden Business Intelligence (BI) market adoption beyond trained analysts. Only 21% of workers hold analytical competency, limiting platform utilization despite abundant technology. Multi-cloud egress charges occasionally surpass compute spend for data-intensive workloads, forcing architectural redesign to co-locate processing and storage.
Asia-Pacific is forecast to log a 10.12% CAGR to 2031 as China targets a 60% digital-economy contribution to GDP by 2025, spurring domestic BI platform investment. India's Digital India program expands broadband and subsidizes cloud adoption, creating greenfield demand for localized analytics solutions. The Association of Southeast Asian Nations projects its digital economy will reach USD 1 trillion by 2030, with e-commerce and fintech sectors spearheading analytics spend. However, divergent privacy frameworks across China, India, and Southeast Asia require region-specific data residencies, inflating vendor compliance costs.
Europe grows steadily as enterprises embed privacy-by-design analytics to satisfy the General Data Protection Regulation, which levied EUR 1.6 billion in fines during 2023. South America witnesses upticks in Brazil and Argentina as firms digitize operations, but currency volatility slows mega-projects. The Middle East and Africa plant early seeds via smart-city programs in the United Arab Emirates and Saudi Arabia, yet infrastructure gaps and skills shortages constrain near-term scale, making partnerships with regional integrators essential.
- Microsoft Corporation
- SAP SE
- Oracle Corporation
- International Business Machines Corporation
- SAS Institute Inc.
- Salesforce Inc.
- Amazon Web Services Inc.
- Google LLC
- QlikTech International AB
- MicroStrategy Incorporated
- Domo Inc.
- TIBCO Software Inc.
- Infor Inc.
- Zoho Corporation Pvt. Ltd.
- Teradata Corporation
- Alteryx Inc.
- Sisense Inc.
- ThoughtSpot Inc.
- Yellowfin International Pty Ltd.
- GoodData Corporation
Additional Benefits:
- The market estimate (ME) sheet in Excel format
- 3 months of analyst support
TABLE OF CONTENTS
1 INTRODUCTION
- 1.1 Study Assumptions and Market Definition
- 1.2 Scope of the Study
2 RESEARCH METHODOLOGY
3 EXECUTIVE SUMMARY
4 MARKET LANDSCAPE
- 4.1 Market Overview
- 4.2 Market Drivers
- 4.2.1 Cloud-First Analytics Adoption
- 4.2.2 Explosion of Semi-Structured IoT Data
- 4.2.3 Mainstream Embedded BI in SaaS Business Apps
- 4.2.4 Data Clean-Room Partnerships in Privacy-First Advertising
- 4.2.5 GPU-Accelerated Query Engines Lowering TCO
- 4.2.6 Rise of Analytics-as-Code and GitOps Practices
- 4.3 Market Restraints
- 4.3.1 Shortage of Data-Literate Workforce
- 4.3.2 Up-Front Integration Cost for Legacy Core Systems
- 4.3.3 Escalating Egress Fees in Multi-Cloud BI Architectures
- 4.3.4 Data-Sovereignty Clampdowns in Emerging Digital-Trade Rules
- 4.4 Industry Supply-Chain Analysis
- 4.5 Regulatory Landscape
- 4.6 Technological Outlook
- 4.7 Impact of Macroeconomic Factors on the Market
- 4.8 Porter's Five Forces Analysis
- 4.8.1 Bargaining Power of Suppliers
- 4.8.2 Bargaining Power of Buyers and Consumers
- 4.8.3 Threat of New Entrants
- 4.8.4 Threat of Substitute Products
- 4.8.5 Intensity of Competitive Rivalry
5 MARKET SIZE AND GROWTH FORECASTS (VALUE)
- 5.1 By Component
- 5.1.1 Software and Platform
- 5.1.2 Services
- 5.2 By Deployment
- 5.2.1 On-Premise
- 5.2.2 Cloud
- 5.3 By End-User Industry
- 5.3.1 BFSI
- 5.3.2 IT and Telecommunication
- 5.3.3 Retail and e-Commerce
- 5.3.4 Healthcare
- 5.3.5 Manufacturing
- 5.3.6 Government and Public Sector
- 5.4 By Business Model
- 5.4.1 Subscription / SaaS License
- 5.4.2 Perpetual License
- 5.4.3 Freemium / Usage-Based
- 5.4.4 Managed Service / BI-as-a-Service
- 5.5 By Geography
- 5.5.1 North America
- 5.5.1.1 United States
- 5.5.1.2 Canada
- 5.5.1.3 Mexico
- 5.5.2 South America
- 5.5.2.1 Brazil
- 5.5.2.2 Argentina
- 5.5.2.3 Rest of South America
- 5.5.3 Europe
- 5.5.3.1 United Kingdom
- 5.5.3.2 Germany
- 5.5.3.3 France
- 5.5.3.4 Italy
- 5.5.3.5 Spain
- 5.5.3.6 Russia
- 5.5.3.7 Rest of Europe
- 5.5.4 Asia-Pacific
- 5.5.4.1 China
- 5.5.4.2 Japan
- 5.5.4.3 India
- 5.5.4.4 South Korea
- 5.5.4.5 Australia and New Zealand
- 5.5.4.6 Southeast Asia
- 5.5.4.7 Rest of Asia-Pacific
- 5.5.5 Middle East and Africa
- 5.5.5.1 Middle East
- 5.5.5.1.1 Saudi Arabia
- 5.5.5.1.2 United Arab Emirates
- 5.5.5.1.3 Turkey
- 5.5.5.1.4 Rest of Middle East
- 5.5.5.2 Africa
- 5.5.5.2.1 South Africa
- 5.5.5.2.2 Nigeria
- 5.5.5.2.3 Kenya
- 5.5.5.2.4 Rest of Africa
- 5.5.5.1 Middle East
- 5.5.1 North America
6 COMPETITIVE LANDSCAPE
- 6.1 Market Concentration
- 6.2 Strategic Moves
- 6.3 Market Share Analysis
- 6.4 Company Profiles (includes Global-Level Overview, Market-Level Overview, Core Segments, Financials as Available, Strategic Information, Market Rank/Share for Key Companies, Products and Services, and Recent Developments)
- 6.4.1 Microsoft Corporation
- 6.4.2 SAP SE
- 6.4.3 Oracle Corporation
- 6.4.4 International Business Machines Corporation
- 6.4.5 SAS Institute Inc.
- 6.4.6 Salesforce Inc.
- 6.4.7 Amazon Web Services Inc.
- 6.4.8 Google LLC
- 6.4.9 QlikTech International AB
- 6.4.10 MicroStrategy Incorporated
- 6.4.11 Domo Inc.
- 6.4.12 TIBCO Software Inc.
- 6.4.13 Infor Inc.
- 6.4.14 Zoho Corporation Pvt. Ltd.
- 6.4.15 Teradata Corporation
- 6.4.16 Alteryx Inc.
- 6.4.17 Sisense Inc.
- 6.4.18 ThoughtSpot Inc.
- 6.4.19 Yellowfin International Pty Ltd.
- 6.4.20 GoodData Corporation
7 MARKET OPPORTUNITIES AND FUTURE OUTLOOK
- 7.1 White-Space and Unmet-Need Assessment


