

|
시장보고서
상품코드
2115241
전기자동차(EV) 택시 시장 : 점유율 분석, 업계 동향과 통계, 성장 예측(2026-2031년)EV Taxi - Market Share Analysis, Industry Trends & Statistics, Growth Forecasts (2026 - 2031) |
||||||
 Mordor Intelligence
Mordor Intelligence에 의하면, 2026년 전기자동차(EV) 택시 시장 규모는 368억 1,000만 달러로 추정되고 있어 2025년 295억 4,000만 달러에서 확대해, 2031년에는 1,105억 6,000만 달러에 이를 것으로 예측됩니다.
2026년부터 2031년까지 연평균 성장률(CAGR) 24.6%로 성장할 것으로 전망됩니다.
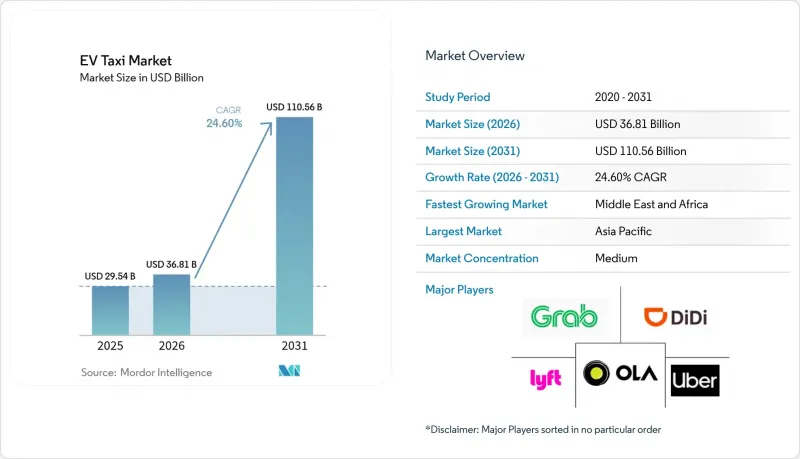
본 보고서는 구동 방식(배터리식 전기차, 플러그인 하이브리드차 등), 차종(이륜 택시, 삼륜 택시 등), 서비스 모델(라이드 헤일링, 라이드 셰어링 등), 소유 형태(플릿 소유 등), 배터리 용량(30KWh 미만 등) 및 지역별로 분류되어 있습니다. 시장 전망은 금액(달러) 기준으로 제시되어 있습니다.
세계 전기자동차(EV) 택시 시장 동향 및 인사이트
2026년까지 총 소유 비용(TCO)의 패리티
배터리 비용의 급격한 하락(현재 1kWh당 100달러 미만)과 연료 가격의 급등이 경제적 전환점을 뒷받침하고 있습니다. 주행 거리가 많은 택시의 운영 주기에서는 연료비와 유지보수비 절감을 통해 도입 시의 높은 초기 비용이 운영 개시 후 3년 이내에 상쇄됩니다. 구매 리베이트나 가속 상각과 같은 인센티브 제도를 통해 투자 회수 기간은 더욱 단축됩니다. 그 결과, 사업자들은 디젤 파워트레인이 아닌 전기 구동 시스템을 전제로 내부수익률(IRR) 모델을 재검토하고 있습니다. 이에 대응하여 금융 기관들은 예측 가능한 현금 흐름 절감을 근거로, 더 장기적이고 낮은 금리의 대출을 제공합니다.
라이드셰어 플랫폼의 전기화 노력
각 플랫폼은 지속가능성 목표를 차별화 요소로 삼아 투자자로부터 자금을 확보하는 데 활용하고 있습니다. 우버(Uber)는 2040년까지 제로 배출 차량 플릿을 실현하겠다고 공약하며, 전 세계 지속가능성 목표 달성을 위해 노력하고 있습니다. 이 목표는 전략적 제휴와 광범위한 조달 전략을 통해 뒷받침되고 있으며, BYD 등 주요 제조업체로부터 전기차를 구매하겠다는 의향서 체결이 그 대표적인 예입니다. 이러한 움직임은 단순한 포부에서 구체적인 실행으로의 전환을 보여주며, 우버가 공급망을 구축하고 도시 모빌리티 분야의 벤치마크를 확립할 수 있도록 하고 있습니다. 한편, 리프트는 승객에게 추가 요금을 지불하는 ‘친환경’ 옵션을 제공함으로써, 운전기사를 자연스럽게 전기차 모델로 유도하고 있습니다. 이러한 보장은 대량 구매를 뒷받침하는 지속적인 수요를 창출하며, 택시에 최적화된 사양의 차량에 대한 공장 할당을 촉진하고 있습니다.
충전으로 인한 차량 가동 중단 시간의 길이
전기자동차(EV) 택시는 충전 시간이 길고, 피크 시간대에는 충전 대기 현상이 빈번하게 발생하기 때문에 가솔린 차량에 비해 운행 중지 시간이 길어집니다. 인구 밀도가 높은 도시의 사업자에게는 교대 근무 시간이 충전기 혼잡 시간대와 겹칠 경우 그 영향을 뼈저리게 실감하게 됩니다. 서비스 제공 시간의 손실은 수익 감소나 팁 감소로 직결되기 때문에 보조금이 지급되는 경우에도 전환을 주저하는 운전자들이 있습니다. 메가와트급 충전 설비나 더 우수한 부하 관리 소프트웨어의 보급에 따라 이러한 제약은 완화될 것으로 예상되지만, 단기적으로는 여전히 용량 부족이 도입의 걸림돌이 되고 있습니다.
부문 분석
2025년 시점에서 배터리식 전기차(BEV)는 전기자동차(EV) 택시 시장 점유율의 62.72%를 차지하고 있으며, 이는 전기자동차(EV) 택시 시장에서 구동계의 단순성과 낮은 정비 비용이 중요시되고 있음을 알 수 있습니다. 그러나 도시 외곽 지역의 고속도로 충전소 부족을 우려하는 사업자들로 인해 플러그인 하이브리드차(PHEV)는 2031년까지 연평균 성장률(CAGR) 26.8%라는 급속한 성장세를 보이고 있습니다. 따라서 전국적인 충전 인프라 밀도가 정상화될 때까지는 전기자동차(EV) 택시 업계에서 이중 조달 전략이 채택될 가능성이 높습니다. 선견지명이 있는 사업자들은 2028년 이후 하이브리드차를 무공해 차량의 정의에서 제외할 계획이 있는 지역에서 이미 순수 전기차로의 전환을 추진하고 있습니다. 한편, 연료전지차의 시범 도입은 수소 회랑 프로젝트로 한정되어 있어, 현재 전기자동차(EV) 택시 시장 전체에서 차지하는 비중은 1% 미만에 그치고 있습니다.
2세대 PHEV는 20kWh 이상의 배터리와 고효율 레인지 익스텐더를 결합하여 시내 이동의 대부분을 커버할 수 있는 80km의 순수 전기 주행 거리를 실현하고 있습니다. 이러한 유연성은 설비 투자와 가동 시간의 균형을 고려하는 중견 택시 사업자에게 매력적입니다. 하지만 5년간의 현금 흐름을 비교해 보면, 애널리스트들은 충전 대기 시간이 12분 미만으로 단축되는 시점에서 BEV의 순현재가치가 더 낮아질 것으로 보고 있습니다. 이러한 전환점으로 인해 2020년대 후반에는 BEV의 우위가 확고해질 가능성이 있습니다.
2025년, 사륜 세단 및 해치백은 확립된 규제와 승객의 편의성에 대한 기대에 힘입어 전기자동차(EV) 택시 시장 점유율의 73.46%를 차지했습니다. 한편, 전기 오토바이와 스쿠터는 2031년까지 연평균 성장률(CAGR) 27.9%라는 눈부신 성장을 기록하고 있습니다. 이는 좁은 도로, 저렴한 요금, 모듈식 배터리 팩이 보급을 뒷받침하고 있는 인도네시아, 인도, 베트남이 주도하고 있습니다. 이러한 이륜차에는 일반적으로 3-8kWh의 배터리가 필요하며, 2분 이내에 주행 거리를 완전히 회복할 수 있는 도로상 배터리 교환이 가능합니다.
규제 당국은 이륜차를 정식 택시 범주로 점점 더 인정하고 있으며, 플랫폼 앱과 연동된 디지털 면허증을 발급하고 있습니다. 이러한 합법화 덕분에 운전자의 소득 전망이 개선되고 자금 조달 기회도 확대되고 있습니다. 미니밴과 MPV는 공항으로의 다인승 운송 노선에서 여전히 역할을 수행하고 있습니다. 다만, 전기자동차(EV) 택시 시장 규모 지표 측면에서 소형 승용차의 우위를 크게 흔들지는 못할 것으로 예측됩니다.
지역별 분석
2025년, 아시아태평양은 전기자동차(EV) 택시 시장의 43.02% 점유율을 차지하고 있으며, 이는 중국의 제조 역량, 인도의 이륜차 붐, 그리고 일본, 한국, 호주의 적극적인 정책 인센티브를 반영한 것입니다. 중국의 성(省) 단위 듀얼 크레딧 제도 덕분에 차량 운영 사업자는 규정 준수 인증서를 거래할 수 있어 프로젝트의 경제성이 향상되고 있습니다. 한편, 인도의 FAME-II 보조금 제도는 배터리 팩 및 충전기의 현지 생산을 촉진하고 국내 공급망을 강화함으로써 소매 가격 안정화에 기여하고 있습니다.
중동 및 아프리카는 2031년까지 28.45%라는 가장 높은 연평균 성장률(CAGR)을 나타낼 전망입니다. 이는 2030년 엑스포를 겨냥한 아랍에미리트의 ‘제로 배출 지상 교통’ 구상과 사우디아라비아의 스마트 시티 구상 ‘NEOM’이 주도하고 있습니다. 넉넉한 전기 요금과 풍부한 태양광 발전 용량 덕분에 운영 비용은 더욱 절감됩니다. 이집트와 모로코에서는 그린본드를 자금원으로 하는 택시 전기화 계획이 전개되고 있으며, 다자간 기관의 양허성 융자를 활용하고 있습니다.
캘리포니아주의 ‘첨단 청정 차량 규정(Advanced Clean Fleets rule)’이 방향성을 제시하는 한편, 뉴욕시에서는 신규 내연기관 택시 영업권 발급에 상한선을 두고 있습니다. 유럽은 성숙한 공공 충전 네트워크의 혜택을 누리고 있지만, 여전히 지속되는 에너지 가격 변동이 운전자의 투자 회수 계산에 영향을 미치고 있습니다. 남미는 환율 리스크와 높은 자본 비용으로 인해 뒤처지고 있지만, 브라질과 콜롬비아에서는 야간 차량 충전 요금 할인을 시범적으로 도입하기 시작했습니다.
기타 혜택:
- 엑셀 형식 시장 예측(ME) 시트
- 3개월간의 애널리스트 지원
자주 묻는 질문
목차
제1장 서론
제2장 조사 방법
제3장 주요 요약
제4장 시장 구도
제5장 시장 규모와 성장 예측
제6장 경쟁 구도
JHS 26.08.26According to Mordor Intelligence, EV taxi market size in 2026 is estimated at USD 36.81 billion, growing from 2025 value of USD 29.54 billion with 2031 projections showing USD 110.56 billion, growing at 24.6% CAGR over 2026-2031.
This report is Segmented by Propulsion Type (Battery Electric Vehicle, Plug-In Hybrid Electric Vehicle, and More), Vehicle Type (Two-Wheeler Taxi, Three-Wheeler Taxi, and More), Service Model (Ride-Hailing, Ride-Sharing, and More), Ownership Model (Fleet-Owned, and More), Battery Capacity (Less Than 30 KWh, and More), and Geography. The Market Forecasts are Provided in Terms of Value (USD).
Global EV Taxi Market Trends and Insights
Total-Cost-of-Ownership Parity by 2026
Rapid battery cost declines-now under USD 100 per kWh-and high fuel prices drive economic inflection. In high-mileage taxi duty cycles, fuel and maintenance savings offset higher upfront pricing within three years of operation. Incentive structures such as purchase rebates and accelerated depreciation compress the payback horizon further. Operators consequently rewrite internal rate-of-return models around electric drivetrains rather than diesel powertrains. Lenders respond by offering longer-tenor, lower-coupon debt backed by predictable cash-flow savings.
Ride-Hailing Platform Electrification Commitments
Platforms use sustainability targets to differentiate and secure investor capital. Uber is striving toward its global sustainability objectives, pledging to achieve a zero-emission fleet by 2040. This goal is bolstered by strategic alliances and extensive procurement strategies, highlighted by a letter of intent to acquire electric vehicles from top manufacturers like BYD. Such actions indicate a transition from mere aspiration to tangible execution, empowering Uber to shape supply chains and set benchmarks in urban mobility. Meanwhile, Lyft offers riders "Green" options for a premium fare, subtly steering its driver partners towards electric models. Such guarantees create durable demand that underpins volume purchasing, catalyzing factory allocation for taxi-optimized trims.
High Vehicle Downtime Due to Charging
Electric taxis spend more time off-duty than gasoline equivalents because charging sessions are longer and queuing is common at peak hours. Operators in dense cities feel the pinch when simultaneous shift changes coincide with charger congestion. Lost service minutes translate directly to revenue attrition and tip reductions, making some drivers reluctant to convert even when subsidies exist. The constraint is expected to ease as megawatt charging and better load-management software scale, yet near-term capacity gaps still dampen adoption.
Other drivers and restraints analyzed in the detailed report include:
- Government Zero-Emission Taxi Mandates
- Expansion of Rapid-Charging Hubs at Airports and Urban Cores
- Uncertain Residual Values for Used E-Taxis
For complete list of drivers and restraints, kindly check the Table Of Contents.
Segment Analysis
Battery electric vehicles represented 62.72% share of the EV taxi market in 2025, illustrating that the electric vehicle taxi market favors drivetrain simplicity and low servicing costs. Plug-in hybrids, however, are gaining swiftly at a 26.8% CAGR through 2031, as operators hedge against sparse highway chargers in peri-urban zones. Therefore, the electric vehicle taxi industry will likely see dual-track procurement strategies until nationwide charging density normalizes. Forward-looking operators already pivot to pure electric in regions planning to exclude hybrids from zero-emission definitions after 2028. Meanwhile, fuel-cell pilots remain confined to hydrogen-corridor projects, collectively under 1% of the current electric vehicle taxi market.
Second-generation PHEVs pair 20+ kWh batteries with efficient range-extenders, allowing 80 km electric-only range that covers most intra-city trips. This flexibility appeals to mid-tier fleet operators who are balancing capex and uptime considerations. Nonetheless, when comparing five-year cash flows, analysts see BEVs achieving a lower net-present cost as soon as charger queuing times fall below twelve minutes. That inflection could lock in BEV dominance by the late decade.
Four-wheeler sedans and hatchbacks commanded 73.46% of the electric vehicle taxi market share during 2025, thanks to entrenched regulations and passenger comfort expectations. Yet electric motorcycles and scooters are registering a brisk 27.9% CAGR through 2031, led by Indonesia, India, and Vietnam, where narrow streets, low fares, and modular battery packs propel adoption. These two-wheeler formats often need 3-8 kWh batteries, opening the door to curbside swapping that restores full range in under two minutes.
Regulators increasingly recognize two-wheelers as legitimate taxi categories, issuing digital permits linked to platform apps. That legitimacy improves driver income visibility and accelerates financing availability. Minivans and MPVs retain a role in multi-passenger airport routes. Still, they are not forecast to materially disrupt the dominance of smaller four-wheelers within the electric vehicle taxi market size metrics.
Complete Report Scope:
- By Propulsion Type
- Battery Electric Vehicle (BEV)
- Plug-in Hybrid Electric Vehicle (PHEV)
- Hybrid Electric Vehicle (HEV)
- Fuel-Cell Electric Vehicle (FCEV)
- By Vehicle Type
- Two-wheeler Taxi
- Three-wheeler Taxi
- Four-wheeler Taxi (Sedan/Hatchback)
- Multi-Purpose Vehicle / Minivan
- By Service Model
- Ride-hailing (On-demand)
- Ride-sharing (Pooling)
- Corporate / Institutional Fleet
- Airport and Tourism Shuttle
- By Ownership Model
- Fleet-Owned / Operator
- Driver-Owned
- Leasing and Subscription
- By Battery Capacity
- Less than 30 kWh
- 30-60 kWh
- Above 60 kWh
- By Geography
- North America
- United States
- Canada
- Rest of North America
- South America
- Brazil
- Argentina
- Rest of South America
- Europe
- Germany
- United Kingdom
- France
- Italy
- Spain
- Netherlands
- Norway
- Russia
- Rest of Europe
- Asia-Pacific
- China
- India
- Japan
- South Korea
- Australia
- Indonesia
- Thailand
- Rest of Asia-Pacific
- Middle East and Africa
- United Arab Emirates
- Saudi Arabia
- Turkey
- Egypt
- South Africa
- Rest of Middle East and Africa
- North America
Geography Analysis
Asia-Pacific holds 43.02% share of the EV taxi market in 2025, reflecting China's manufacturing heft, India's two-wheeler boom, and proactive policy incentives in Japan, South Korea, and Australia. Provincial dual-credit schemes in China allow fleet operators to trade compliance certificates, improving project economics. India's FAME-II subsidies, meanwhile, boost localization of battery packs and chargers, deepening domestic supply chains that stabilize retail pricing.
The Middle East and Africa will record the fastest 28.45% CAGR through 2031, led by the United Arab Emirates' zero-emission ground-transport vision for Expo 2030 and Saudi Arabia's NEOM smart-city blueprint. Generous electricity tariffs and abundant solar capacity further reduce operating costs. Egypt and Morocco are rolling out green-bond-funded taxi electrification schemes, drawing on multilaterals for concessional finance.
California's Advanced Clean Fleets rule sets the tone, while New York City caps new internal-combustion taxi medallions. Europe benefits from mature public charging networks, but lingering energy-price volatility still impacts driver payback calculations. South America trails due to exchange-rate risk and elevated cost of capital, yet Brazil and Colombia have begun piloting tariff discounts for overnight fleet charging.
- Lyft Inc.
- Ola Electric Mobility Pvt Ltd. (Ola Cabs)
- Uber Technologies Inc.
- Grab Holdings Ltd.
- Didi Chuxing Technology Co.
- GoGreen Cabs
- Phoenix Taxis
- CAB-EEZ Infra Tech Ltd
- XANHSM Green and Smart Mobility Indonesia (GSM)
- Prakriti E-Mobility Private Limited (Evera Cabs)
- eee-Mobility Solutions Private Limited
- Electric Cab North America
- Free Now GmbH
- Addison Lee Limited
- G7 New Energy Taxi (Beijing) Co.
- Yandex Go
- Bolt Technology OU
Additional Benefits:
- The market estimate (ME) sheet in Excel format
- 3 months of analyst support
TABLE OF CONTENTS
1 Introduction
- 1.1 Study Assumptions and Market Definition
- 1.2 Scope of the Study
2 Research Methodology
3 Executive Summary
4 Market Landscape
- 4.1 Market Overview
- 4.2 Market Drivers
- 4.2.1 Government Zero-Emission Taxi Mandates
- 4.2.2 Total-Cost-Of-Ownership (TCO) Parity By 2026
- 4.2.3 Expansion Of Rapid-Charging Hubs at Airports/Urban Cores
- 4.2.4 Ride-Hailing Platform Electrification Commitments
- 4.2.5 ESG-Linked Municipal Financing Programs
- 4.2.6 Battery-as-a-Service Subscription Economics
- 4.3 Market Restraints
- 4.3.1 High Vehicle Downtime Due To Charging
- 4.3.2 Uncertain Residual Values for Used E-Taxis
- 4.3.3 Urban Grid-Capacity Bottlenecks
- 4.3.4 OEM Production Priority Away from Taxi Variants
- 4.4 Value / Supply-Chain Analysis
- 4.5 Regulatory Landscape
- 4.6 Technological Outlook
- 4.7 Porter's Five Forces
- 4.7.1 Threat of New Entrants
- 4.7.2 Bargaining Power of Buyers
- 4.7.3 Bargaining Power of Suppliers
- 4.7.4 Threat of Substitutes
- 4.7.5 Intensity of Competitive Rivalry
5 Market Size and Growth Forecasts (Value (USD))
- 5.1 By Propulsion Type
- 5.1.1 Battery Electric Vehicle (BEV)
- 5.1.2 Plug-in Hybrid Electric Vehicle (PHEV)
- 5.1.3 Hybrid Electric Vehicle (HEV)
- 5.1.4 Fuel-Cell Electric Vehicle (FCEV)
- 5.2 By Vehicle Type
- 5.2.1 Two-wheeler Taxi
- 5.2.2 Three-wheeler Taxi
- 5.2.3 Four-wheeler Taxi (Sedan/Hatchback)
- 5.2.4 Multi-Purpose Vehicle / Minivan
- 5.3 By Service Model
- 5.3.1 Ride-hailing (On-demand)
- 5.3.2 Ride-sharing (Pooling)
- 5.3.3 Corporate / Institutional Fleet
- 5.3.4 Airport and Tourism Shuttle
- 5.4 By Ownership Model
- 5.4.1 Fleet-Owned / Operator
- 5.4.2 Driver-Owned
- 5.4.3 Leasing and Subscription
- 5.5 By Battery Capacity
- 5.5.1 Less than 30 kWh
- 5.5.2 30-60 kWh
- 5.5.3 Above 60 kWh
- 5.6 By Geography
- 5.6.1 North America
- 5.6.1.1 United States
- 5.6.1.2 Canada
- 5.6.1.3 Rest of North America
- 5.6.2 South America
- 5.6.2.1 Brazil
- 5.6.2.2 Argentina
- 5.6.2.3 Rest of South America
- 5.6.3 Europe
- 5.6.3.1 Germany
- 5.6.3.2 United Kingdom
- 5.6.3.3 France
- 5.6.3.4 Italy
- 5.6.3.5 Spain
- 5.6.3.6 Netherlands
- 5.6.3.7 Norway
- 5.6.3.8 Russia
- 5.6.3.9 Rest of Europe
- 5.6.4 Asia-Pacific
- 5.6.4.1 China
- 5.6.4.2 India
- 5.6.4.3 Japan
- 5.6.4.4 South Korea
- 5.6.4.5 Australia
- 5.6.4.6 Indonesia
- 5.6.4.7 Thailand
- 5.6.4.8 Rest of Asia-Pacific
- 5.6.5 Middle East and Africa
- 5.6.5.1 United Arab Emirates
- 5.6.5.2 Saudi Arabia
- 5.6.5.3 Turkey
- 5.6.5.4 Egypt
- 5.6.5.5 South Africa
- 5.6.5.6 Rest of Middle East and Africa
- 5.6.1 North America
6 Competitive Landscape
- 6.1 Market Concentration
- 6.2 Strategic Moves
- 6.3 Market Share Analysis
- 6.4 Company Profiles (Includes Global and Market Level Overview, Core Segments, Financials, Strategic Info, Market Share, Products, Services & Recent Developments)
- 6.4.1 Lyft Inc.
- 6.4.2 Ola Electric Mobility Pvt Ltd. (Ola Cabs)
- 6.4.3 Uber Technologies Inc.
- 6.4.4 Grab Holdings Ltd.
- 6.4.5 Didi Chuxing Technology Co.
- 6.4.6 GoGreen Cabs
- 6.4.7 Phoenix Taxis
- 6.4.8 CAB-EEZ Infra Tech Ltd
- 6.4.9 XANHSM Green and Smart Mobility Indonesia (GSM)
- 6.4.10 Prakriti E-Mobility Private Limited (Evera Cabs)
- 6.4.11 eee-Mobility Solutions Private Limited
- 6.4.12 Electric Cab North America
- 6.4.13 Free Now GmbH
- 6.4.14 Addison Lee Limited
- 6.4.15 G7 New Energy Taxi (Beijing) Co.
- 6.4.16 Yandex Go
- 6.4.17 Bolt Technology OU


