|
시장보고서
상품코드
2118021
비디오 전송 플랫폼 시장 : 점유율 분석, 업계 동향과 통계, 성장 예측(2026-2031년)Video Delivery Platform - Market Share Analysis, Industry Trends & Statistics, Growth Forecasts (2026 - 2031) |
||||||
 Mordor Intelligence
Mordor Intelligence에 의하면, 영상 전달 플랫폼 시장 규모는 2025년 47억 8,000만 달러에서 2026년에는 53억 5,000만 달러로 확대되어 2031년까지 101억 2,000만 달러에 이를 것으로 예측되며, 2026년부터 2031년까지 CAGR 13.60%로 성장할 전망입니다.
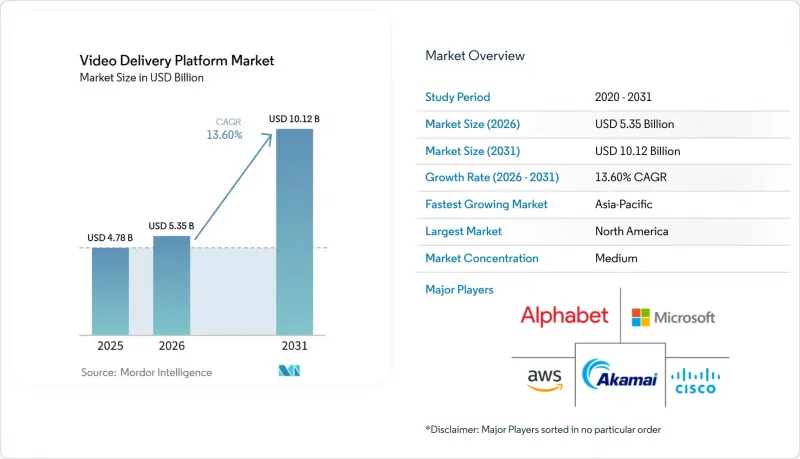
본 보고서는 구성 요소(플랫폼 및 서비스), 스트리밍 유형(라이브 스트리밍 및 주문형 비디오(VOD) 스트리밍), 수익 모델(구독형 주문형 비디오(SVOD), 광고 지원형 스트리밍(AVOD),하이브리드형 수익화 등), 최종 사용자(미디어 및 엔터테인먼트, e-러닝·교육, 금융 및 보험·증권(BFSI) 등), 그리고 지역별로 분류되어 있습니다. 시장 전망은 금액(달러) 기준으로 제시되어 있습니다.
세계 비디오 전송 플랫폼 시장 동향 및 인사이트
수익화된 스포츠 중계 및 이벤트 스트리밍이 인프라 투자를 견인
라이브 스포츠 및 프리미엄 이벤트는 비디오 전송 플랫폼 시장 수요 핵심을 이루고 있습니다. 이는 권리 보유자가 단기간에 집중되는 시청자 수의 피크 시간대에 신뢰할 수 있는 용량을 필요로 하기 때문입니다. 스트리밍 서비스의 스포츠 중계권 지출은 2025년 132억 달러에서 2026년에는 142억 달러에 달할 것으로 예측됩니다. 2026년에는 Amazon Prime Video가 각 스트리밍 서비스사의 스포츠 중계권 지출 중 38억 달러(27%)를 차지할 것으로 예측됩니다. 각 중계권 계약에는 인제스트, 트랜스코딩, 오리진 및 컨텐츠 전송 네트워크(CDN) 용량이 필요합니다. 플랫폼은 이벤트 개최 빈도가 낮더라도 트래픽 피크 시점에 대비해 용량을 확보해 두어야 합니다. 이로 인해 제공업체에게는 CDN-as-a-Service(CDN-as-a-Service)를 통해 미사용 용량을 대여할 기회가 생길 수 있습니다.
저지연 라이브 스트리밍에 대한 수요 증가가 프로토콜 표준을 재구축하고 있습니다.
시청자의 기대는 기존의 HTTP 어댑티브 스트리밍이 대응 가능한 지연 수준을 넘어섰으며, 비디오 전송 플랫폼 시장 전체에 명확한 업그레이드의 필요성이 대두되고 있습니다. ‘Media over QUIC’은 2026년 5월에 상용 생산을 시작했으며, BEAM Media Corp는 210개국에 걸친 라이브 스트림에서 엔드투엔드 지연 시간이 100밀리초 미만이라고 보고했습니다. Oracle은 2026년, Video Edge 아키텍처를 확장하고 Media over QUIC을 연계 수단으로 활용함으로써, 타사 컨텐츠 전송 네트워크 및 인터넷 서비스 제공업체(ISP)의 네트워크를 횡단하는 릴레이 배포를 지원했습니다. 이 프로토콜은 HLS나 DASH에서 볼 수 있는 고정된 부문 타이밍의 제약을 제거합니다. 또한, 객체 기반 전송 방식을 통해 더 짧은 간격으로 화질 조정이 가능해집니다. 이는 지연이 시청자의 참여나 거래 성사에 영향을 미칠 수 있는 인터랙티브 비디오 및 소셜 커머스 환경에서 중요한 의미를 지닙니다.
대역폭, 트랜스코딩 및 이그레스 비용의 급증으로 인해 이익률 확대가 저해됨
대규모 비디오 전송 비용은 사업자에게 여전히 관리가 어려운 과제이며, 비디오 전송 플랫폼 시장은 스트리밍 품질을 저하시키지 않으면서 이러한 압박에 대처해야 합니다. 2026년 기준, AWS CloudFront는 월간 스트리밍 트래픽의 첫 10TB에 대해 1GB당 0.085달러를 청구했습니다. 아시아태평양 및 남미 지역의 이그레스 요금은 북미 기준치의 2-4배였습니다. EU 데이터법에 따라 2027년 1월부터는 EU 고객에게 서비스를 제공하는 대상 제공업체에 대해 클라우드 전환 및 이그레스 요금이 금지될 전망입니다. 이 규정은 유럽 내 공급업체와의 협상에 변화를 가져올 수 있지만, 다른 지역의 구조적인 전송 비용 문제를 해결해 주지는 않습니다. 통신 사업자들은 비용 증가를 억제하기 위해 아웃바운드 요금을 회피하는 컨텐츠 인식형 인코딩, 엣지 캐싱 및 스토리지 구성을 채택하고 있습니다.
부문 분석
플랫폼 부문은 2025년에 비디오 전송 플랫폼 시장 점유율의 58.36%를 차지하며, 인제스트, 캡처, 처리, 인코딩, 트랜스코딩, 분석, 품질 경험(QoE) 모니터링 및 컨텐츠 보안을 포괄합니다. 기업의 구매 담당자들은 전체 비디오 워크플로우에 걸친 통합 작업을 줄이고 운영상의 책임 소재를 명확히 하기 위해 통합된 벤더 스택을 선호합니다. 또한, 플랫폼 부문은 컨텐츠 인제스트부터 재생 보호, 세션 모니터링에 이르기까지 비디오 전송 플랫폼 시장의 전송 품질을 좌우하는 기술에 중점을 두고 있습니다. 전문 서비스 및 관리형 서비스를 포함한 서비스 시장은 운영 모델의 사내 관리가 점점 더 어려워짐에 따라 2031년까지 연평균 성장률(CAGR) 14.18%를 나타낼 것으로 예측됩니다. 멀티 CDN 연동, AI 모델 관리, 지속적인 라이브 운영으로 인해 대규모 전담 팀을 보유하지 않은 조직에게 전문가의 지원 가치가 높아지고 있습니다.
호스팅형 제품에 AI를 활용한 작업이 추가됨에 따라, 플랫폼 소프트웨어와 매니지드 서비스의 경계는 점차 모호해지고 있습니다. 이전에는 매니지드 서비스 팀이 담당하던 기능도 현재는 자동화된 라이브 운영 워크플로우에 통합할 수 있게 되었으며, 그 결과 개별 서비스 수익은 감소하는 반면 플랫폼 제공업체의 총 계약 가치는 증가하고 있습니다. 또한, GDPR(EU 개인정보보호규정) 요건과 각국에서 정비되고 있는 AI 거버넌스 프레임워크로 인해 컨텐츠 검토 및 분석 모듈을 평가하는 전문 서비스에 대한 수요도 발생하고 있습니다. 조직들이 전용 위성 또는 광섬유를 통한 전송 회선을 SRT나 RTMP를 활용한 IP 워크플로우로 대체함에 따라, 인제스트 및 캡처 기능에 집중된 투자가 진행되고 있습니다. 하모닉(Harmonic)은 2026년 NAB 쇼에서 AI 기반 오케스트레이션 및 인스트림 광고를 지원하는 서버 측 멀티뷰 기능 등 VOS360의 기능 강화를 발표했습니다.
2025년, 비디오 온 디맨드(VOD)는 비디오 전송 플랫폼 시장의 68.74%를 차지하고 있으며, 이는 전 세계 구독형 스트리밍 서비스의 축적된 라이브러리와 지속적인 오리진 및 CDN에 대한 수요를 반영한 것입니다. 이러한 대규모 도입 기반 덕분에, 상대적 점유율이 둔화되더라도 2031년까지 VOD는 절대적인 수익 측면에서 가장 큰 기여원으로 남을 것입니다. 유럽의 시청각 시장은 2024년 연평균 환율 기준으로 1,420억 유로(1,535억 달러) 규모를 기록했으며, 소비자의 스트리밍 지출은 720억 유로(779억 달러)를 넘어섰습니다. 이러한 온디맨드 시청 기반에 따라, 비디오 전송 플랫폼 시장 전체에서 오리진 용량, 스토리지 관리, 전송의 내결함성 및 재생 품질에 대한 지속적인 투자가 요구되고 있습니다. 각 제공업체는 캐시 효율성 향상, 다지역 오리진 복제, AV1 채택을 통해 일관된 품질을 유지하면서 트래픽 비용을 절감하고 있습니다.
라이브 비디오 전송은 스포츠 중계권, 기업 커뮤니케이션, 이러닝 및 라이브 소매 활동에 힘입어 2031년까지 연평균 성장률(CAGR) 14.55%를 나타낼 것으로 예측됩니다. 인터랙티브 광고 협회(IAB)는 라이브 스트리밍을 포함한 디지털 비디오에 대한 지출이 2026년에 전년 대비 11% 증가하여 TV 및 비디오에 대한 총 지출의 60%를 초과할 것으로 예측했습니다. 라이브 스트리밍 워크플로우에는 저지연 인제스트, 실시간 인코딩, 동적 컨텐츠 전달 설정 및 사전 캐싱이 불가능한 중복 장애 복구 경로가 필요합니다. 이러한 요구 사항으로 인해 라이브 스트리밍 운영은 기존 온디맨드 스트리밍을 통한 저장된 라이브러리 제공과는 다릅니다. Media over QUIC, 1초 미만의 패키징, 탄력적인 클라우드 버스트형 트랜스코딩을 갖춘 플랫폼은 엄격한 지연 시간 요건이 부과되는 계약을 수주하는 데 있어 더 유리한 입장에 있습니다.
지역별 분석
북미는 2025년 비디오 전송 플랫폼 시장 점유율의 37.68%를 차지했습니다. 이는 해당 지역의 하이퍼스케일 CDN 인프라 집중, 프리미엄 구독형 스트리밍 서비스, 스포츠 분야에 대한 투자, 그리고 기업용 비디오 도입이 뒷받침한 결과입니다. 스트리밍 제공업체들은 2026년에 스포츠 중계권에 142억 달러를 지출할 것으로 예상되며, 이로 인해 인제스트, 트랜스코딩, 오리진, 전송 각 계층의 용량 수요가 증가하고 있습니다. 주요 AWS, Akamai, Google Cloud의 데이터센터 네트워크는 지역 플랫폼에서 쉽게 이용할 수 있으며, 북미의 제공업체들은 Media over QUIC 전송, 서버 측 광고 삽입 및 기타 기능 중심의 전송 기능을 가장 먼저 도입하고 있습니다. 멕시코는 모바일에 중점을 둔 스트리밍 요금제와 미국과 연계 가능한 컨텐츠 권리 배분을 통해 시장을 확대되고 있습니다.
아시아태평양은 2031년까지 연평균 성장률(CAGR) 14.38%를 나타낼 것으로 예측되며, 인도와 동남아시아가 가장 큰 수요를 차지할 전망입니다. Jio Hotstar는 2027 회계연도 1분기에 월간 활성 사용자 수가 평균 5억 3,000만 명을 기록했습니다. IPL 2026 토너먼트에서는 디지털 시청자 수가 7억 명에 달했으며, 동시 접속 시청자 수는 최대 7,250만 명을 기록했습니다. 이로 인해 대규모 용량 계획이 필요해졌으며, 라이브 스트리밍 플랫폼에게는 어려운 환경이 조성되었습니다. 지역별 언어적·지리적 다양성은 현지화된 컨텐츠에 대한 수요, CDN 노드의 광범위한 커버리지, 그리고 모바일 시청에 최적화된 인코딩 프로파일에 대한 수요도 촉진하고 있습니다. AWS는 2026년 2월, Elemental Media Services를 아시아태평양의 말레이시아 리전으로 확장하여 방송 사업자가 동남아시아 시청자와 가까운 곳에서 비디오을 처리할 수 있도록 했습니다.
유럽은 대규모 시청각 경제와 소비자들의 스트리밍 이용이 정착되어 2025년 비디오 전송 플랫폼 시장에서 중요한 점유율을 차지했습니다. 서유럽의 스트리밍 지출 대부분은 독일, 영국, 프랑스, 이탈리아, 스페인이 차지하고 있지만, 동유럽 시장은 낮은 보급률 수준에서 성장을 이어가고 있습니다. Synamedia와 MoMe는 2026년 3월 ‘Synamedia Fluid EdgeCDN’을 통해 스페인 최초의 스트리밍 최적화 CDN 서비스를 시작했습니다. 이 서비스는 스페인 국내에서 저지연 비디오을 전송하는 동시에, 더 광범위한 유럽 시장을 대상으로 멀티 CDN 전송을 제공합니다. 중동 및 아프리카는 여전히 발전 초기 단계에 있으며, 디지털 미디어에 대한 투자가 새로운 수요를 창출하고 있습니다. 한편, 남미에서는 주요 스포츠 이벤트를 계기로 스트리밍 전송이 확대되면서 비디오 전송 플랫폼 시장으로의 트래픽이 증가하고 있습니다.
기타 혜택:
- 엑셀 형식 시장 예측(ME) 시트
- 3개월간의 애널리스트 지원
자주 묻는 질문
목차
제1장 서론
제2장 조사 방법
제3장 개요
제4장 시장 구도
제5장 시장 규모와 성장 예측
제6장 경쟁 구도
제7장 시장 기회와 향후 전망
JHS 26.09.01According to Mordor Intelligence, the video delivery platform market size is expected to increase from USD 4.78 billion in 2025 to USD 5.35 billion in 2026 and reach USD 10.12 billion by 2031, growing at a CAGR of 13.60% over 2026-2031.
This report is Segmented by Component (Platform, and Services), Streaming Type (Live Streaming, and Video On Demand Streaming), Revenue Model (Subscription Video On Demand (SVOD), Advertising Supported Streaming (AVOD), Hybrid Monetization, and More), End User (Media and Entertainment, E-Learning and Education, BFSI, and More), and Geography. The Market Forecasts are Provided in Terms of Value (USD).
Global Video Delivery Platform Market Trends and Insights
Monetized Live Sports and Event Streaming Drives Infrastructure Investment
Live sports and premium events are a central source of demand for the video delivery platform market, because rights holders need dependable capacity during short, concentrated audience peaks. Streaming services were projected to spend USD 14.2 billion on sports rights in 2026, compared with USD 13.2 billion in 2025. Amazon Prime Video was projected to account for USD 3.8 billion, or 27%, of streamer sports-rights spending in 2026. Each rights commitment requires ingest, transcoding, origin, and content delivery network capacity. Platforms must retain capacity during traffic peaks, even when events are infrequent. This can create an opportunity for providers to rent unused capacity through a content delivery network-as-a-service offering.
Rising Demand for Low-Latency Live Delivery Reshapes Protocol Standards
Viewer expectations have moved beyond the latency levels supported by conventional HTTP Adaptive Streaming, creating a clear upgrade need across the video delivery platform market. Media over QUIC entered commercial production deployment in May 2026, with BEAM Media Corp reporting sub-100 millisecond end-to-end latency for live streams across 210 countries. Oracle expanded its Video Edge architecture in 2026 to support relay deployment across third-party content delivery networks and internet service provider networks, using Media over QUIC for coordination. The protocol removes the fixed segment timing constraints of HLS and DASH. Its object-based transport approach supports quality adjustment at shorter intervals. This matters for interactive video and social commerce settings, where latency can affect audience participation and transaction completion.
Escalating Bandwidth, Transcoding, and Egress Costs Constrain Margin Expansion
Large-scale video delivery costs remain difficult for operators to control, and the video delivery platform market must address this pressure without weakening delivery quality. AWS CloudFront charged USD 0.085 per GB for the first 10 TB of monthly delivery traffic in 2026. Asia Pacific and South American egress rates were 2-4 times the North American baseline. The EU Data Act is expected to prohibit cloud switching and egress fees for in-scope providers serving EU customers from January 2027. The rule can alter supplier negotiations in Europe, but it does not resolve structural delivery costs elsewhere. Operators are using content-aware encoding, edge caching, and storage configurations that avoid egress charges to limit cost growth.
Other drivers and restraints analyzed in the detailed report include:
- AI-Driven Workflow Automation and Localization Improves Production Efficiency
- Multi-CDN and Edge Compute Expansion Reduces Latency and Delivery Risk
- Fragmented Device, Codec, and Player Compatibility Increases Engineering Overhead
For complete list of drivers and restraints, kindly check the Table Of Contents.
Segment Analysis
The Platform segment held 58.36% of the video delivery platform market share in 2025, encompassing ingest, capture, processing, encoding, transcoding, analytics, quality-of-experience monitoring, and content security. Enterprise buyers prefer unified vendor stacks because they reduce the integration work across the video workflow and provide clearer operational accountability. The Platform segment also concentrates on the technologies that shape delivery quality in the video delivery platform market, from contribution intake through playback protection and session monitoring. Services, including professional and managed services, are projected to grow at a CAGR of 14.18% through 2031 as operating models become more difficult to manage internally. Multi-CDN coordination, AI model management, and continuous live operations are increasing the value of expert support for organizations without large dedicated teams.
The line between platform software and managed services is becoming less clear as AI-enabled tasks are added to hosted products. Functions formerly handled by managed service teams can now be incorporated into automated live operations workflows, thereby reducing standalone service revenue while increasing the total contract value for the platform provider. GDPR requirements and emerging national AI governance frameworks also create demand for professional services that assess content moderation and analytics modules. Ingest and capture functions are receiving targeted investment as organizations replace dedicated satellite or fiber contribution links with IP workflows using SRT and RTMP. Harmonic presented VOS360 enhancements at the 2026 NAB Show, including AI-driven orchestration and a server-side multiview function that can work with in-stream advertising.
Video-on-Demand accounted for 68.74% of the video delivery platform market in 2025, reflecting the accumulated libraries and persistent origin and CDN requirements of global subscription streaming services. Its large installed base means that VOD will remain the largest absolute revenue contributor through 2031 even if its relative share moderates. The European audiovisual market generated EUR 142 billion (USD 153.5 billion) at the 2024 yearly average exchange rate, while consumer streaming expenditure exceeded EUR 72 billion (USD 77.9 billion). This base of on-demand viewing requires continuous investment in origin capacity, storage management, delivery resilience, and playback quality across the video delivery platform market. Providers are using cache efficiency, multi-region origin replication, and AV1 adoption to control traffic costs while maintaining consistent quality.
Live Video Streaming is projected to grow at a CAGR of 14.55% through 2031, supported by sports rights, corporate communication, e-learning, and live retail activity. The Interactive Advertising Bureau projected that digital video spending, including live streaming, would grow 11% year over year in 2026 and exceed 60% of total television and video spending. Live workflows require low-latency ingest, real-time encoding, dynamic content delivery configuration, and redundant failover paths that cannot be pre-cached. These requirements make live delivery operationally different from serving a stored library through conventional on-demand distribution. Platforms with Media over QUIC, sub-second packaging, and elastic cloud-burst transcoding are better positioned to win contracts with strict latency requirements.
Complete Report Scope:
- By Component
- Platform
- Ingest and Capture
- Processing, Encoding, and Transcoding
- Analytics and QoE Monitoring
- Content Security and DRM
- Services
- Professional Services
- Managed Services
- Platform
- By Streaming Type
- Live Video Streaming
- Video on Demand Streaming
- By Revenue Model
- Subscription Video on Demand (SVOD)
- Advertising Supported Streaming (AVOD)
- Transactional and Pay-Per-View (TVOD)
- Hybrid Monetization
- Freemium
- By End User
- Media and Entertainment
- E-Learning and Education
- BFSI
- Retail and E-commerce
- IT and Telecommunication
- Healthcare and Life Sciences
- Government and Public Sector
- Other End Users
- By Geography
- North America
- United States
- Canada
- Mexico
- South America
- Brazil
- Argentina
- Chile
- Rest of South America
- Europe
- Germany
- United Kingdom
- France
- Italy
- Spain
- Rest of Europe
- Asia-Pacific
- China
- Japan
- India
- South Korea
- Australia
- Rest of Asia-Pacific
- Middle East
- Saudi Arabia
- United Arab Emirates
- Qatar
- Rest of Middle East
- Africa
- South Africa
- Egypt
- Nigeria
- Rest of Africa
- North America
Geography Analysis
North America held 37.68% of the video delivery platform market share in 2025, supported by the region's large concentration of hyperscale CDN infrastructure, premium subscription streaming services, sports investment, and enterprise video deployments. Streaming providers were projected to spend USD 14.2 billion on sports rights in 2026, increasing the need for capacity across ingest, transcoding, origin, and delivery layers. Major AWS, Akamai, and Google Cloud data center networks are readily accessible to regional platforms, and North American providers are early adopters of Media over QUIC transport, server-side ad insertion, and other capability-led delivery functions. Mexico is expanding through mobile-focused streaming plans and content rights distribution that can be coordinated with the United States.
Asia Pacific is projected to grow at a CAGR of 14.38% through 2031, with India and Southeast Asia accounting for the highest demand. JioHotstar averaged 530 million monthly active users during the first quarter of fiscal year 2027. The IPL 2026 tournament reached 700 million digital viewers and recorded a peak concurrent stream of 72.5 million, requiring extensive capacity planning and creating a demanding environment for live delivery platforms. Regional linguistic and geographic diversity also supports demand for localized content, wider CDN node coverage, and encoding profiles optimized for mobile viewing. AWS expanded Elemental Media Services to the Asia Pacific Malaysia Region in February 2026, enabling broadcasters to process video closer to Southeast Asian audiences.
Europe had a meaningful share of the video delivery platform market in 2025 because of its large audiovisual economy and established consumer streaming activity. Germany, the United Kingdom, France, Italy, and Spain account for much of Western Europe's delivery spending, while Eastern European markets are growing from lower penetration levels. Synamedia and MoMe launched Spain's first streaming-optimized CDN service in March 2026 through Synamedia Fluid EdgeCDN. The service provides low-latency video in Spain and multi-CDN delivery for wider European markets. The Middle East and Africa remain earlier-stage areas where digital media investment is creating new demand, while South America adds traffic to the video delivery platform market as streaming distribution grows around major sports events.
- Amazon Web Services, Inc.
- Akamai Technologies, Inc.
- Microsoft Corporation
- Alphabet Inc.
- Cisco Systems, Inc.
- Kaltura, Inc.
- Brightcove Inc.
- Vimeo.com, Inc.
- Wowza Media Systems, LLC
- Synamedia Limited
- Haivision Inc.
- Bitmovin Inc.
- Comcast Technology Solutions, Inc.
- MediaKind
- Dacast Inc.
- JW Player, Inc.
- Panopto, Inc.
- Mux, Inc.
- Vbrick Systems, Inc.
- Vidyard, Inc.
- Amagi Media Labs Private Limited
- Ateme S.A.
Additional Benefits:
- The market estimate (ME) sheet in Excel format
- 3 months of analyst support
TABLE OF CONTENTS
1 INTRODUCTION
- 1.1 Study Assumptions and Market Definition
- 1.2 Scope of The Study
2 RESEARCH METHODOLOGY
3 EXECUTIVE SUMMARY
4 MARKET LANDSCAPE
- 4.1 Market Overview
- 4.2 Market Drivers
- 4.2.1 Rising Demand for Low-Latency Live Delivery
- 4.2.2 AI-Driven Workflow Automation and Localization
- 4.2.3 Multi-CDN and Edge Compute Expansion
- 4.2.4 Cloud-Native Delivery Reducing Infrastructure Burden
- 4.2.5 Monetized Live Sports and Event Streaming Growth
- 4.2.6 Content-Aware Network Optimization for Peak Traffic Events
- 4.3 Market Restraints
- 4.3.1 Escalating Bandwidth, Transcoding, and Egress Costs
- 4.3.2 Fragmented Device, Codec, and Player Compatibility
- 4.3.3 Rights, Privacy, and Data Residency Complexity
- 4.3.4 Inconsistent QoE in Emerging Network Environments
- 4.4 Industry Value Chain Analysis
- 4.5 Regulatory Landscape
- 4.6 Technological Outlook
- 4.7 Porter's Five Forces Analysis
- 4.7.1 Bargaining Power of Buyers
- 4.7.2 Bargaining Power of Suppliers
- 4.7.3 Threat of New Entrants
- 4.7.4 Threat of Substitutes
- 4.7.5 Intensity of Competitive Rivalry
- 4.8 Impact of Macroeconomic Factors on the Market
5 MARKET SIZE AND GROWTH FORECASTS (VALUE)
- 5.1 By Component
- 5.1.1 Platform
- 5.1.1.1 Ingest and Capture
- 5.1.1.2 Processing, Encoding, and Transcoding
- 5.1.1.3 Analytics and QoE Monitoring
- 5.1.1.4 Content Security and DRM
- 5.1.2 Services
- 5.1.2.1 Professional Services
- 5.1.2.2 Managed Services
- 5.1.1 Platform
- 5.2 By Streaming Type
- 5.2.1 Live Video Streaming
- 5.2.2 Video on Demand Streaming
- 5.3 By Revenue Model
- 5.3.1 Subscription Video on Demand (SVOD)
- 5.3.2 Advertising Supported Streaming (AVOD)
- 5.3.3 Transactional and Pay-Per-View (TVOD)
- 5.3.4 Hybrid Monetization
- 5.3.5 Freemium
- 5.4 By End User
- 5.4.1 Media and Entertainment
- 5.4.2 E-Learning and Education
- 5.4.3 BFSI
- 5.4.4 Retail and E-commerce
- 5.4.5 IT and Telecommunication
- 5.4.6 Healthcare and Life Sciences
- 5.4.7 Government and Public Sector
- 5.4.8 Other End Users
- 5.5 By Geography
- 5.5.1 North America
- 5.5.1.1 United States
- 5.5.1.2 Canada
- 5.5.1.3 Mexico
- 5.5.2 South America
- 5.5.2.1 Brazil
- 5.5.2.2 Argentina
- 5.5.2.3 Chile
- 5.5.2.4 Rest of South America
- 5.5.3 Europe
- 5.5.3.1 Germany
- 5.5.3.2 United Kingdom
- 5.5.3.3 France
- 5.5.3.4 Italy
- 5.5.3.5 Spain
- 5.5.3.6 Rest of Europe
- 5.5.4 Asia-Pacific
- 5.5.4.1 China
- 5.5.4.2 Japan
- 5.5.4.3 India
- 5.5.4.4 South Korea
- 5.5.4.5 Australia
- 5.5.4.6 Rest of Asia-Pacific
- 5.5.5 Middle East
- 5.5.5.1 Saudi Arabia
- 5.5.5.2 United Arab Emirates
- 5.5.5.3 Qatar
- 5.5.5.4 Rest of Middle East
- 5.5.6 Africa
- 5.5.6.1 South Africa
- 5.5.6.2 Egypt
- 5.5.6.3 Nigeria
- 5.5.6.4 Rest of Africa
- 5.5.1 North America
6 COMPETITIVE LANDSCAPE
- 6.1 Market Concentration
- 6.2 Strategic Moves
- 6.3 Vendor Positioning Analysis
- 6.4 Company Profiles (includes Global Level Overview, Market Level Overview, Core Segments, Financials as available, Strategic Information, Market Rank/Share, Products and Services, Recent Developments)
- 6.4.1 Amazon Web Services, Inc.
- 6.4.2 Akamai Technologies, Inc.
- 6.4.3 Microsoft Corporation
- 6.4.4 Alphabet Inc.
- 6.4.5 Cisco Systems, Inc.
- 6.4.6 Kaltura, Inc.
- 6.4.7 Brightcove Inc.
- 6.4.8 Vimeo.com, Inc.
- 6.4.9 Wowza Media Systems, LLC
- 6.4.10 Synamedia Limited
- 6.4.11 Haivision Inc.
- 6.4.12 Bitmovin Inc.
- 6.4.13 Comcast Technology Solutions, Inc.
- 6.4.14 MediaKind
- 6.4.15 Dacast Inc.
- 6.4.16 JW Player, Inc.
- 6.4.17 Panopto, Inc.
- 6.4.18 Mux, Inc.
- 6.4.19 Vbrick Systems, Inc.
- 6.4.20 Vidyard, Inc.
- 6.4.21 Amagi Media Labs Private Limited
- 6.4.22 Ateme S.A.
7 MARKET OPPORTUNITIES AND FUTURE OUTLOOK
- 7.1 White-Space and Unmet-Need Assessment