

|
시장보고서
상품코드
2119335
광대역 이용 경험 분석 : 시장 점유율 분석, 업계 동향 및 통계, 성장 예측(2026-2031년)Broadband Experience Analytics - Market Share Analysis, Industry Trends & Statistics, Growth Forecasts (2026 - 2031) |
||||||
 Mordor Intelligence
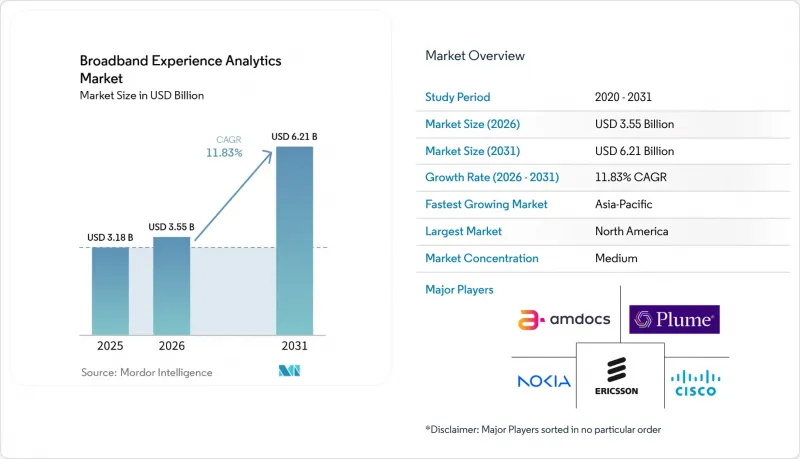
Mordor Intelligence에 의하면, 광대역 이용 경험 분석 시장 규모는 2025년 31억 8,000만 달러로 평가되었습니다. 2026년 35억 5,000만 달러에서 2031년까지 62억 1,000만 달러로 확대되며 2026년부터 2031년까지 연평균 성장률(CAGR)은 11.83%를 나타낼 전망입니다.
본 보고서는 분석 기능(고객 경험 분석 등), 도입 형태(클라우드, On-Premise), 구성 요소(소프트웨어, 서비스), 제공업체 유형(광대역 ISP, 통신 SP 등), 조직 규모(대기업, 중소기업), 용도(네트워크 성능 관리 등) 및 지역별로 분류되어 있습니다. 시장 전망은 금액(달러) 기준으로 제시되어 있습니다.
세계의 광대역 이용 경험 분석 시장 동향 및 인사이트
일관된 광대역 이용 경험에 대한 가입자의 기대감 고조
광대역 이용 경험 분석 시장에서 서비스 품질은 가입자 유지의 핵심 요소입니다. 광대역 제공업체는 액세스 네트워크, 용도, 가정 내 Wi-Fi 및 고객 지원 프로세스 전반에 걸친 성능을 보다 명확하게 파악해야 합니다. 유럽의 e-프라이버시 프레임워크에 따라, 통신 데이터를 처리하는 도입 환경에서는 프라이버시를 보호한 측정이 중요한 설계 요건이 되고 있습니다. 영국 정보위원회(ICO)는 트래픽 데이터에는 적절한 처리 관리가 필요하며, 그 목적에 필요한 기간을 초과하여 보유해서는 안 된다고 밝히고 있습니다. 이러한 요건으로 인해 광대역 이용 경험 분석 시장에서는 개인 데이터의 불필요한 보관을 의존하지 않고도 서비스상의 문제를 식별할 수 있는 플랫폼에 대한 수요가 증가하고 있습니다. 따라서 통신 사업자가 가입자 수준의 증거를 활용하여 지원 대응의 반복이나 타사로의 이탈로 이어지기 전에 장애를 해결함으로써, 광대역 이용 경험 분석 시장은 혜택을 받게 될 것입니다.
광섬유, 고정 무선 접속 및 멀티 기가비트 네트워크의 확대
광섬유, DOCSIS, 고정 무선 접속 및 저궤도 위성 서비스는 동일한 가구의 연결을 놓고 경쟁을 심화시키고 있습니다. 이러한 상황에서 사업자는 서로 다른 접속 방식 간의 성능을 비교해야 하므로, 단일 기술에 의한 모니터링의 유용성은 떨어집니다. 파이버 브로드밴드 협회(Fiber Broadband Association)의 보고서에 따르면, 연말까지 광섬유는 미국 내 많은 가정에 보급되어 상당수의 가구가 연결되었으며, 전국 보급률은 중간 수준에 도달했습니다. 세계 공급업체 협회(Global Supplier Association)의 보고서에 따르면, 2026년 4월 유럽, 중동 및 아프리카 전역에서 상용 5G 고정 무선 접속의 도입이 계속되고 있습니다. 이러한 네트워크 확장에 따라, 고객이 접속 기술을 전환할 때 지연, 지터,게이트웨이 동작, Wi-Fi 성능을 추적할 수 있는 시스템에 대한 수요가 광대역 이용 경험 분석 시장에서 증가하고 있습니다. 공급자가 용량 계획이나 기술 전환에 대한 의사결정에 필요한 근거를 모색할 때, 광대역 이용 경험 분석 시장의 중요성은 더욱 커집니다.
높은 도입 및 통합 비용
광대역 이용 경험 분석 시장의 도입 과정에서는 레거시 프로브, 딥 패킷 검사(DPI) 시스템, 클라우드 수집기, 그리고 여러 공급업체의 장비를 연동해야 합니다. 이로 인해 도입 일정이 장기화되고, 특히 대형 통신 사업자 그룹 이외의 업체에서는 총 소유 비용(TCO)이 증가할 가능성이 있습니다. 광섬유, DOCSIS, 고정 무선 액세스 각 계층에서 서로 다른 형식이나 상세도의 데이터가 생성되는 경우, 이 과제는 더욱 심각해집니다. 소규모 지역 통신 사업자의 경우, 맞춤형 인터페이스를 대규모로 관리할 수 있는 분석 엔지니어링 팀이 없는 경우가 있습니다. 관리형 서비스나 클라우드 기반 서비스를 통해 이러한 부담을 줄일 수는 있지만, 자체 운영 시스템에 비해 지속적인 비용이 높아질 가능성이 있습니다. 공급업체가 더 많은 기성 커넥터, 더 단순한 플랫폼, 그리고 운영 성과에 연동된 가격 정책을 제공하기 전까지는 광대역 이용 경험 분석 시장에 제약이 남아 있을 것입니다.
부문별 분석
2025년 기준, 고객 경험 분석(Customer Experience Analytics)은 시장 점유율의 31.28%를 차지했습니다. 통신 사업자들은 이 기능을 활용하여 네트워크 성능과 서비스 상호 작용, 청구 투명성, 지원 대응 속도, 고객 유지 위험을 상호 연관 짓고 있습니다. 이를 통해 팀은 불만이 해지나 공식적인 민원으로 발전하기 전에 이를 파악할 수 있습니다. 경험 품질(QoE) 분석 시장은 2031년까지 연평균 성장률(CAGR) 12.12%로 확대될 것으로 예측됩니다. 브로드밴드 포럼은 2025년 5월, 대역폭, 지연, 지터,패킷 손실에 관한 공통 경험 품질 매개변수 및 AI를 활용한 측정 프레임워크를 개발하기 위해 WT-524 프로젝트를 출범했습니다. 이 노력은 제공업체 간에 광대역 서비스의 품질을 보다 일관성 있게 평가할 수 있도록 지원합니다.
중국 내 FTTR 도입은 2025년까지 대폭 확대되었으며, 2026년에도 성장이 지속될 것으로 예측되어, 통신사가 모니터링해야 할 방 수, 기기 수, 게이트웨이 수가 증가하게 될 것입니다. 네트워크 성능 분석은 용량 계획에 정보를 제공하며, 서비스 보증 분석은 기업 및 공공 부문 연결에 대한 서비스 수준 계약(SLA) 모니터링을 지원합니다. 또한, 고객 경험 분석을 통해 서비스 및 지원 경험도 평가됩니다. 두 관점을 통합한 플랫폼은 네트워크 장애와 서비스 프로세스 문제를 구분하여, 보다 정확한 시정 조치를 지원합니다.
클라우드 도입은 2025년에 시장 점유율의 57.77%를 차지했으며, 2031년까지 연평균 성장률(CAGR) 12.24%로 확대될 것으로 전망됩니다. 통신 사업자들은 클라우드 플랫폼을 활용하여 지속적인 소프트웨어 제공을 지원하고, 트래픽 피크 시 확장하며, 어플라이언스 교체 주기에 의존하지 않고 AI 서비스를 이용하고 있습니다. 2026년 6월, 노키아와 Google Cloud는 2026년 9월 Google Cloud 마켓플레이스를 통해 ‘Nokia Assurance Center’를 SaaS 용도으로 제공할 계획을 발표했습니다. 이 서비스는 Google Distributed Cloud를 통한 On-Premise 배포도 지원하도록 설계되었습니다. 이러한 선택은 대규모이며 규제가 엄격한 통신 사업자 환경에서 유연성이 요구되고 있음을 반영합니다.
데이터 상주 요건으로 인해 가입자 데이터가 국내 인프라 외부로 이동하는 것이 제한되는 경우, On-Premise 배포는 여전히 유효합니다. 하이브리드 아키텍처에서는 데이터 수집을 네트워크 근처에 배치하면서, 선택된 컴퓨팅 워크로드를 클라우드로 이전합니다. 이러한 접근 방식을 통해 가입자 수준의 세부 정보를 유지하면서 원시 텔레메트리 데이터의 전송 비용을 절감할 수 있습니다. RADCOM은 2025년 10월 ‘High-Capacity User Analytics’ 솔루션을 발표하며, NVIDIA의 네트워크 플랫폼을 활용하여 단일 상용 서버에서 최대 400 Gbps의 데이터를 수집 및 분석할 수 있다고 밝혔습니다. 벤더가 클라우드 기반 현대화 목표와 데이터 상주 요건을 모두 충족할 수 있다면, 광대역 이용 경험 분석 시장은 그 혜택을 누리게 될 것입니다.
지역별 분석
2025년, 북미는 시장 점유율의 30.27%를 차지했습니다. 광섬유 네트워크의 과잉 구축, ISP 간의 치열한 경쟁, 그리고 성숙한 OSS 및 BSS 현대화 프로그램이 미국 및 캐나다 전역 수요를 뒷받침하고 있습니다. 파이버 브로드밴드 협회(Fiber Broadband Association)의 보고서에 따르면, 2025년 말까지 광섬유가 미국 내 8,460만 가구에 도달할 것으로 예측됩니다. 이러한 상황으로 인해 경쟁이 치열한 지역에서 사업을 전개하는 제공업체들에게 고객 유지와 서비스 차별화가 더욱 중요해지고 있습니다.
아시아태평양은 2031년까지 연평균 성장률(CAGR) 12.58%로 확대될 것으로 예측되며, 광대역 이용 경험 분석 시장에서 가장 빠르게 성장하는 지역이 될 전망입니다. 일본, 한국, 중국의 높은 광대역 가입자 수, 밀집된 FTTH(광섬유 직접 연결) 구축, 그리고 경험 품질(QoE) 보고 프로그램이 이러한 위상을 뒷받침하고 있습니다. 중국에서는 2025년에도 고정 광대역 가입자 기반이 계속 확대되었으며, 연말에는 FTTH 도입도 대폭 증가했습니다. SK 브로드밴드는 AI를 활용하여 IPTV의 이상 현상을 파악하고 해결하는 ‘AQUA’ 시스템을 도입하여, 연간 고객 불만 건수가 대폭 감소할 것으로 전망하고 있습니다. 이 시스템의 챗봇은 운영자를 거치지 않고 대부분의 문의에 대응했습니다.
유럽은 상세한 서비스 품질에 관한 규제와 네트워크 내결함성에 관한 의무가 있기 때문에 광대역 이용 경험 분석 시장에서 여전히 확고한 입지를 차지하고 있습니다. 독일, 영국, 프랑스는 대규모 광섬유 구축 프로그램과 품질 보고 체계가 분석 기술 도입을 뒷받침하고 있어 중요한 시장으로 자리 잡고 있습니다. 유럽 데이터 보호 위원회(EDPB)가 2025년에 추진할 가명화에 관한 노력은 규정 준수에 부합하는 가입자 데이터 처리를 위한 추가 지침을 제공할 것입니다. 중동, 특히 사우디아라비아와 아랍에미리트에서는 디지털 인프라 현대화에 분석 기술이 활용되고 있으며, 아프리카에서의 도입은 남아프리카공화국, 나이지리아, 이집트의 주요 모바일 광대역 제공업체에 집중되어 있습니다.
기타 혜택 :
- 엑셀 형식 시장 예측(ME) 시트
- 3개월간의 애널리스트 지원
자주 묻는 질문
목차
제1장 서론
제2장 조사 방법
제3장 개요
제4장 시장 구도
제5장 시장 규모 및 성장 예측
제6장 경쟁 구도
제7장 시장 기회 및 향후 전망
KTH 26.09.02According to Mordor Intelligence, the broadband experience analytics market size is projected to expand from USD 3.18 billion in 2025 and USD 3.55 billion in 2026 to USD 6.21 billion by 2031, registering a CAGR of 11.83% between 2026 to 2031.
This report is Segmented by Analytics Capability (Customer Experience Analytics, and More), Deployment (Cloud, and On-Premises), Component (Software, and Services), Provider Type (Broadband ISPs, Telecom SPs, and More), Organization Size (Large Operators, and SMEs), Application (Network Performance Management, and More), and Geography. The Market Forecasts are Provided in Terms of Value (USD).
Global Broadband Experience Analytics Market Trends and Insights
Rising Subscriber Expectations for Consistent Broadband Experience
Service quality has become central to subscriber retention in the broadband experience analytics market. Broadband providers need a clearer view of performance across the access network, applications, home Wi-Fi, and customer support journey. The European ePrivacy framework makes privacy-preserving measurement an important design requirement for deployments that process communications data. The UK Information Commissioner's Office states that traffic data requires suitable processing controls and should not be retained longer than necessary for its purpose. This requirement increases demand in the broadband experience analytics market for platforms that can identify service issues without relying on unnecessary retention of personal data. The broadband experience analytics market, therefore, benefits when operators use subscriber-level evidence to resolve faults before they lead to repeat support interactions or switching decisions.
Fiber, Fixed Wireless Access, and Multi-Gigabit Network Expansion
Fiber, DOCSIS, fixed wireless access, and low-earth-orbit satellite services increasingly compete for the same household connections. This mix makes single-technology monitoring less useful because operators need to compare performance across different access methods. The Fiber Broadband Association reported that fiber reached a broad base of U.S. homes by the end of the year, with a substantial number of households connected and a moderate national take rate. The Global Supplier Association reported continued commercial 5G fixed wireless access launches as of April 2026, with activity spanning Europe, the Middle East, and Africa. These network expansions create greater demand in the broadband experience analytics market for systems that can track latency, jitter, gateway behavior, and Wi-Fi performance as customers move between access technologies. The broadband experience analytics market gains importance when providers need evidence for capacity planning and technology migration decisions.
High Implementation and Integration Costs
Deployments in the broadband experience analytics market must connect legacy probes, deep packet inspection systems, cloud collectors, and equipment from several vendors. This work can extend delivery schedules and increase the total cost of ownership, particularly outside the largest operator group. The challenge becomes greater when fiber, DOCSIS, and fixed wireless access layers produce data in different formats and at different levels of detail. Smaller regional operators may not have analytics engineering teams that can manage custom interfaces at scale. Managed services and cloud-based delivery can reduce this burden, but they may carry a higher recurring cost than self-operated systems. The broadband experience analytics market faces a constraint until vendors provide more pre-built connectors, simpler platforms, and pricing tied to operational outcomes.
Other drivers and restraints analyzed in the detailed report include:
- AI-Enabled Predictive Network Assurance and Automated Remediation
- Broadband Churn Reduction and Customer Lifetime Value Optimization
- Data Privacy, Residency, and Consent Constraints
For complete list of drivers and restraints, kindly check the Table Of Contents.
Segment Analysis
Customer Experience Analytics held 31.28% of the share of the market in 2025. Operators use this capability to connect network performance with service interactions, billing clarity, support responsiveness, and retention risk. It helps teams identify dissatisfaction before it becomes a churn event or a public complaint. Quality of Experience Analytics is projected to expand at a 12.12% CAGR through 2031. The Broadband Forum launched the WT-524 project in May 2025 to develop common quality-of-experience parameters and AI-enhanced measurement frameworks for bandwidth, latency, jitter, and packet loss. This work supports a more consistent evaluation of broadband service quality across providers.
China's FTTR deployment is projected to expand significantly through 2025 and continue growing in 2026, increasing the number of rooms, devices, and gateways that providers must monitor. Network Performance Analytics provides inputs for capacity planning, while Service Assurance Analytics supports service-level agreement monitoring for business and public-sector connections. Customer Experience Analytics also assesses the service and support experience. Platforms that integrate both views can distinguish a network fault from a service-process issue and support more targeted remediation.
Cloud deployment accounted for 57.77% of the share of the market in 2025 and is projected to expand at a 12.24% CAGR through 2031. Operators use cloud platforms to support continuous software delivery, scale during traffic peaks, and use AI services without relying on appliance replacement cycles. In June 2026, Nokia and Google Cloud announced a plan to offer Nokia Assurance Center as a SaaS application through Google Cloud Marketplace in September 2026. The offering was also designed for on-premises deployment through Google Distributed Cloud. This choice reflects the need for flexibility in large and regulated operator environments.
On-premises deployment remains relevant where data residency requirements limit the movement of subscriber data outside the national infrastructure. Hybrid architecture places the collection close to the network while moving selected computing workloads to the cloud. This approach can reduce the cost of transferring raw telemetry while preserving subscriber-level detail. RADCOM introduced its High-Capacity User Analytics solution in October 2025, stating that it could capture and analyze up to 400 Gbps on a single commercial server using NVIDIA networking platforms. The broadband experience analytics market benefits when vendors can meet both cloud modernization goals and data-residency requirements.
Complete Report Scope:
- By Analytics Capability
- Customer Experience Analytics
- Network Performance Analytics
- Quality of Experience Analytics
- Service Assurance Analytics
- Others Analytics Capability
- By Deployment
- Cloud
- On-Premises
- By Component
- Software
- Services
- Consulting and Integration Services
- Managed Services
- Support and Maintenance Services
- By Provider Type
- Broadband Internet Service Providers
- Telecom Service Providers
- Cable Operators
- Managed Service Providers
- Government and Regulatory Agencies
- Enterprise Network Operators
- By Organization Size
- Large Operators
- Small and Medium-Sized Operators
- By Application
- Network Performance Management
- Fault Detection and Root-Cause Analysis
- Subscriber Experience Monitoring
- Home Wi-Fi and Connected Device Analytics
- Service-Level Agreement Monitoring
- Churn Prediction and Retention
- Other Applications
- By Geography
- North America
- United States
- Canada
- Mexico
- South America
- Brazil
- Argentina
- Chile
- Rest of South America
- Europe
- Germany
- United Kingdom
- France
- Italy
- Spain
- Russia
- Rest of Europe
- Asia-Pacific
- China
- India
- Japan
- South Korea
- Australia
- Indonesia
- Rest of Asia-Pacific
- Middle East
- Saudi Arabia
- United Arab Emirates
- Israel
- Turkey
- Rest of Middle East
- Africa
- South Africa
- Nigeria
- Egypt
- Kenya
- Rest of Africa
- North America
Geography Analysis
North America held 30.27% of the share of the market in 2025. Fiber overbuilds, intense ISP competition, and mature OSS and BSS modernization programs support demand across the United States and Canada. The Fiber Broadband Association reported that fiber is expected to pass 84.6 million U.S. homes by year-end 2025. These conditions make retention and service differentiation more important for providers operating in competitive areas.
Asia-Pacific is projected to expand at a 12.58% CAGR through 2031, making it the fastest-growing region in the broadband experience analytics market. High broadband subscriber numbers, dense FTTH deployment, and quality-of-experience reporting programs in Japan, South Korea, and China support this position. China's fixed broadband base continued to expand in 2025, while FTTR adoption also increased significantly by year-end. SK Broadband deployed its AQUA system to identify and resolve IPTV anomalies using AI, and expected annual customer complaints to decline substantially. The system's chatbot handled most inquiries without human agents.
Europe remains an established region for the broadband experience analytics market because of detailed service-quality rules and network resilience obligations. Germany, the United Kingdom, and France are important markets because large fiber deployment programs and quality-reporting frameworks support analytics adoption. The European Data Protection Board's 2025 work on pseudonymization adds further guidance for compliant subscriber-data processing. The Middle East, especially Saudi Arabia and the United Arab Emirates, is using analytics in digital infrastructure modernization, while African adoption is concentrated among major mobile broadband providers in South Africa, Nigeria, and Egypt.
- Nokia Corporation
- Cisco Systems, Inc.
- Telefonaktiebolaget LM Ericsson
- Amdocs Limited
- Huawei Technologies Co., Ltd.
- Plume Design, Inc.
- Calix, Inc.
- Broadcom Inc.
- RADCOM Ltd.
- Infovista S.A.S.
- Opensignal Limited
- Ookla LLC
- Anritsu Corporation
- Rohde & Schwarz GmbH & Co. KG
- EXFO Inc.
- VIAVI Solutions Inc.
- Sandvine Corporation
- NETSCOUT SYSTEMS, INC.
- Enghouse Systems Limited
- ASSIA, Inc.
- MedUX
- Epitiro Limited
- Accenture plc
Additional Benefits:
- The market estimate (ME) sheet in Excel format
- 3 months of analyst support
TABLE OF CONTENTS
1 INTRODUCTION
- 1.1 Study Assumptions and Market Definition
- 1.2 Scope of the Study
2 RESEARCH METHODOLOGY
3 EXECUTIVE SUMMARY
4 MARKET LANDSCAPE
- 4.1 Market Overview
- 4.2 Market Drivers
- 4.2.1 Rising Subscriber Expectations for Consistent Broadband Experience
- 4.2.2 Fiber, Fixed Wireless Access, and Multi-Gigabit Network Expansion
- 4.2.3 AI-Enabled Predictive Network Assurance and Automated Remediation
- 4.2.4 Broadband Churn Reduction and Customer Lifetime Value Optimization
- 4.2.5 Real-World Experience Benchmarking for Competitive Differentiation
- 4.2.6 Home Wi-Fi and In-Home Experience Visibility Gap
- 4.3 Market Restraints
- 4.3.1 High Implementation and Integration Costs
- 4.3.2 Data Privacy, Residency, and Consent Constraints
- 4.3.3 Fragmented Telemetry and Limited Broadband Experience Data Standards
- 4.3.4 Difficulty Demonstrating Short-Term Return on Experience Investments
- 4.4 Impact of Macroeconomic Factors on the Market
- 4.5 Industry Value Chain Analysis
- 4.6 Regulatory Landscape
- 4.7 Technological Outlook
- 4.8 Porter's Five Forces Analysis
- 4.8.1 Bargaining Power of Suppliers
- 4.8.2 Bargaining Power of Buyers
- 4.8.3 Threat of New Entrants
- 4.8.4 Threat of Substitutes
- 4.8.5 Competitive Rivalry
5 MARKET SIZE AND GROWTH FORECASTS (VALUE)
- 5.1 By Analytics Capability
- 5.1.1 Customer Experience Analytics
- 5.1.2 Network Performance Analytics
- 5.1.3 Quality of Experience Analytics
- 5.1.4 Service Assurance Analytics
- 5.1.5 Others Analytics Capability
- 5.2 By Deployment
- 5.2.1 Cloud
- 5.2.2 On-Premises
- 5.3 By Component
- 5.3.1 Software
- 5.3.2 Services
- 5.3.2.1 Consulting and Integration Services
- 5.3.2.2 Managed Services
- 5.3.2.3 Support and Maintenance Services
- 5.4 By Provider Type
- 5.4.1 Broadband Internet Service Providers
- 5.4.2 Telecom Service Providers
- 5.4.3 Cable Operators
- 5.4.4 Managed Service Providers
- 5.4.5 Government and Regulatory Agencies
- 5.4.6 Enterprise Network Operators
- 5.5 By Organization Size
- 5.5.1 Large Operators
- 5.5.2 Small and Medium-Sized Operators
- 5.6 By Application
- 5.6.1 Network Performance Management
- 5.6.2 Fault Detection and Root-Cause Analysis
- 5.6.3 Subscriber Experience Monitoring
- 5.6.4 Home Wi-Fi and Connected Device Analytics
- 5.6.5 Service-Level Agreement Monitoring
- 5.6.6 Churn Prediction and Retention
- 5.6.7 Other Applications
- 5.7 By Geography
- 5.7.1 North America
- 5.7.1.1 United States
- 5.7.1.2 Canada
- 5.7.1.3 Mexico
- 5.7.2 South America
- 5.7.2.1 Brazil
- 5.7.2.2 Argentina
- 5.7.2.3 Chile
- 5.7.2.4 Rest of South America
- 5.7.3 Europe
- 5.7.3.1 Germany
- 5.7.3.2 United Kingdom
- 5.7.3.3 France
- 5.7.3.4 Italy
- 5.7.3.5 Spain
- 5.7.3.6 Russia
- 5.7.3.7 Rest of Europe
- 5.7.4 Asia-Pacific
- 5.7.4.1 China
- 5.7.4.2 India
- 5.7.4.3 Japan
- 5.7.4.4 South Korea
- 5.7.4.5 Australia
- 5.7.4.6 Indonesia
- 5.7.4.7 Rest of Asia-Pacific
- 5.7.5 Middle East
- 5.7.5.1 Saudi Arabia
- 5.7.5.2 United Arab Emirates
- 5.7.5.3 Israel
- 5.7.5.4 Turkey
- 5.7.5.5 Rest of Middle East
- 5.7.6 Africa
- 5.7.6.1 South Africa
- 5.7.6.2 Nigeria
- 5.7.6.3 Egypt
- 5.7.6.4 Kenya
- 5.7.6.5 Rest of Africa
- 5.7.1 North America
6 COMPETITIVE LANDSCAPE
- 6.1 Market Concentration
- 6.2 Strategic Moves
- 6.2.1 Product Launches and Platform Enhancements
- 6.2.2 Partnerships and Ecosystem Integration
- 6.2.3 Acquisitions and Portfolio Expansion
- 6.2.4 Cloud-Native and AI Investment
- 6.3 Market Share Analysis
- 6.4 Company Profiles (includes Global Level Overview, Market Level Overview, Core Segments, Financials as available, Strategic Information, Market Rank/Share, Products and Services, Recent Developments)
- 6.4.1 Nokia Corporation
- 6.4.2 Cisco Systems, Inc.
- 6.4.3 Telefonaktiebolaget LM Ericsson
- 6.4.4 Amdocs Limited
- 6.4.5 Huawei Technologies Co., Ltd.
- 6.4.6 Plume Design, Inc.
- 6.4.7 Calix, Inc.
- 6.4.8 Broadcom Inc.
- 6.4.9 RADCOM Ltd.
- 6.4.10 Infovista S.A.S.
- 6.4.11 Opensignal Limited
- 6.4.12 Ookla LLC
- 6.4.13 Anritsu Corporation
- 6.4.14 Rohde & Schwarz GmbH & Co. KG
- 6.4.15 EXFO Inc.
- 6.4.16 VIAVI Solutions Inc.
- 6.4.17 Sandvine Corporation
- 6.4.18 NETSCOUT SYSTEMS, INC.
- 6.4.19 Enghouse Systems Limited
- 6.4.20 ASSIA, Inc.
- 6.4.21 MedUX
- 6.4.22 Epitiro Limited
- 6.4.23 Accenture plc
7 MARKET OPPORTUNITIES AND FUTURE OUTLOOK
- 7.1 White-Space and Unmet-Need Assessment


