

|
시장보고서
상품코드
2119726
미국의 데이터센터 서버 시장 : 점유율 분석, 업계 동향과 통계, 성장 예측(2026-2031년)United States Data Center Server - Market Share Analysis, Industry Trends & Statistics, Growth Forecasts (2026 - 2031) |
||||||
 Mordor Intelligence
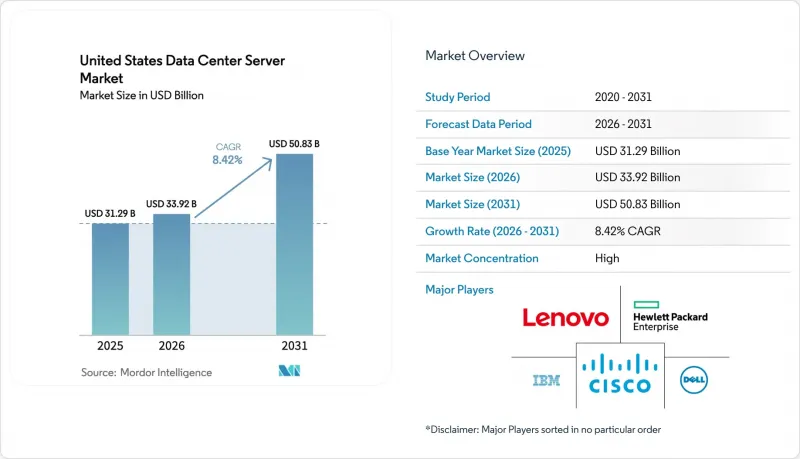
Mordor Intelligence에 의하면, 2026년 미국 데이터센터 서버 시장 규모는 339억 2,000만 달러로 추정되고 있어 2025년 312억 9,000만 달러에서 확대해, 2031년에는 508억 3,000만 달러에 이를 것으로 예측됩니다.
2026년부터 2031년까지의 연평균 성장률(CAGR)은 8.42%를 나타낼 전망입니다.
본 보고서에서는 업계를 ‘유형’(Tier 1, Tier 2 등), ‘폼 팩터’(하프 하이트 블레이드 등), ‘최종 사용자 산업’(은행, 금융서비스 및 보험(BFSI), 제조업 등),‘데이터센터 유형’(하이퍼스케일러/클라우드 서비스 제공업체 등), 그리고 ‘용도/워크로드’(가상화 및 프라이빗 클라우드, 스토리지 중심 등)별로 분류하고 있습니다. 시장 예측은 금액(미 달러) 기준으로 제시되어 있습니다.
미국 데이터센터 서버 시장 동향 및 인사이트
하이퍼스케일러의 자본 지출(CAPEX) 주기 급속한 갱신
아마존, 마이크로소프트, 구글, 메타는 2025년에 데이터센터에 총 3,200억 달러 이상을 투자할 계획이며, 각사가 AI 연산 밀도 향상을 추구하는 가운데 서버 교체 주기는 5년으로 연장될 전망입니다. 아마존의 1,000억 달러 투자만으로도 감가상각 가속화로 인해 7억 달러의 영업이익 감소 요인이 될 것으로 추정되지만, 한편으로는 첨단 수냉식 랙의 투자 회수 기간을 단축하는 결과로 이어집니다. 연방 정부 기관도 이러한 추세를 따르고 있으며, 에너지부 산하 16개 시설에서는 서버 고밀도화를 위한 건설이 우선적으로 진행되고 있어 2027년까지 가동이 시작될 것으로 예측됩니다. 이에 따라 버지니아주와 오리건주에서 수요 정점이 더욱 심화될 전망입니다.
기업 내 AI/ML 워크로드의 급증
금융 기관에 따르면, AI 인프라가 불충분할 경우 발생할 수 있는 치명적인 데이터 유출에 대해 경영진의 84%가 우려를 표명하고 있습니다. 은행 업계 모델의 정확도가 불과 21%에 그치고 있는 만큼, 벡터 처리 및 대용량 메모리를 지원하는 서버에 대한 투자가 촉진되고 있습니다. 의료 시스템에서는 진단 및 기록 관리에 AI를 활용하고 있으며, 이로 인해 랙 밀도가 최대 50kW까지 높아졌습니다. 제조 업계에서는 엣지 노드에서 인더스트리 4.0 용도를 도입하고, 5G와 마이크로 데이터센터의 폼 팩터를 결합하고 있습니다. 레노버의 ‘ThinkSystem V4’ 플랫폼은 랙 밀도를 2.5배, 와트당 성능을 2.4배 향상시켜, 회사의 효율화 목표를 뒷받침하고 있습니다.
사이버 침해 빈도 및 비용 증가
2024년 평균 침해 비용은 556만 달러에 달하며, 여기에 건당 다운타임 비용이 10만 달러를 초과함에 따라 총 소유 비용(TCO)은 더욱 높아지고 있습니다. 은행의 42%가 보안상의 우려로 인해 AI 워크로드를 퍼블릭 클라우드에서 이전하고 있으며, 이로 인해 On-Premise 환경이 확대되고, 조달 주기가 장기화되며, 자본 지출(CapEx)이 증가하고 있습니다. CloudNordic에서 발생한 고객 데이터 완전 소실과 같은 랜섬웨어 피해는 최악의 시나리오를 보여주는 사례로, 제로 트러스트 아키텍처 및 생체 인증을 통한 접근 제어의 보다 광범위한 도입을 촉구하고 있습니다.
부문 분석
2025년에는 Tier 3 시설이 매출의 65.70%를 차지하며 미국 데이터센터 서버 시장을 지탱했습니다. Tier 4는 규모는 작지만, 하이퍼스케일러 각사가 AI 훈련 클러스터를 완전한 내결함성 홀에 배치함에 따라 연평균 성장률(CAGR) 12.79%로 확대될 것으로 예측됩니다. 이러한 홀에서는 단일 장애가 발생하기만 해도 10만 달러 이상의 비용이 발생할 가능성이 있습니다. 2026년부터 2031년까지 미국 데이터센터 서버 시장 규모에서 Tier 4가 차지하는 비중은 급격히 확대될 것으로 예측됩니다. 2027년까지 랙당 50kW의 전력 밀도가 예상된다는 점을 감안하여, AI 지원 시설로 16곳을 지정하는 연방 정부의 프로그램에서는 티어 4 사양이 우선시되고 있습니다.
Tier 1 및 Tier 2 설계는 최대의 중복성보다 비용 효율성을 우선시하는 분산형 엣지 노드에서 여전히 중요한 역할을 하고 있습니다. 금융 서비스 업계의 Tier 4로의 전환 역시 규정 준수의 엄격화와 정보 유출에 대한 처벌 강화에 기인합니다. 전반적으로, 내결함성의 중요성이 티어 4를 가장 빠르게 성장하는 부문으로 확고히 자리매김하게 했으며, 코로케이션 업그레이드 로드맵을 재구성하는 동시에 액체 냉각으로의 개조를 주도하고 있습니다.
하프 하이트 블레이드는 가상화 워크로드 수요를 배경으로 2025년에도 48.54%의 시장 점유율을 유지했습니다. 한편, 사업자들이 랙을 20피트 에지 모듈로 통합함에 따라 쿼터 하이트 마이크로 블레이드는 연평균 성장률(CAGR) 13.87%로 시장 점유율을 확대되고 있습니다. 따라서 미국 내 마이크로 블레이드 도입 데이터센터 서버 시장 규모는 2031년까지 상승 추세를 보일 전망입니다. EdgeMicro의 도심 지역 도입 사례와 제조업 분야의 인더스트리 4.0 시범 프로젝트는 콤팩트하고 에너지 효율이 뛰어난 하드웨어로의 전환을 여실히 보여주고 있습니다.
풀 하이트 블레이드는 여전히 HPC 클러스터에 사용되고 있지만, 랙당 전력 제한으로 인해 직접 투 칩(Direct-to-Chip) 액체 냉각과 결합된 마이크로블레이드가 점점 더 유리해지고 있습니다. 각 하이퍼스케일러 기업들은 AI 추론 노드를 위해 마이크로 블레이드 플랫폼을 선택적으로 채택하며, 밀도와 메모리 대역폭 요구 사항 간의 균형을 맞추고 있습니다.
기타 혜택:
- 엑셀 형식 시장 예측(ME) 시트
- 3개월간의 애널리스트 지원
자주 묻는 질문
목차
제1장 서론
제2장 조사 방법
제3장 개요
제4장 시장 구도
제5장 시장 규모와 성장 예측
제6장 경쟁 구도
제7장 시장 기회와 향후 전망
JHS 26.09.03According to Mordor Intelligence, the United States data center server market size in 2026 is estimated at USD 33.92 billion, growing from 2025 value of USD 31.29 billion with 2031 projections showing USD 50.83 billion, growing at 8.42% CAGR over 2026-2031.
This report Segments the Industry Into Type (Tier 1, Tier 2, and More), Form Factor(Half-Height Blades, and More), End-User Verticals (BFSI, Manufacturing, and More), Data Center Type(Hyperscalers/Cloud Service Provider, and More) and by Application / Workload (Virtualisation and Private Cloud, Storage-Centric and More). The Market Forecasts are Provided in Terms of Value (USD).
United States Data Center Server Market Trends and Insights
Rapid hyperscaler CAPEX cycle renewal
Amazon, Microsoft, Google, and Meta collectively plan to spend more than USD 320 billion on data centers in 2025, extending server replacement cycles to five years as firms pursue AI compute density. Amazon's USD 100 billion allocation alone is estimated to add a USD 700 million operating-income drag due to accelerated depreciation, yet it shortens payback periods for advanced liquid-cooled racks. Federal agencies are mirroring the trend; sixteen Department of Energy sites have been fast-tracked for server-dense builds, with online availability expected by 2027, reinforcing demand peaks in Virginia and Oregon.
Enterprise AI/ML workload proliferation
Financial institutions cite an 84% concern among executives over catastrophic data loss if AI infrastructure falls short. Accuracy levels of only 21% in banking models spur investment in servers optimized for vector processing and larger memory footprints. Healthcare systems leverage AI for diagnostics and documentation, driving rack densities up to 50 kW. Manufacturing groups are adopting Industry 4.0 applications on edge nodes, combining 5G and micro-data center form factors. Lenovo's ThinkSystem V4 platform achieves 2.5X rack density and 2.4X performance-per-watt gains, underscoring its efficiency goals.
Rising frequency and cost of cyber-intrusions
Average breach costs of USD 5.56 million in 2024, combined with downtime expenses exceeding USD 100,000 per event, elevate the total cost of ownership. Forty-two percent of banks have migrated AI workloads away from public clouds due to security concerns, prompting on-premises build-outs that lengthen procurement cycles and increase CapEx. Ransomware events, such as CloudNordic's total customer data loss, illustrate worst-case scenarios compelling wider adoption of zero-trust architectures and biometric access controls.
Other drivers and restraints analyzed in the detailed report include:
- Edge-cloud convergence boosting micro-server demand
- Government incentives for domestic semiconductor manufacturing
- Supply-chain volatility for key silicon (HBM, GPUs)
For complete list of drivers and restraints, kindly check the Table Of Contents.
Segment Analysis
Tier 3 installations delivered 65.70% of revenue in 2025, anchoring the United States data center server market. Tier 4, though smaller, is projected to rise at 12.79% CAGR as hyperscalers assign AI training clusters to fully fault-tolerant halls where a single outage can cost over USD 100,000. The United States data center server market size contribution from Tier 4 is projected to grow steeply between 2026 and 2031. Federal programs that earmark sixteen sites for AI-ready builds favor Tier 4 specifications, given 50 kW-per-rack power densities anticipated by 2027.
Tier 1 and Tier 2 designs remain relevant for distributed edge nodes prioritizing cost efficiency over maximum redundancy. Financial-services migration toward Tier 4 also stems from stricter compliance and rising breach penalties. Altogether, the resilience imperative cements Tier 4 as the fastest-moving slice, reshaping colocation upgrade roadmaps and guiding liquid-cooling retrofits.
Half-height blades retained 48.54% market share in 2025 on the strength of virtualization workloads. Yet quarter-height micro-blades are climbing at 13.87% CAGR as operators compress racks into 20-foot edge modules. The United States data center server market size for micro-blade deployments is thus on an upward trajectory through 2031. EdgeMicro's city-center installs and manufacturing-sector Industry 4.0 pilots highlight the swing toward compact, energy-efficient hardware.
Full-height blades continue serving HPC clusters, but power-per-rack limits increasingly favor micro-blades paired with direct-to-chip liquid cooling. Hyperscalers are selectively adopting micro-blade platforms for AI inference nodes, balancing density against memory bandwidth needs.
Complete Report Scope:
- By Data-Center Tier
- Tier 1 and 2
- Tier 3
- Tier 4
- By Form Factor
- Half-height Blades
- Full-height Blades
- Quarter-height / Micro-blades
- By Application / Workload
- Virtualisation and Private Cloud
- High-Performance Computing (HPC)
- Artificial Intelligence/Machine Learning and Data Analytics
- Storage-centric
- Edge / IoT Gateways
- By Data Center Type
- Hyperscalers/Cloud Service Provider
- Colocation Facilities
- Enterprise and Edge
- By End-use Industry
- BFSI
- IT and Telecom
- Healthcare and Life-Sciences
- Manufacturing and Industry 4.0
- Energy and Utilities
- Government and Defence
List of Companies Covered in this Report:
- Dell Technologies Inc.
- Hewlett Packard Enterprise Company
- Lenovo Group Limited
- International Business Machines Corporation
- Cisco Systems, Inc.
- Super Micro Computer, Inc.
- Inspur Electronic Information Industry Co., Ltd.
- Quanta Computer Inc.
- Huawei Technologies Co., Ltd.
- Kingston Technology Company, Inc.
- Amazon Web Services, Inc.
- NVIDIA Corporation
- Ampere Computing LLC
- ASUSTeK Computer Inc.
- Giga-byte Technology Co., Ltd.
- Foxconn Technology Group (Hon Hai Precision)
- Equinix, Inc. (Server designs for xScale)
- Penguin Computing, Inc.
- Celestica Inc.
- MiTAC Holdings Corporation (Tyan)
- OVH US LLC
Additional Benefits:
- The market estimate (ME) sheet in Excel format
- 3 months of analyst support
TABLE OF CONTENTS
1 INTRODUCTION
- 1.1 Study Assumptions and Market Definition
- 1.2 Scope of the Study
2 RESEARCH METHODOLOGY
3 EXECUTIVE SUMMARY
4 MARKET LANDSCAPE
- 4.1 Market Overview
- 4.2 Market Drivers
- 4.2.1 Rapid hyperscaler CAPEX cycle renewal
- 4.2.2 Enterprise AI/ML workload proliferation
- 4.2.3 Edge-cloud convergence boosting micro-server demand
- 4.2.4 Government incentives for domestic semiconductor/Server manufacturing
- 4.2.5 U.S. power-availability contracts favor liquid-cool-ready racks
- 4.2.6 Tier-2 city tax abatements attracting second-wave data-center builds
- 4.3 Market Restraints
- 4.3.1 Rising frequency and cost of cyber-intrusions
- 4.3.2 Supply-chain volatility for key silicon (HBM, GPUs)
- 4.3.3 Grid-interconnection delays exceeding 24-months in PJM and MISO
- 4.3.4 New EPA ENERGY STAR v4 idle-power caps constraining legacy refresh
- 4.4 Industry Value Chain Analysis
- 4.5 Regulatory Landscape
- 4.6 Technological Outlook
- 4.7 Porter's Five Forces
- 4.7.1 Threat of New Entrants
- 4.7.2 Bargaining Power of Buyers
- 4.7.3 Bargaining Power of Suppliers
- 4.7.4 Threat of Substitutes
- 4.7.5 Intensity of Competitive Rivalry
- 4.8 Assessment of the Impact on Macro Economic Trends on the Market
5 MARKET SIZE AND GROWTH FORECASTS (VALUES)
- 5.1 By Data-Center Tier
- 5.1.1 Tier 1 and 2
- 5.1.2 Tier 3
- 5.1.3 Tier 4
- 5.2 By Form Factor
- 5.2.1 Half-height Blades
- 5.2.2 Full-height Blades
- 5.2.3 Quarter-height / Micro-blades
- 5.3 By Application / Workload
- 5.3.1 Virtualisation and Private Cloud
- 5.3.2 High-Performance Computing (HPC)
- 5.3.3 Artificial Intelligence/Machine Learning and Data Analytics
- 5.3.4 Storage-centric
- 5.3.5 Edge / IoT Gateways
- 5.4 By Data Center Type
- 5.4.1 Hyperscalers/Cloud Service Provider
- 5.4.2 Colocation Facilities
- 5.4.3 Enterprise and Edge
- 5.5 By End-use Industry
- 5.5.1 BFSI
- 5.5.2 IT and Telecom
- 5.5.3 Healthcare and Life-Sciences
- 5.5.4 Manufacturing and Industry 4.0
- 5.5.5 Energy and Utilities
- 5.5.6 Government and Defence
6 COMPETITIVE LANDSCAPE
- 6.1 Market Concentration
- 6.2 Strategic Moves
- 6.3 Market Share Analysis
- 6.4 Company Profiles (includes Global level Overview, Market level overview, Core Segments, Financials as available, Strategic Information, Market Rank/Share, Products and Services, Recent Developments)
- 6.4.1 Dell Technologies Inc.
- 6.4.2 Hewlett Packard Enterprise Company
- 6.4.3 Lenovo Group Limited
- 6.4.4 International Business Machines Corporation
- 6.4.5 Cisco Systems, Inc.
- 6.4.6 Super Micro Computer, Inc.
- 6.4.7 Inspur Electronic Information Industry Co., Ltd.
- 6.4.8 Quanta Computer Inc.
- 6.4.9 Huawei Technologies Co., Ltd.
- 6.4.10 Kingston Technology Company, Inc.
- 6.4.11 Amazon Web Services, Inc.
- 6.4.12 NVIDIA Corporation
- 6.4.13 Ampere Computing LLC
- 6.4.14 ASUSTeK Computer Inc.
- 6.4.15 Giga-byte Technology Co., Ltd.
- 6.4.16 Foxconn Technology Group (Hon Hai Precision)
- 6.4.17 Equinix, Inc. (Server designs for xScale)
- 6.4.18 Penguin Computing, Inc.
- 6.4.19 Celestica Inc.
- 6.4.20 MiTAC Holdings Corporation (Tyan)
- 6.4.21 OVH US LLC
7 MARKET OPPORTUNITIES AND FUTURE OUTLOOK
- 7.1 White-space and Unmet-need Assessment


