

|
시장보고서
상품코드
2119752
북미의 데이터센터 서버 시장 : 점유율 분석, 업계 동향과 통계, 성장 예측(2026-2031년)North America Data Center Server - Market Share Analysis, Industry Trends & Statistics, Growth Forecasts (2026 - 2031) |
||||||
 Mordor Intelligence
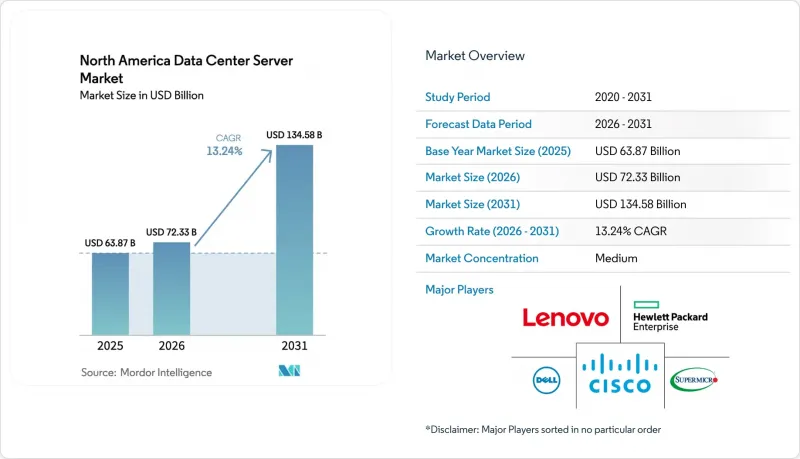
Mordor Intelligence에 의하면, 북미의 데이터센터 서버 시장 규모는 2025년 638억 7,000만 달러에서 2026년에는 723억 3,000만 달러로 확대되어 2026년부터 2031년까지 CAGR 13.24%로 성장을 지속하여, 2031년에는 1,345억 8,000만 달러에 이를 것으로 예측됩니다.
본 보고서에서는 업계를 ‘유형’(Tier 1, Tier 2 등), ‘폼 팩터’(하프 하이 블레이드 등), ‘최종 사용자 산업’(은행, 금융서비스 및 보험(BFSI), 제조업 등),‘데이터센터 유형’(하이퍼스케일러/클라우드 서비스 제공업체 등), 그리고 ‘용도/워크로드’(가상화 및 프라이빗 클라우드, 스토리지 중심 등)별로 분류하고 있습니다. 시장 예측은 금액(달러) 기준으로 제시되어 있습니다.
북미 데이터센터 서버 시장 동향 및 인사이트
GPU 고밀도 서버에 대한 AI/ML 훈련 수요
인공지능(AI) 워크로드는 이미 데이터센터 전력 소비량의 최대 5분의 1을 차지하고 있으며, 사업자들은 초고밀도화 및 코어 사이트에서의 액체 냉각에 대응하기 위해 랙을 교체해야 할 시점에 직면해 있습니다. NVIDIA가 예측한 1조 4,000억 달러 규모의 데이터센터 시장 기회에 힘입어, 섀시당 최대 8장의 GPU를 탑재할 수 있는 전용 서버의 조달이 가속화되고 있습니다. Super Micro사의 10만 장의 GPU를 탑재한 액체 냉각 클러스터는 시장이 직접 쿨링 아키텍처로 전환되고 있음을 보여줍니다. X사가 HPE에 10억 달러 규모의 주문을 한 것은 대규모 민간 구매자가 단일 거래 규모 측면에서 하이퍼스케일러와 어깨를 나란히 하게 되었음을 보여줍니다. 이러한 변화로 인해 고밀도 AI 랙은 북미 데이터센터 서버 시장의 주요 성장 동력으로 확고한 입지를 다지고 있습니다.
상용 5G의 확산이 엣지 인프라 확충을 주도
초저지연 5G 서비스로 인해 컴퓨팅 리소스는 코어 캠퍼스에서 최종 사용자와의 왕복 지연 시간이 한 자릿수 밀리초 이내인 대도시권의 엣지 사이트로 이동하고 있습니다. Cologix Toronto와 같은 마이크로 코로케이션 허브 내에서 시작된 ‘GPU-as-a-Service’는 향후 AI 추론이 점점 더 엣지로 배치될 것임을 뒷받침하고 있습니다. 이에 대응하여 서버 OEM 업체들은 얕은 랙이나 제한된 설치 공간에 맞추어 최적화된 쿼터 하이트 및 기타 마이크로 블레이드 설계 제품을 출시하고 있습니다. 이러한 분산형 토폴로지는 안정적인 전력 공급과 통행권 허가를 보장할 수 있는 지역의 광섬유 사업자 및 지방 자치 단체의 유틸리티자에게 새로운 수익원을 제공합니다. 이러한 추세로 인해 북미 데이터센터 서버 시장 전체에서 엣지 시스템의 두 자릿수 성장이 지속되고 있습니다.
데이터센터 설비 투자(CapEx) 및 토지 비용의 급등
라우던 카운티와 산타클라라 카운티에서 발생한 투기성 부동산 입찰로 인해 18개월 만에 부지 가격이 2배로 치솟았으며, 그린필드 프로젝트의 예산은 당초 예상치를 크게 웃도는 수준으로 부풀어 올랐습니다. AI 서버에 필요한 수냉 루프와 고전류 버스웨이를 포함하면 건설 비용은 더욱 상승합니다. 마이크로소프트와 아마존은 수요가 여전히 견조함에도 불구하고, 계획했던 여러 부지 건설을 연기하고 더 저렴한 토지를 확보할 수 있는 2차 지역으로 자본을 재분배하기로 결정했습니다. 고착화된 토지 프리미엄은 임대료로 전가되어, 소규모 신규 진출기업의 확장을 지연시킬 가능성이 있습니다. 허가 절차의 신속화나 용도 변경을 통해 새로운 부지가 확보되지 않는 한, 북미 데이터센터·서버 시장에서는 주기적인 공급 부족이 발생할 가능성이 있습니다.
부문 분석
북미 데이터센터 서버 시장에서 2025년 매출의 74.60%를 Tier 3 시설이 차지하고 있으며, 2N 아키텍처의 높은 비용 부담 없이 N+1의 내결함성을 필요로 하는 엔터프라이즈 워크로드에 있어 그 매력이 두드러집니다. Tier 3의 건설 사양은 우수한 운영 경제성을 유지하면서 대부분의 가상화, 백업, 클라우드 게이트웨이 작업을 처리할 수 있습니다. 그러나 수조 개의 매개변수를 가진 모델을 학습시키는 하이퍼스케일러 기업들은 현재, 수,000만 달러 규모의 GPU 클러스터를 중단 없이 가동하기 위해 병렬 유지보수와 내결함성이 필수적인 Tier 4 환경을 중시하고 있습니다. 그 결과, Tier 4 매출은 2031년까지 연평균 성장률(CAGR) 18.56%로 증가할 것으로 예측되며, 북미 데이터센터 서버 시장 규모에서 차지하는 비중도 점차 높아질 것으로 보입니다.
Tier 4의 급속한 성장은 리튬 이온 UPS, 후면 도어식 열교환기, 중복화된 스파인-리프 패브릭을 사전에 구성한 모듈형 데이터 홀의 혁신을 촉진하고 있습니다. Vertiv와 같은 벤더들은 최근 공장에서 통합된 ‘360AI’ 블록을 도입하여 구축 기간을 26주 미만으로 단축함으로써, 기존의 그린필드 건설 일정보다 수개월을 단축하고 있습니다. 한편, Tier 1 및 Tier 2 데이터센터는 컨텐츠 캐싱, 로컬 제조 실행 시스템 및 기타 엣지 기능에서 여전히 유용합니다. 예측 기간 동안 여러 티어가 공존함으로써 워크로드 배치의 유연성이 향상되고, 북미 데이터센터 서버 시장 내에서 다양한 수익원이 유지될 것입니다.
2025년에는 기업들이 연산 밀도와 기류 요구 사항의 균형이 잘 잡힌 익숙한 42U 랙을 계속 선호함에 따라 하프 하이 블레이드가 61.55%라는 압도적인 점유율을 차지했습니다. 이 설계는 적당한 전력 소비량과 결합된 2소켓 x86 보드를 지원하여 냉각 시스템 개조를 최소화합니다. 그러나 IoT 및 5G 워크로드로 인한 엣지 인프라 확충에 힘입어, 마이크로 블레이드 및 쿼터 하이트 시스템의 북미 데이터센터 서버 시장 규모는 연평균 성장률(CAGR) 17.92%로 가장 빠르게 성장할 것으로 예측됩니다.
쿼터 하이트 프레임은 공간이나 무게에 제약이 있는 통신 사업자의 스트리트 캐비닛이나 공장의 클로젯에도 설치할 수 있습니다. 시스템 온 칩(SoC) 아키텍처와 PCIe Gen5의 발전으로 인해, 벤더들은 이러한 소형 스레드에 AI 가속기를 통합할 수 있게 되었으며, 이는 실시간 추론에 활용되고 있습니다. 풀 하이트 블레이드는 HPC 및 석유 및 가스 업계의 지진 탐사 이미지 처리 분야에서 계속해서 활용되고 있지만, 그 성장세가 둔화되고 있는 것은 더 소형이고 전력 효율이 뛰어난 노드로의 전환이 진행되고 있음을 나타냅니다. 그 결과, 사업자는 코어 부분에 고밀도 AI 훈련 랙을 배치하고, 메트로 링에는 경량 마이크로 블레이드를 조합할 수 있는 등 포트폴리오의 폭이 넓어지며, 북미 데이터센터 서버 시장 전체의 가치 제안이 더욱 풍부해질 것입니다.
기타 혜택:
- 엑셀 형식 시장 예측(ME) 시트
- 3개월간의 애널리스트 지원
자주 묻는 질문
목차
제1장 서론
제2장 조사 방법
제3장 개요
제4장 시장 구도
제5장 시장 규모와 성장 예측
제6장 경쟁 구도
제7장 시장 기회와 향후 전망
JHS 26.09.03According to Mordor Intelligence, the North America data center server market size is expected to grow from USD 63.87 billion in 2025 to USD 72.33 billion in 2026 and is forecast to reach USD 134.58 billion by 2031 at 13.24% CAGR over 2026-2031.
This report Segments the Industry Into Type (Tier 1, Tier 2, and More), Form Factor(Half-Height Blades, and More), End-User Verticals (BFSI, Manufacturing, and More), Data Center Type(Hyperscalers/Cloud Service Provider, and More) and by Application / Workload (Virtualisation and Private Cloud, Storage-Centric and More). The Market Forecasts are Provided in Terms of Value (USD).
North America Data Center Server Market Trends and Insights
AI/ML Training Demand for GPU-Dense Servers
Artificial-intelligence workloads already consume up to one-fifth of data-center electricity, forcing operators to revamp racks for extreme densities and liquid cooling coresite. NVIDIA's US 1.4 trillion data-center opportunity projection has accelerated procurement of specialized servers that can host as many as eight GPUs per chassis. Super Micro's 100,000-GPU liquid-cooled cluster illustrates the market's pivot toward direct-cooling architectures. HPE's USD 1 billion order from X signals that large private buyers now rival hyperscalers on single-deal size. These shifts cement high-density AI racks as the primary growth engine for the North America data center server market.
Commercial 5G Roll-outs Driving Edge Build-outs
Ultra-low-latency 5G services are steering compute away from core campuses toward metropolitan edge sites that sit within a one-digit-millisecond round-trip of end users. GPU-as-a-service launches inside micro-colo hubs such as Cologix Toronto provide proof that AI inference will increasingly reside at the edge. Server OEMs have responded by releasing quarter-height and other micro-blade designs tuned for shallow racks and constrained footprints. This distributed topology unlocks new revenue for regional fiber operators and municipal utilities that can guarantee clean power and right-of-way permits. The trend sustains a double-digit expansion streak for edge systems within the broader North America data center server market.
Escalating Data-Center CapEx and Land Costs
Speculative real-estate bidding in Loudoun County and Santa Clara has doubled parcel prices within 18 months, inflating greenfield project budgets well above earlier pro-formas. Build costs rise further when liquid-cooling loops and high-amp busways required by AI servers are included. Microsoft and Amazon have slowed several planned sites, choosing to redeploy capital to secondary regions with cheaper acreage while demand remains intact. Locked-in land premiums cascade through lease rates, potentially delaying smaller entrants' expansion. Unless permitting fast-tracks or rezoning unlocks fresh parcels, the North America data center server market could experience periodic supply gaps.
Other drivers and restraints analyzed in the detailed report include:
- Rising Adoption of Cloud and IoT Workloads
- Data-Sovereignty Mandates in Canada and Mexico
- Grid-Power Constraints in Key Metros
For complete list of drivers and restraints, kindly check the Table Of Contents.
Segment Analysis
Tier 3 facilities captured 74.60% of 2025 revenue in the North America data center server market, underscoring their appeal for enterprise workloads requiring N+1 resilience without the premium of 2N architectures. Tier 3 build specifications satisfy most virtualization, backup and cloud-gateway tasks while retaining favorable operating economics. Yet hyperscalers training multi-trillion-parameter models now prize Tier 4 environments where concurrent maintenance and fault tolerance are mandatory for uninterrupted GPU clusters that cost tens of millions of USD. As a result, Tier 4 revenue is projected to rise 18.56% CAGR through 2031, gradually lifting its North America data center server market size contribution.
The Tier 4 surge has spurred innovations in modular data halls pre-configured with lithium-ion UPS, rear-door heat exchangers and redundant spine-leaf fabrics. Vendors such as Vertiv recently introduced factory-integrated "360AI" blocks that shorten deployment to under 26 weeks, shaving months off customary greenfield schedules. Meanwhile, Tier 1 and Tier 2 camps remain useful for content caching, local manufacturing execution systems and other edge roles. Over the forecast window, the coexistence of multiple tiers improves workload placement flexibility, sustaining diverse revenue streams inside the North America data center server market.
Half-height blades held a commanding 61.55% share in 2025 as enterprises continue to favor familiar 42-U racks that balance compute density with airflow requirements. The design supports two-socket x86 boards paired with modest power budgets, keeping cooling retrofits minimal. However, the North America data center server market size for micro-blade and quarter-height systems is projected to grow fastest at 17.92% CAGR, propelled by the edge build-out associated with IoT and 5G workloads.
Quarter-height frames can slip into telco street cabinets or factory closets where space and weight are constrained. Advancements in system-on-chip architecture and PCIe Gen5 have allowed vendors to embed AI accelerators onto these compact sleds, making them useful for real-time inference. Full-height blades continue to serve HPC and oil-and-gas seismic imaging, yet their marginal growth underscores a pivot toward smaller, power-efficient nodes. The net effect is an expanding portfolio that lets operators mix dense AI training racks at the core with lightweight micro-blades in metro rings, enriching the overall value proposition of the North America data center server market.
Complete Report Scope:
- By Data-Center Tier
- Tier 1 and 2
- Tier 3
- Tier 4
- By Form Factor
- Half-height Blades
- Full-height Blades
- Quarter-height / Micro-blades
- By Application / Workload
- Virtualisation and Private Cloud
- High-Performance Computing (HPC)
- Artificial Intelligence/Machine Learning and Data Analytics
- Storage-centric
- Edge / IoT Gateways
- By Data Center Type
- Hyperscalers/Cloud Service Provider
- Colocation Facilities
- Enterprise and Edge
- By End-use Industry
- BFSI
- IT and Telecom
- Healthcare and Life-Sciences
- Manufacturing and Industry 4.0
- Energy and Utilities
- Government and Defence
- Geography
- United States
- Canada
- Mexico
List of Companies Covered in this Report:
- Dell Technologies Inc.
- Hewlett Packard Enterprise Co.
- Lenovo Group Ltd.
- Cisco Systems Inc.
- IBM Corporation
- Super Micro Computer Inc.
- Quanta Computer Inc.
- Wiwynn Corp.
- Inspur Group
- Foxconn Technology Group
- Gigabyte Technology Co. Ltd.
- Fujitsu Ltd.
- Oracle Corporation
- NEC Corp.
- AMAX Information Technologies
- Penguin Computing (SMART Global)
- ASUStek Computer Inc.
- Hewlett-Packard Enterprise Services
- Huawei Technologies Co. Ltd.*
- Tyan Computer Corp.
Additional Benefits:
- The market estimate (ME) sheet in Excel format
- 3 months of analyst support
TABLE OF CONTENTS
1 INTRODUCTION
- 1.1 Study Assumptions and Market Definition
- 1.2 Scope of the Study
2 RESEARCH METHODOLOGY
3 EXECUTIVE SUMMARY
4 MARKET LANDSCAPE
- 4.1 Market Overview
- 4.2 Market Drivers
- 4.2.1 Rising adoption of cloud and IoT workloads
- 4.2.2 Commercial 5 G roll-outs driving edge build-outs
- 4.2.3 AI/ML training demand for GPU-dense servers
- 4.2.4 Data-sovereignty mandates in Canada and Mexico
- 4.2.5 Evergreen hardware refresh cycles (Opex model)
- 4.2.6 On-prem sovereign cloud designs for U.S. public sector
- 4.3 Market Restraints
- 4.3.1 Escalating data-center CapEx and land costs
- 4.3.2 Supply-chain volatility for custom silicon
- 4.3.3 Grid-power constraints in key metros
- 4.3.4 Sustainability / Scope-3 emissions compliance
- 4.4 Supply-Chain Analysis
- 4.5 Regulatory Landscape
- 4.6 Technological Outlook
- 4.7 Porter's Five Forces Analysis
- 4.7.1 Threat of New Entrants
- 4.7.2 Bargaining Power of Buyers
- 4.7.3 Bargaining Power of Suppliers
- 4.7.4 Threat of Substitutes
- 4.7.5 Intensity of Competitive Rivalry
- 4.8 Assessment of the Impact on Macro Economic Trends on the Market
5 MARKET SIZE AND GROWTH FORECASTS (VALUES)
- 5.1 By Data-Center Tier
- 5.1.1 Tier 1 and 2
- 5.1.2 Tier 3
- 5.1.3 Tier 4
- 5.2 By Form Factor
- 5.2.1 Half-height Blades
- 5.2.2 Full-height Blades
- 5.2.3 Quarter-height / Micro-blades
- 5.3 By Application / Workload
- 5.3.1 Virtualisation and Private Cloud
- 5.3.2 High-Performance Computing (HPC)
- 5.3.3 Artificial Intelligence/Machine Learning and Data Analytics
- 5.3.4 Storage-centric
- 5.3.5 Edge / IoT Gateways
- 5.4 By Data Center Type
- 5.4.1 Hyperscalers/Cloud Service Provider
- 5.4.2 Colocation Facilities
- 5.4.3 Enterprise and Edge
- 5.5 By End-use Industry
- 5.5.1 BFSI
- 5.5.2 IT and Telecom
- 5.5.3 Healthcare and Life-Sciences
- 5.5.4 Manufacturing and Industry 4.0
- 5.5.5 Energy and Utilities
- 5.5.6 Government and Defence
- 5.6 Geography
- 5.6.1 United States
- 5.6.2 Canada
- 5.6.3 Mexico
6 COMPETITIVE LANDSCAPE
- 6.1 Market Concentration
- 6.2 Strategic Moves
- 6.3 Market Share Analysis
- 6.4 Company Profiles (includes Global level Overview, Market level overview, Core Segments, Financials as available, Strategic Information, Market Rank/Share for key companies, Products and Services, and Recent Developments)
- 6.4.1 Dell Technologies Inc.
- 6.4.2 Hewlett Packard Enterprise Co.
- 6.4.3 Lenovo Group Ltd.
- 6.4.4 Cisco Systems Inc.
- 6.4.5 IBM Corporation
- 6.4.6 Super Micro Computer Inc.
- 6.4.7 Quanta Computer Inc.
- 6.4.8 Wiwynn Corp.
- 6.4.9 Inspur Group
- 6.4.10 Foxconn Technology Group
- 6.4.11 Gigabyte Technology Co. Ltd.
- 6.4.12 Fujitsu Ltd.
- 6.4.13 Oracle Corporation
- 6.4.14 NEC Corp.
- 6.4.15 AMAX Information Technologies
- 6.4.16 Penguin Computing (SMART Global)
- 6.4.17 ASUStek Computer Inc.
- 6.4.18 Hewlett-Packard Enterprise Services
- 6.4.19 Huawei Technologies Co. Ltd.*
- 6.4.20 Tyan Computer Corp.
7 MARKET OPPORTUNITIES and FUTURE OUTLOOK
- 7.1 White-space and Unmet-need Assessment


