

|
시장보고서
상품코드
2119736
미국의 위치 기반 서비스 시장 : 점유율 분석, 업계 동향과 통계, 성장 예측(2026-2031년)US Location-based Services - Market Share Analysis, Industry Trends & Statistics, Growth Forecasts (2026 - 2031) |
||||||
 Mordor Intelligence
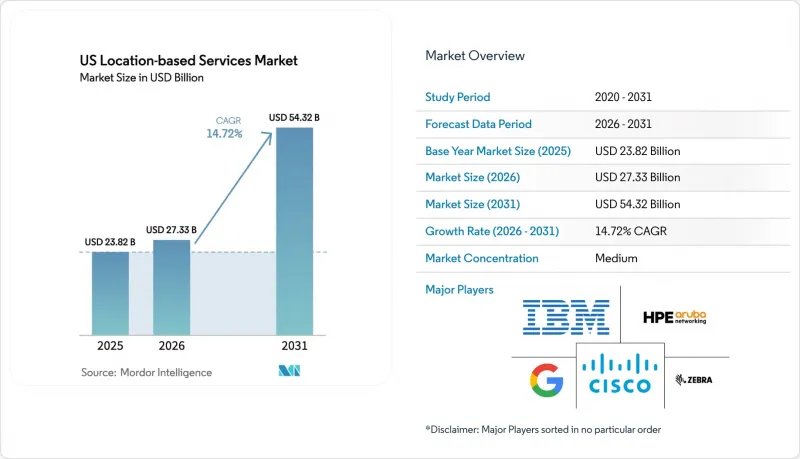
Mordor Intelligence에 의하면, 2026년 미국의 위치 기반 서비스 시장 규모는 273억 3,000만 달러로 추정되고 있어 2025년 238억 2,000만 달러에서 확대해, 2031년에는 543억 2,000만 달러에 이를 것으로 예측됩니다.
2026년부터 2031년까지의 연평균 성장률(CAGR)은 14.72%가 될 것으로 전망됩니다.
본 보고서에서는 업계를 구성 요소(하드웨어, 소프트웨어, 서비스), 장소(실내, 실외),용도(지도·내비게이션, 비즈니스 인텔리전스·분석, 위치 기반 광고, 소셜 네트워킹·엔터테인먼트, 기타 용도), 그리고 최종 사용자(운송 및 물류, IT 및 통신, 의료, 정부 기관 등)별로 분류하고 있습니다.
미국 위치 기반 서비스 시장 동향 및 인사이트
스마트폰 보급률과 5G 구축
광역 5G는 현재 3억 명 이상의 미국인에게 저대역 통신 영역을 제공하고 있으며, 첨단 다점 위치 측정 알고리즘과 결합하여 1미터 미만의 위치 측정을 지원합니다. 퀄컴의 X85 5G 모뎀·RF는 온칩 AI 엔진을 통합하고 있으며, 대규모 시설 내 위치 정확도를 높이기 위해 도달 시간(TOA) 계산을 강화합니다. 900만 개 시설에 대한 고정 무선 액세스(FWA) 구축은 모바일 분야를 넘어선 5G의 가능성을 보여주며, 지오펜싱을 활용한 홈 오토메이션 및 지방 지역의 자산 추적 기회를 창출하고 있습니다. 통신 사업자들은 현재 ‘프리미엄 위치 확인’ 구독 서비스를 제공하고 있으며, 조사에 따르면 5G 사용자의 35%가 공항이나 경기장에서의 실내 내비게이션 기능 향상을 위해 추가 요금을 지불할 의향이 있는 것으로 나타났습니다. 이러한 수익화 조짐은 미국 위치 기반 서비스 시장에서 제공업체의 장기적인 수익에 대한 확신을 뒷받침하고 있습니다.
지오마케팅 지출의 급증
소매업체들은 실시간 제안이 매장 내 전환율을 인구통계학적 특성만을 타겟으로 할 때보다 더 높은 수준으로 끌어올리기 때문에 예산을 근접성 중심 캠페인으로 전환하고 있습니다. 시스코 멜라키(Cisco Meraki)의 카메라는 현재 익명화된 Wi-Fi 프로빙과 컴퓨터 비전을 융합하여, 매장 방문 빈도나 체류 시간을 기반으로 쇼핑객을 세분화하고, 그 데이터를 동적 광고 플랫폼에 제공합니다. 시스코의 ‘2025년 소매 분석 조사’에 따르면, 모바일 사용자의 47%가 매장 반경 100미터 내에 진입했을 때 매장에서 발송하는 쿠폰을 수신하는 데 동의하고 있습니다. AI를 활용한 수요 예측을 통해 마케터는 매장 방문객 수의 급증이 예상될 때 프로그램적으로 재고를 사전 구매할 수 있게 되며, 위치 정보는 단순한 설명적 데이터에서 예측 가능한 자산으로 전환됩니다. 그 결과, 위치 정보 타겟팅형 포맷에 대한 예산 재분배가 두 자릿수 성장세를 보이며, 미국 위치 기반 서비스 시장의 매출 확대를 가속화하고 있습니다.
높은 도입 및 유지보수 비용
예측형 Wi-Fi 조사 비용은 395달러부터 시작하지만, 완전한 현장 검증의 경우 1,450달러까지 치솟으며, 엔드투엔드 기업용 도입 시 하드웨어 비용을 제외하고 10,000제곱피트당 평균 2,000달러가 소요됩니다. 광섬유를 이용한 백홀의 경우, 300미터의 굴착 공사로 최대 33,900달러의 추가 비용이 발생하며, 허가 취득과 도랑 파기에 3-4개월이 소요됩니다. 의료시설에 도입하려면 전자기 호환성(EMC) 시험 통과가 필수적이며, 이로 인해 시운전 예산이 증가하고 일정이 장기화됩니다. Bluetooth Low Energy 및 Ultra Wideband는 기존 이더넷 회선을 이용할 수 있지만, 조직은 전체 수명 주기 동안 소프트웨어 라이선스 비용, 보안 패치 적용, 분석 플랫폼 구독 비용에 여전히 직면해 있습니다. 이러한 누적된 비용이 중견 소매업체와 지역 병원의 도입을 저해하고 있으며, 미국 위치 기반 서비스 시장의 단기적인 성장을 둔화시키고 있습니다.
부문 분석
서비스 부문은 2025년 매출의 41.32%를 차지하며, 기업들이 RF 조사에서 분석 대시보드에 이르는 종단간 서비스를 필요로 하고 있기 때문에 연평균 성장률(CAGR) 17.12%를 나타낼 것으로 예측됩니다. 현재 관리형 서비스 번들에는 위치 기반 데이터 품질에 대한 SLA, 예방적 센서 배터리 교체, 분기별 분석 튜닝이 포함되어 있습니다. 동시에, 물리적 데이터 수집 계층을 지원하는 IoT 태그, 비콘, 멀티밴드 안테나에 대한 하드웨어 수요는 견조한 추세를 보이고 있으며, 소프트웨어 라이선스는 센서 수와 데이터 분석 워크로드에 따라 확대되고 있습니다. CenTrak의 턴키 도입 사례는 병원이 RTLS를 전자 차트나 간호사 호출 시스템과 연동할 때, 사내 IT 팀에 과도한 부담을 주지 않도록 통합 업무를 외부에 위탁하는 이유를 여실히 보여줍니다. 퀄컴의 ‘Aware’ 엔터프라이즈 플랫폼은 디바이스에 구애받지 않는 API를 제공함으로써 하드웨어와 서비스의 경계를 더욱 모호하게 만들고 있지만, 엣지에서 클라우드에 이르는 최적의 구성을 실현하기 위해서는 여전히 솔루션 아키텍트가 필요합니다.
대조적으로, 소매 및 제조업 분야의 자체 구축 전략에서는 오픈소스 매핑 SDK와 상용 Wi-Fi 분석 도구를 결합하는 사례가 증가하고 있지만, 숨겨진 유지보수 오버헤드로 인해 초기 비용 절감 효과가 상쇄되는 경우가 종종 있습니다. 그 결과, 미국의 위치 기반 서비스 시장에서는 서비스 부문이 계속해서 가장 높은 이익률을 유지하고 있습니다.
실외용 GPS 솔루션은 전자상거래 물류 분야의 내비게이션 및 라스트 마일 배송에서 확고한 역할을 수행한 덕분에 2025년에도 매출 점유율 55.47%를 유지했습니다. 한편, 실내 위치 추적 시장은 병원, 공항, 대형 소매점에서 직원 업무 흐름 및 고객 참여도 향상을 위해 서브미터급 정확도를 추구하고 있기 때문에 연평균 성장률(CAGR) 20.46%를 나타낼 것으로 예측됩니다. Silicon Labs의 BG22 블루투스 시스템 온 칩(SoC)은 의료시설에서 흔히 볼 수 있는 고밀도 RF 환경에서도 통신이 가능한 저전력 자산 태그를 구현합니다. Apple사의 표준화된 ‘Indoor Maps’ 데이터 모델은 독자적인 지도 제작 과정을 불필요하게 함으로써 시설 내 도입을 가속화하고 있습니다. 이러한 칩셋 혁신과 생태계의 표준화가 맞물려 미국 위치 기반 서비스 시장에서 실내 서비스의 점유율을 확대되고 있습니다.
기존 구조물에서는 여전히 금속 설비로 인한 멀티패스 간섭이 발생하기 쉬우므로, 솔루션 제공업체들은 비콘 배치를 자동으로 조정하는 AI 지원 보정 루틴을 도입하고 있습니다. 이러한 발전으로 인해 도입 준비 기간이 몇 주에서 며칠로 단축되어, 실내 서비스가 성숙한 실외 서비스와 동등한 수준에 도달하도록 뒷받침하는 동시에, 향후 미국 위치 기반 서비스 업계를 주도하게 될 실내·실외 간 핸드오버 이용 사례로 가는 길을 마련하고 있습니다.
기타 혜택:
- 엑셀 형식 시장 예측(ME) 시트
- 3개월간 애널리스트 지원
자주 묻는 질문
목차
제1장 서론
제2장 조사 방법
제3장 개요
제4장 시장 구도
제5장 시장 세분화
제6장 경쟁 구도
제7장 시장 기회와 향후 전망
JHS 26.09.03According to Mordor Intelligence, US location-based services market size in 2026 is estimated at USD 27.33 billion, growing from 2025 value of USD 23.82 billion with 2031 projections showing USD 54.32 billion, growing at 14.72% CAGR over 2026-2031.
This report Segments the Industry Into by Component (Hardware, Software, and Services), Location (Indoor, and Outdoor), Application (Mapping and Navigation, Business Intelligence and Analytics, Location-Based Advertising, Social Networking and Entertainment, and Other Applications), and by End-User (Transportation and Logistics, IT and Telecom, Healthcare, Government, and More).
US Location-based Services Market Trends and Insights
Smartphone penetration and 5G rollout
Wide-area 5G now provides low-band coverage to more than 300 million Americans and supports sub-meter positioning when paired with advanced multilateration algorithms. Qualcomm's X85 5G Modem-RF integrates an on-chip AI engine that enhances time-of-arrival calculations for location accuracy inside large venues. Fixed-wireless access (FWA) rollouts to 9 million premises show 5G's potential beyond mobility, opening opportunities for geofencing-based home automation and rural asset tracking. Carriers now package "premium positioning" subscriptions; surveys indicate 35% of 5G users will pay extra for enhanced indoor navigation in airports and arenas. These monetization signals underpin long-run revenue confidence for providers in the US location-based services market.
Geo-marketing spend surge
Retailers are pivoting budgets toward proximity-driven campaigns because real-time offers lift in-store conversion rates above demographic-only targeting benchmarks. Cisco Meraki cameras now fuse anonymized WiFi probing with computer vision to segment shoppers by visit frequency and dwell time, feeding that data into dynamic ad platforms. Forty-seven percent of mobile consumers opt in to receive store-triggered coupons when within 100 meters, according to Cisco's 2025 retail analytics survey. AI-powered demand forecasts allow marketers to pre-buy inventory programmatically when foot-traffic spikes are predicted, converting location data from a descriptive to a predictive asset. The outcome is double-digit budget reallocation to location-targeted formats that accelerates revenue for the US location-based services market.
High installation and maintenance cost
Predictive WiFi surveys start at USD 395 but full on-site validation climbs to USD 1,450, and end-to-end enterprise deployments average USD 2,000 for every 10,000 square-feet before hardware . Fiber backhauls adds as much as USD 33,900 for 300-meter digs and takes three to four months to permit and trench. Healthcare installations must pass electromagnetic compatibility tests, raising commissioning budgets and elongate timelines. While Bluetooth low-energy and ultra-wideband can ride existing Ethernet, organizations still face software licensing, security patching, and analytics-platform subscriptions across the life cycle. These cumulative costs stall adoption among mid-tier retailers and community hospitals, tempering near-term growth in the US location-based services market.
Other drivers and restraints analyzed in the detailed report include:
- Demand for real-time asset visibility (RTLS)
- Growth of indoor mapping for retail and venues
- Privacy and data-protection compliance burden
For complete list of drivers and restraints, kindly check the Table Of Contents.
Segment Analysis
Services own 41.32% of 2025 revenues and are forecast to record a 17.12% CAGR because enterprises require end-to-end delivery from RF survey through analytics dashboard. Managed services bundles now incorporate location-based data-quality SLAs, proactive sensor-battery replacement, and quarterly analytics tuning. Simultaneously, hardware demand remains steady for IoT tags, beacons, and multi-band antennas that underpin physical capture layers, while software licenses scale in line with sensor counts and data-analytics workloads. CenTrak's turnkey deployments illustrate why hospitals choose outsourced integration to align RTLS with electronic medical records and nurse-call systems without over-loading internal IT teams . Qualcomm's Aware enterprise platform further blurs the line between hardware and services by offering device-agnostic APIs that still necessitate solution architects for optimal edge-to-cloud configuration.
In contrast, self-build strategies inside retail and manufacturing operations increasingly combine open-source mapping SDKs with off-the-shelf WiFi analytics, but hidden maintenance overhead often negates up-front savings. As a result, the services segment continues to capture the highest margin profile in the US location-based services market.
Outdoor GPS solutions retained 55.47% revenue share in 2025 thanks to the entrenched role of navigation and last-mile delivery in e-commerce logistics. Yet indoor positioning is projected to grow at a 20.46% CAGR as hospitals, airports, and big-box retailers chase sub-meter accuracy for staff workflows and shopper engagement. Silicon Labs' BG22 Bluetooth System-on-Chip enables low-power asset tags that report through dense RF environments typical of medical facilities. Apple's standardized Indoor Maps data model is speeding venue adoption by removing bespoke map-creation steps. This combination of chipset innovation and ecosystem standardization is enlarging the indoor slice of the US location-based services market.
Legacy structures still suffer multipath interference from metallic fixtures, so solution providers deploy AI-assisted calibration routines that auto-tune beacon placement. These advances shrink commissioning windows from weeks to days, helping indoor deployments gain parity with mature outdoor services and setting the stage for future indoor-outdoor handoff use cases that will dominate the US location-based services industry.
Complete Report Scope:
- By Component
- Hardware
- Software
- Services
- By Location Type
- Indoor
- Outdoor
- By Application
- Mapping and Navigation
- Business Intelligence and Analytics
- Location-based Advertising
- Social Networking and Entertainment
- Other Applications
- By End-user Vertical
- Transportation and Logistics
- IT and Telecom
- Healthcare
- Government
- BFSI
- Hospitality
- Manufacturing
- Other End-users
List of Companies Covered in this Report:
- Alphabet Inc. (Google LLC)
- Apple Inc.
- Cisco Systems, Inc.
- International Business Machines Corporation (IBM)
- Microsoft Corporation
- Hewlett-Packard Enterprise Company (Aruba Networks)
- Zebra Technologies Corporation
- Qualcomm Incorporated
- Esri, Inc.
- Maxar Technologies Inc. (DigitalGlobe)
- CenTrak, Inc.
- Foursquare Labs, Inc.
- HERE Global B.V.
- TomTom N.V.
- Mapbox, Inc.
- Trimble Inc.
- Gimbal, Inc.
- Inpixon
- iSpace, Inc.
- CartoDB, Inc.
Additional Benefits:
- The market estimate (ME) sheet in Excel format
- 3 months of analyst support
TABLE OF CONTENTS
1 INTRODUCTION
- 1.1 Study Assumptions and Market Definition
- 1.2 Scope of the Study
2 RESEARCH METHODOLOGY
3 EXECUTIVE SUMMARY
4 MARKET LANDSCAPE
- 4.1 Market Overview
- 4.2 Market Drivers
- 4.2.1 Smartphone penetration and 5G rollout
- 4.2.2 Geo-marketing spend surge
- 4.2.3 Demand for real-time asset visibility (RTLS)
- 4.2.4 Growth of indoor mapping for retail and venues
- 4.2.5 Federal Transit LBS datasets unlocking new use-cases
- 4.2.6 Generative-AI powered spatial analytics
- 4.3 Market Restraints
- 4.3.1 High installation and maintenance cost
- 4.3.2 Privacy and data-protection compliance burden
- 4.3.3 Indoor RF interference in legacy buildings
- 4.3.4 State-level data-sovereignty legislation
- 4.4 Evaluation of Critical Regulatory Framework
- 4.5 Value Chain Analysis
- 4.6 Technological Outlook
- 4.7 Porter's Five Forces
- 4.7.1 Bargaining Power of Suppliers
- 4.7.2 Bargaining Power of Buyers
- 4.7.3 Threat of New Entrants
- 4.7.4 Threat of Substitutes
- 4.7.5 Competitive Rivalry
- 4.8 Key Use Cases and Case Studies
- 4.9 Impact on Macroeconomic Factors of the Market
- 4.10 Investment Analysis
5 MARKET SEGMENTATION
- 5.1 By Component
- 5.1.1 Hardware
- 5.1.2 Software
- 5.1.3 Services
- 5.2 By Location Type
- 5.2.1 Indoor
- 5.2.2 Outdoor
- 5.3 By Application
- 5.3.1 Mapping and Navigation
- 5.3.2 Business Intelligence and Analytics
- 5.3.3 Location-based Advertising
- 5.3.4 Social Networking and Entertainment
- 5.3.5 Other Applications
- 5.4 By End-user Vertical
- 5.4.1 Transportation and Logistics
- 5.4.2 IT and Telecom
- 5.4.3 Healthcare
- 5.4.4 Government
- 5.4.5 BFSI
- 5.4.6 Hospitality
- 5.4.7 Manufacturing
- 5.4.8 Other End-users
6 COMPETITIVE LANDSCAPE
- 6.1 Market Concentration
- 6.2 Strategic Moves
- 6.3 Market Share Analysis
- 6.4 Company Profiles {(includes Global level Overview, Market level overview, Core Segments, Financials as available, Strategic Information, Market Rank/Share for key companies, Products and Services, and Recent Developments)}
- 6.4.1 Alphabet Inc. (Google LLC)
- 6.4.2 Apple Inc.
- 6.4.3 Cisco Systems, Inc.
- 6.4.4 International Business Machines Corporation (IBM)
- 6.4.5 Microsoft Corporation
- 6.4.6 Hewlett-Packard Enterprise Company (Aruba Networks)
- 6.4.7 Zebra Technologies Corporation
- 6.4.8 Qualcomm Incorporated
- 6.4.9 Esri, Inc.
- 6.4.10 Maxar Technologies Inc. (DigitalGlobe)
- 6.4.11 CenTrak, Inc.
- 6.4.12 Foursquare Labs, Inc.
- 6.4.13 HERE Global B.V.
- 6.4.14 TomTom N.V.
- 6.4.15 Mapbox, Inc.
- 6.4.16 Trimble Inc.
- 6.4.17 Gimbal, Inc.
- 6.4.18 Inpixon
- 6.4.19 iSpace, Inc.
- 6.4.20 CartoDB, Inc.
7 MARKET OPPORTUNITIES AND FUTURE OUTLOOK
- 7.1 White-space and Unmet-Need Assessment


