|
시장보고서
상품코드
2119779
유럽의 데이터센터 네트워킹 : 시장 점유율 분석, 업계 동향 및 통계, 성장 예측(2026-2031년)Europe Data Center Networking - Market Share Analysis, Industry Trends & Statistics, Growth Forecasts (2026 - 2031) |
||||||
 Mordor Intelligence
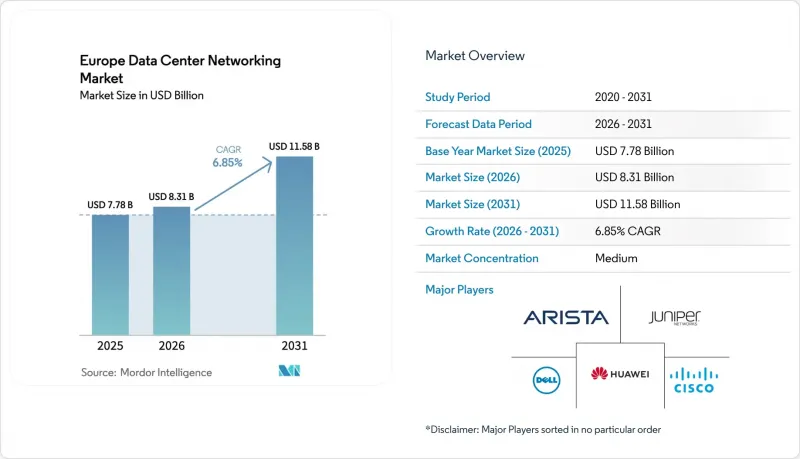
Mordor Intelligence에 의하면, 2026년 유럽의 데이터센터 네트워킹 시장 규모는 83억 1,000만 달러로 추정되고 2025년 77억 8,000만 달러에서 확대해, 2031년에는 115억 8,000만 달러에 이를 것으로 예측됩니다.
2026년부터 2031년까지의 연평균 성장률(CAGR)은 6.85%를 나타낼 전망입니다.
본 보고서에서는 업계를 구성 요소(제품별, 서비스별), 최종 사용자(IT 및 통신, 은행, 금융서비스 및 보험(BFSI), 기타 최종 사용자), 데이터센터 유형(코로케이션, 하이퍼스케일러/클라우드 서비스 제공업체 등), 대역폭(10 GbE 이하, 25-40 GbE 등)별로 분류하고 있습니다. 시장 예측은 금액(달러) 기준으로 제시되어 있습니다.
유럽의 데이터센터 네트워킹 시장 동향 및 인사이트
클라우드 스토리지와 신뢰성 높은 용도 성능
2024년에는 EU 기업의 45%가 클라우드 서비스를 도입했습니다. 주요 용도는 이메일 호스팅과 파일 스토리지였으며, 오프프레미스형 플랫폼에 대한 의존이 주류를 이루고 있음이 부각되었습니다. 유럽 정부의 워크로드에는 Oracle Cloud Infrastructure가 채택되어 있어, 공공 부문이 클라우드 네이티브 네트워크를 신뢰하고 있음을 보여줍니다. 실시간 결제에 관한 규제로 인해 유럽 은행들은 2025년까지 10초 이내에 거래를 결제해야 할 의무가 있었으며, 이 요건으로 인해 지연 시간 허용 범위가 엄격해지면서 초저지터 스위칭 패브릭이 중요시되고 있습니다. 주요 병원을 연결하는 ‘Trustworthy &Responsible AI Network’는 개인정보 보호 규정을 준수하면서도 진단용 AI를 상시 가동하기 위해, 내결함성이 뛰어난 데이터센터 간 경로에 의존하고 있습니다. 이러한 규제적 요구와 성능에 대한 기대가 맞물리면서, 고가용성 네트워크는 단순한 운영상의 필요성을 넘어 경영진 차원의 차별화 요인으로 자리매김하고 있습니다.
5G 및 엣지 컴퓨팅에 따른 트래픽 급증
EU는 2030년까지 1만 개의 기후 중립적인 엣지 노드를 구축할 방침이며, 처리의 80%가 코어 사이트 외부에서 이루어질 것으로 전망하고 있습니다. '5GMEC4EU' 프로그램 하에서 진행된 실증 실험에서는 광 회로 교환과 SDN 제어 플레인을 통합한 서브 밀리초급 엣지 패브릭이 입증되었습니다. 도이치 텔레콤은 엣지를 국가 디지털 아젠다의 핵심 축으로 삼아, 스마트 시티의 원격 측정 및 자율 주행을 실현하고 있습니다. 마이크로 데이터센터의 매출액은 2023년에 이미 58억 달러를 넘어섰으며, 2036년까지 1,608억 달러에 달할 전망으로, 견고한 스위치와 지능형 엣지 컨트롤러에 대한 꾸준한 수요가 나타나고 있습니다. 이 분산형 토폴로지는 트래픽을 FLAP 허브에서 우회시키기 때문에 수천 개의 미니 사이트에 걸쳐 실시간 장애 격리가 가능한 새로운 오케스트레이션 계층이 요구됩니다.
증가하는 네트워크의 복잡성
하이브리드 클라우드의 무분별한 확장과 AI 파이프라인으로 인해 토폴로지의 복잡성이 유럽 기업들이 유능한 엔지니어를 채용할 수 있는 속도를 앞지르는 속도로 증가하고 있습니다. 주니퍼의 Apstra는 멀티 벤더 패브릭에 인텐트 기반 자동화를 적용하고 있지만, 팀이 쿠버네티스, 테라폼, 광 회로 교환을 동시에 다루어야 하기 때문에 기술 인력 부족 문제는 여전히 지속되고 있습니다. ETNO는 통신 사업자가 엣지 서비스를 제공하면서 투자를 회수할 수 있도록 규제 완화를 요구하고 있습니다. 폭넓은 전문 지식이 부족하여 조직들은 업그레이드를 미루고 있으며, 유럽의 데이터센터 네트워킹 시장의 장비 교체 움직임이 둔화되고 있습니다.
부문별 분석
2025년, 이더넷 스위치는 유럽의 데이터센터 네트워킹 시장에서 34.78%의 점유율을 차지하며, GPU 클러스터에 연결되는 리프-스파인 패브릭에서 그 역할을 부각시켰습니다. 연평균 성장률(CAGR) 11.76%로 성장하고 있는 소프트웨어 정의 네트워크(SDN) 컨트롤러는 다양한 세대의 ASIC을 통합 관리하고 장애 조치(failover)를 자동화합니다. 이는 클러스터의 평균 규모가 1만 대 이상의 서버에 달하는 상황에서 필수적인 기능입니다. 라우터는 WAN 인제스트에서 여전히 중요성을 유지하고 있지만, 계층을 평탄화하고 지연 시간을 줄이는 컨버지드 스위치에 내부 역할을 양보하고 있습니다. 스토리지 네트워킹은 성장 속도가 완만하지만, 운영 복원력에 대한 규제를 충족하기 위해 불변 백업 볼트를 채택하는 금융 서비스 업계로부터 관심을 받고 있습니다. 용도 전달 컨트롤러는 엣지에서 필수적인 요소가 되어, 사용자 바로 근처에서 TLS 오프로드를 처리하고 있습니다. 보안 어플라이언스는 EU의 ‘디지털 운영 복원력 법(Digital Operational Resilience Act)’ 규정을 준수하기 위해 스위칭 OS 이미지에 통합되는 사례가 늘고 있습니다. 광 인터커넥트는 가장 빠르게 진화하고 있으며, 통신 사업자들이 비용,전력 소비, 업그레이드 용이성을 비교 검토하는 가운데, 코패키지형 광 모듈과 리니어 플러그어블 옵틱스가 소켓 시장 점유율을 놓고 경쟁하고 있습니다. 매니지드 네트워크 계약을 통해 기업이 복잡성으로 인해 발생하는 전문 지식의 격차를 메울 수 있게 됨에 따라, 해당 서비스는 시장을 안정시키는 역할을 하고 있습니다.
액체 냉각 지원 장비를 중심으로 제2의 교체 슈퍼사이클이 형성되고 있습니다. 콜드 플레이트 섀시와 직접-투-칩 루프를 결합한 벤더의 제품은 PUE 점수를 공개해야 하는 코로케이션 시설 운영자들에게 어필하고 있습니다. 범용 실리콘으로 인해 하드웨어 성능은 균일화되었으며, 차별화의 초점은 실시간 패브릭 텔레메트리 등의 NOS 기능으로 이동하고 있습니다. SONiC과 같은 오픈 네트워킹 배포판은 대규모 배선 공사 없이도 벤더를 교체할 수 있다는 점을 구매자에게 설득하고 있으며, 소프트웨어 지원과 라이프사이클 관리가 새로운 신뢰 지표로 자리 잡고 있습니다. 이러한 전환으로 인해 수익원은 물리적 포트에서 라이선스 및 구독형 텔레메트리로 재분배되고 있지만, 패킷 처리용 ASIC의 혁신은 라인 레이트 암호화 및 AI 클러스터의 혼잡 제어에 있어 여전히 필수적입니다.
IT 및 통신 기업들은 풍부한 피어링 및 백본 자산을 활용하여 하이브리드 클라우드와 5G를 수익화함으로써 2025년 매출의 36.05%를 차지했습니다. 은행 및 보험사는 실시간 결제 규제 및 모델 기반 리스크 스코어링으로 인해 금고와 분석 엔진 간의 초저지연 링크가 필수적인 상황에서 12.65%라는 가장 높은 CAGR을 기록하고 있습니다. 정부 및 국방 기관은 독일의 ‘Deutsche Verwaltungscloud’와 같은 주권 클라우드 프레임워크를 채택하여 데이터의 거주지 및 제로 트러스트에 의한 세분화를 우선시하고 있습니다. 미디어 및 엔터테인먼트 기업들은 프라이빗 CDN을 확장하고, 스포츠 생중계 시 백본의 혼잡을 완화하기 위해 트랜스코딩을 엣지 랙으로 이전하고 있습니다. 의료 네트워크는 방사선 진단을 위한 공유 AI 모델에 참여하고 있으며, 암호화된 이스트-웨스트 트래픽 검사에 대한 수요를 촉진하고 있습니다. 제조 업계에서는 로봇 셀 및 예측 유지보수를 위해 결정론적 이더넷을 도입하여 OT(운영 기술)와 IT 도메인의 융합을 추진하고 있습니다. 교육, 소매, 물류가 나머지 지출을 차지하고 있으며, 디지털 커리큘럼과 옴니채널 주문 처리 시스템이 성숙해짐에 따라 캠퍼스 코어 네트워크를 100 GbE로 업그레이드하고 있습니다.
운영 복원력에 대한 EU의 규제 압력으로 인해 설비 투자가 뒷받침되고 있습니다. ‘디지털 운영 복원력 법(Digital Operational Resilience Act)’에 따라 중견 금융 기관조차 분기마다 장애 복구 테스트를 실시해야 하며, 이중화된 메시 구성의 도입이 진행되고 있습니다. 통신 사업자들은 RAN의 혼잡을 완화하기 위해 트래픽을 멀티 액세스 엣지 유닛(MAEU)으로 우회시키고, 워크로드에 따른 라우팅 기능을 코어 스위치에 통합하고 있습니다. 전반적으로, 산업별 다양성이 유럽의 데이터센터 네트워킹 시장의 경기 변동 충격을 완화하는 한편, BFSI(은행 및 금융 및 보험) 부문의 점유율은 확대되고 있습니다.
기타 혜택 :
- 엑셀 형식 시장 예측(ME) 시트
- 3개월간의 애널리스트 지원
자주 묻는 질문
목차
제1장 서론
제2장 조사 방법
제3장 주요 요약
제4장 시장 구도
제5장 시장 규모 및 성장 예측
제6장 경쟁 구도
제7장 시장 기회 및 향후 전망
KTHAccording to Mordor Intelligence, Europe data center networking market size in 2026 is estimated at USD 8.31 billion, growing from 2025 value of USD 7.78 billion with 2031 projections showing USD 11.58 billion, growing at 6.85% CAGR over 2026-2031.
This report Segments the Industry Into Components (By Product, by Services), End-Users (IT & Telecommunication, BFSI, Other End-Users). By Data-Center Type(Colocation, Hyperscalers/Cloud Service Providers, and More). And Bandwidth( <=10 GbE, 25-40 GbE, and More). The Market Forecasts are Provided in Terms of Value (USD).
Europe Data Center Networking Market Trends and Insights
Cloud Storage and Reliable Application Performance
Forty-five percent of EU businesses procured cloud services in 2024, primarily for email hosting and file storage, underscoring mainstream reliance on off-premise platforms. Oracle Cloud Infrastructure was selected for European government workloads, indicating public-sector trust in cloud-native networks. Instant payment regulations require European banks to clear transactions within 10 seconds by 2025, a mandate that tightens latency budgets and favors ultra-low-jitter switching fabrics. The Trustworthy & Responsible AI Network linking leading hospitals depends on resilient inter-data-center paths to keep diagnostic AI online while remaining privacy-compliant. Together, regulatory imperatives and performance expectations elevate high-availability networking from operational necessity to board-level differentiator.
5G and Edge-Computing Traffic Surge
The EU intends to deploy 10,000 climate-neutral edge nodes by 2030, expecting 80% of processing to occur outside core sites. Demonstrations under the 5GMEC4EU program validate sub-millisecond edge fabrics that integrate optical circuit switching with SDN control planes. Deutsche Telekom positions edge as a pillar for national digital agendas, enabling smart-city telemetry and autonomous mobility. Micro data center revenues already exceeded USD 5.8 billion in 2023 and have a runway toward USD 160.8 billion by 2036, revealing a robust pipeline for ruggedized switches and intelligent edge controllers. This distributed topology re-routes traffic away from FLAP hubs, demanding new orchestration layers capable of real-time fault isolation across thousands of mini-sites.
Rising Network Complexity
Hybrid cloud sprawl and AI pipelines complicate topologies faster than European enterprises can recruit qualified engineers. Juniper's Apstra applies intent-based automation to multivendor fabrics, yet skills shortages persist as teams juggle Kubernetes, Terraform, and optical circuit switching. ETNO argues for policy relief that lets carriers recoup investments while delivering edge services. Without broad expertise, organisations defer upgrades, slowing refresh activity in the Europe data center networking market.
Other drivers and restraints analyzed in the detailed report include:
- Migration to 400G/800G Ethernet Switching
- EU Push for Energy-Efficient Liquid-Cooled Switching
- Supply-Chain Shortage of Optics and ASICs
For complete list of drivers and restraints, kindly check the Table Of Contents.
Segment Analysis
Ethernet switches commanded 34.78% Europe data center networking market share in 2025, underscoring their role in leaf-spine fabrics that feed GPU clusters. Software-defined networking controllers, expanding at 11.76% CAGR, orchestrate diverse ASIC generations and automate failover, a necessity as average cluster sizes surpass 10,000 servers. Routers retain relevance for WAN ingress but cede internal roles to converged switches that flatten layers and squeeze latency. Storage networking, though growing slower, gains interest from financial services adopting immutable backup vaults to satisfy operational resilience rules. Application delivery controllers become indispensable at the edge, handling TLS offload near user eyeballs. Security appliances increasingly embed in switching OS images to comply with EU Digital Operational Resilience Act rules. Optical interconnects evolve fastest; co-packaged optics and linear pluggable optics battle for sockets as operators weigh cost, power and upgrade ease. Services hold a stabilizing influence as managed network contracts let enterprises offset the expertise gap that complexity creates.
A second-wave replacement super-cycle is forming around liquid-cool ready gear. Vendors pairing cold-plate chassis with direct-to-chip loops appeal to colocation landlords who must publish PUE scores. Merchant silicon levels hardware performance, shifting differentiation toward NOS features such as real-time fabric telemetry. Open networking distributions like SONiC persuade buyers that they can swap vendors without forklift rewires, making software support and lifecycle stewardship the new trust metric. This pivot realigns profit pools toward licenses and subscription telemetry rather than physical ports, yet packet-processing ASIC innovation remains critical for line-rate encryption and AI cluster congestion control.
IT and telecommunications firms delivered 36.05% of 2025 revenue, leveraging rich peering and backbone assets to monetise hybrid cloud and 5G. Banks and insurers post the fastest 12.65% CAGR as instant-payment rules and model-driven risk scoring force ultra-low latency links between vaults and analytics engines. Government and defence entities adopt sovereign cloud frameworks such as Germany's Deutsche Verwaltungscloud, prioritising data residency and zero-trust segmentation. Media and entertainment houses expand private CDNs, shifting transcoding to edge racks to curb backbone congestion during live sports streams. Healthcare networks participate in shared AI models for radiology, fuelling demand for encrypted east-west traffic inspection. Manufacturing deploys deterministic Ethernet for robotic cells and predictive maintenance, pushing OT and IT domain convergence. Education, retail and logistics round out remaining spend, upgrading campus cores to 100 GbE as digital curricula and omnichannel fulfilment mature.
EU regulatory pressure for operational resilience anchors capital outlays. The Digital Operational Resilience Act compels even mid-tier financial entities to test failover quarterly, driving redundant mesh deployments. Telecommunication operators reroute traffic toward multi-access edge units to offload RAN congestion, embedding workload-aware routing into core switches. Overall, vertical diversity cushions cyclical swings in the Europe data center networking market while BFSI share grows.
Complete Report Scope:
- By Component
- Products
- Ethernet Switches
- Routers
- Storage Area Network (SAN)
- Application Delivery Controllers (ADC)
- Network Security Appliances
- Software-Defined Networking (SDN) Controllers
- Optical Interconnects
- Services
- Installation and Integration
- Training and Consulting
- Support and Maintenance
- Managed Network Services
- Products
- By End-User
- IT and Telecommunications
- Banking, Financial Services and Insurance (BFSI)
- Government and Defense
- Media and Entertainment
- Healthcare and Life Sciences
- Manufacturing and Industrial
- Other End-Users
- By Data-Center Type
- Colocation
- Hyperscalers/Cloud Service Providers
- Edge/Micro Data Centers
- By Bandwidth
- Less Than or equals to 10 GbE
- 25-40 GbE
- 50-100 GbE
- Greater than 100 GbE
- By Country
- United Kingdom
- Germany
- France
- Netherlands
- Ireland
- Spain
- Italy
- Sweden
- Denmark
- Norway
- Poland
- Austria
- Belgium
- Switzerland
- Rest of Europe
List of Companies Covered in this Report:
- Cisco Systems Inc.
- Arista Networks Inc.
- Juniper Networks Inc.
- Huawei Technologies Co. Ltd.
- Dell Technologies Inc.
- Extreme Networks Inc.
- Broadcom Inc.
- Hewlett Packard Enterprise Co.
- Lenovo Group Ltd.
- NEC Corp.
- Fortinet Inc.
- VMware Inc.
- Nokia Corp.
- NVIDIA Corp. (Mellanox)
- Array Networks Inc.
- Radware Ltd.
- A10 Networks Inc.
- Moxa Inc.
- Ericsson AB
- Check Point Software Technologies Ltd.
Additional Benefits:
- The market estimate (ME) sheet in Excel format
- 3 months of analyst support
TABLE OF CONTENTS
1 INTRODUCTION
- 1.1 Study Assumptions and Market Definition
- 1.2 Scope of the Study
2 RESEARCH METHODOLOGY
3 EXECUTIVE SUMMARY
4 MARKET LANDSCAPE
- 4.1 Market Overview
- 4.2 Market Drivers
- 4.2.1 Cloud storage and reliable application performance
- 4.2.2 5G and edge-computing traffic surge
- 4.2.3 Migration to 400G/800G Ethernet switching
- 4.2.4 EU push for energy-efficient liquid-cooled switching
- 4.2.5 Shift of builds to secondary EU metros after FLAP moratoria
- 4.2.6 Merchant silicon and open NOS adoption cuts capex
- 4.3 Market Restraints
- 4.3.1 Rising network complexity
- 4.3.2 Supply-chain shortage of optics and ASICs
- 4.3.3 Power-grid bottlenecks and permitting delays
- 4.3.4 Carbon-/water-use caps inflate TCO
- 4.4 Value / Supply-Chain Analysis
- 4.5 Regulatory Landscape
- 4.6 Technological Outlook
- 4.7 Porter's Five Forces
- 4.7.1 Threat of New Entrants
- 4.7.2 Bargaining Power of Buyers/Consumers
- 4.7.3 Bargaining Power of Suppliers
- 4.7.4 Threat of Substitute Products
- 4.7.5 Intensity of Competitive Rivalry
- 4.8 Assessment of the Impact on Macro Economic Trends on the Market
5 MARKET SIZE and GROWTH FORECASTS (VALUE)
- 5.1 By Component
- 5.1.1 Products
- 5.1.1.1 Ethernet Switches
- 5.1.1.2 Routers
- 5.1.1.3 Storage Area Network (SAN)
- 5.1.1.4 Application Delivery Controllers (ADC)
- 5.1.1.5 Network Security Appliances
- 5.1.1.6 Software-Defined Networking (SDN) Controllers
- 5.1.1.7 Optical Interconnects
- 5.1.2 Services
- 5.1.2.1 Installation and Integration
- 5.1.2.2 Training and Consulting
- 5.1.2.3 Support and Maintenance
- 5.1.2.4 Managed Network Services
- 5.1.1 Products
- 5.2 By End-User
- 5.2.1 IT and Telecommunications
- 5.2.2 Banking, Financial Services and Insurance (BFSI)
- 5.2.3 Government and Defense
- 5.2.4 Media and Entertainment
- 5.2.5 Healthcare and Life Sciences
- 5.2.6 Manufacturing and Industrial
- 5.2.7 Other End-Users
- 5.3 By Data-Center Type
- 5.3.1 Colocation
- 5.3.2 Hyperscalers/Cloud Service Providers
- 5.3.3 Edge/Micro Data Centers
- 5.4 By Bandwidth
- 5.4.1 Less Than or equals to 10 GbE
- 5.4.2 25-40 GbE
- 5.4.3 50-100 GbE
- 5.4.4 Greater than 100 GbE
- 5.5 By Country
- 5.5.1 United Kingdom
- 5.5.2 Germany
- 5.5.3 France
- 5.5.4 Netherlands
- 5.5.5 Ireland
- 5.5.6 Spain
- 5.5.7 Italy
- 5.5.8 Sweden
- 5.5.9 Denmark
- 5.5.10 Norway
- 5.5.11 Poland
- 5.5.12 Austria
- 5.5.13 Belgium
- 5.5.14 Switzerland
- 5.5.15 Rest of Europe
6 COMPETITIVE LANDSCAPE
- 6.1 Market Concentration
- 6.2 Strategic Moves
- 6.3 Market Share Analysis
- 6.4 Company Profiles (includes Global level Overview, Market level overview, Core Segments, Financials as available, Strategic Information, Market Rank/Share, Products and Services, Recent Developments)
- 6.4.1 Cisco Systems Inc.
- 6.4.2 Arista Networks Inc.
- 6.4.3 Juniper Networks Inc.
- 6.4.4 Huawei Technologies Co. Ltd.
- 6.4.5 Dell Technologies Inc.
- 6.4.6 Extreme Networks Inc.
- 6.4.7 Broadcom Inc.
- 6.4.8 Hewlett Packard Enterprise Co.
- 6.4.9 Lenovo Group Ltd.
- 6.4.10 NEC Corp.
- 6.4.11 Fortinet Inc.
- 6.4.12 VMware Inc.
- 6.4.13 Nokia Corp.
- 6.4.14 NVIDIA Corp. (Mellanox)
- 6.4.15 Array Networks Inc.
- 6.4.16 Radware Ltd.
- 6.4.17 A10 Networks Inc.
- 6.4.18 Moxa Inc.
- 6.4.19 Ericsson AB
- 6.4.20 Check Point Software Technologies Ltd.
7 MARKET OPPORTUNITIES and FUTURE OUTLOOK
- 7.1 White-space and Unmet-Need Assessment