|
시장보고서
상품코드
2119782
북미의 데이터센터 네트워킹 : 시장 점유율 분석, 업계 동향 및 통계, 성장 예측(2026-2031년)North America Data Center Networking - Market Share Analysis, Industry Trends & Statistics, Growth Forecasts (2026 - 2031) |
||||||
 Mordor Intelligence
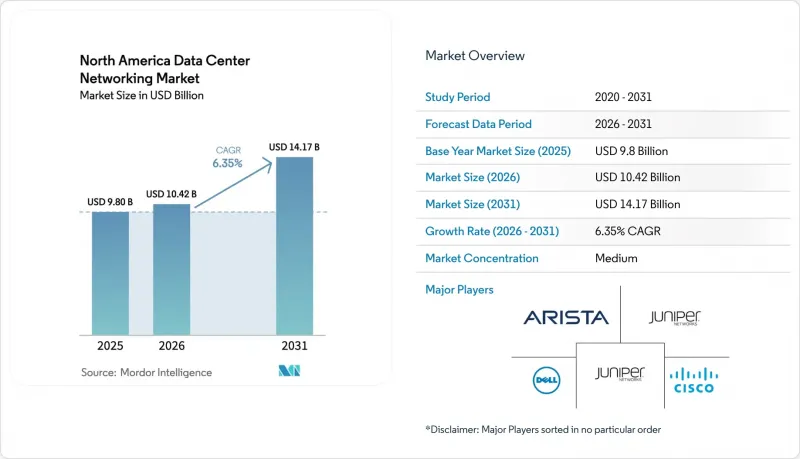
Mordor Intelligence에 의하면, 2026년 북미의 데이터센터 네트워킹 시장 규모는 104억 2,000만 달러로 추정되고 2025년 98억 달러에서 성장하여 2031년에는 141억 7,000만 달러에 이를 것으로 예측됩니다.
2026년부터 2031년까지의 연평균 성장률(CAGR)은 6.35%가 될 것으로 전망됩니다.
본 보고서에서는 업계를 구성 요소(제품별, 서비스별), 최종 사용자(IT 및 통신, 은행, 금융서비스 및 보험(BFSI), 기타 최종 사용자), 데이터센터 유형(코로케이션, 하이퍼스케일러/클라우드 서비스 제공업체 등), 대역폭(10 GbE 이하, 25-40 GbE 등)별로 분류하고 있습니다. 시장 예측은 금액(달러) 기준으로 제시되어 있습니다.
북미의 데이터센터 네트워킹 시장 동향 및 인사이트
AI/ML 워크로드가 400G/800G 스위칭 도입을 주도
수천 대의 GPU를 활용한 모델 훈련에 대한 수요로 인해 AI 패브릭을 위한 네트워크 투자 규모가 2배로 확대되었으며, 사업자들은 100 G에서 400 G 및 800 G 리프-스파인 설계로 전환할 수밖에 없게 되었습니다. Alista는 고객이 분산 학습에 최적화된 초저지연 이더넷 패브릭을 도입함에 따라, 2025년에는 자사의 AI 센터용 네트워크 매출이 15억 달러에 달했습니다. 브로드컴의 102.4 Tbps ‘Tomahawk 6’ 실리콘은 클러스터당 100만 대 이상의 가속기를 상호 연결하는 차세대 스위치의 기반이 되고 있습니다. 울트라 이더넷 컨소시엄은 딥러닝에서 흔히 사용되는 올 리듀스(all-reduce), 올 개더(all-gather) 및 집합 연산을 효율화하는 혼잡 대응 프로토콜의 최종 조정을 진행하고 있습니다. 실리콘 포토닉스는 지연 시간과 전력 소비 제약을 더욱 완화하고 있으며, 대만의 파운드리 네트워크가 스케일아웃 분야에서 중요한 공급 거점으로 부상하고 있습니다.
사이버 보안 위협의 고조로 네트워크 업그레이드가 촉진되고 있습니다.
CISA가 관리형 서비스 제공업체를 대상으로 한 조직적인 공격이 하류 테넌트까지 파급되고 있다고 보고함에 따라, 제로 트러스트 도입이 가속화되고 있습니다. J.P. 모건 등 주요 금융 기관들은 진화하는 규정 준수 요건을 충족하기 위해 데이터센터 간암호화 채널을 재구축하고 방화벽을 갱신했습니다. AI 기반 위협 감지 엔진이 코어 스위치에 인라인으로 탑재되면서 1초 이내에 이상 현상을 격리할 수 있게 되었습니다. 의료 사업자들은 보호 대상인 의료 정보를 다루는 엣지 포드에도 이러한 제어 기능을 확대하고, HIPAA 요건을 충족하기 위해 칩 수준의 보안 부팅 및 텔레메트리 기능을 통합하고 있습니다.
전력망 연결 지연으로 건설 주기 장기화
미국에서는 2,600 GW가 넘는 발전 용량이 송전망 연결을 기다리고 있으며, 버지니아주 북부와 같은 혼잡한 지역에서는 데이터센터 가동 시작이 최대 7년 지연되는 사태가 발생하고 있습니다. 이 미처리 건은 계획 중인 시설의 20%를 위협하고 있으며, 2033년까지 버지니아주의 전력 소비량을 2배로 증가시킬 가능성이 있습니다. 이에 대응하여 사업자들은 부지 내에 재생에너지 설비를 병설하거나 마이크로그리드를 도입하는 등의 조치를 취하고 있습니다. 구글의 200억 달러 규모 프로그램에서는 송전망의 병목 현상을 피하기 위해 캠퍼스와 태양광·풍력 발전소를 연계하고 있습니다.
부문별 분석
북미의 데이터센터 네트워킹 시장에서는 하이퍼스케일 패브릭의 기반이 되는 이더넷 스위치, 라우터, 광 인터커넥트를 중심으로 여전히 제품이 시장의 71.25%를 차지하고 있습니다. 그러나 기업들이 설계, 모니터링, 라이프사이클 지원을 매니지드 프로바이더에 위탁함에 따라 서비스 부문은 연평균 성장률(CAGR) 10.85%로 확대될 것으로 예측됩니다. 400G/800G 도입에 따라 설치 및 통합 작업이 급증하는 한편, 매니지드 네트워크 서비스는 사내에 필요한 기술 역량을 갖추지 못한 기업의 운영상 복잡성을 해소하고 있습니다. 이러한 서비스로의 전환은 IT 인프라 전반에 걸쳐 사용량 기반 과금 모델이 부상하고 있음을 반영합니다.
도입 인프라가 성숙해짐에 따라 예방적 유지보수 및 AIOps를 활용한 문제 해결에 대한 수요가 증가하고 있습니다. 또한, AI를 활용한 패브릭 튜닝이나 실리콘 포토닉스 도입에는 전문적인 지식이 필요하기 때문에 교육 및 컨설팅 수익도 증가하고 있습니다. 북미의 데이터센터 네트워킹 시장에서 하드웨어가 절대적인 지출액 면에서는 여전히 우위를 차지하겠지만, 서비스 분야 증가율은 제품 분야를 앞지를 전망입니다.
IT 및 통신 업계는 북미의 데이터센터 네트워킹 시장에서 36.90%의 점유율을 차지하고 있으며, 이는 클라우드 및 컨텐츠 제공업체에 의한 백본의 지속적인 업그레이드를 반영하고 있습니다. 의료 및 생명과학 분야는 원격 의료의 확대, 유전체 데이터의 급증, 그리고 엄격한 규정 준수 요건으로 인해 8.85%라는 가장 높은 연평균 성장률(CAGR)을 기록하고 있습니다. 병원 그룹은 현재 페타바이트 규모의 이미지 데이터 세트를 처리하며, 원격 수술 지원을 위해 암호화되고 매우 신뢰할 수 있는 상호 연결에 의존하고 있습니다.
은행/금융서비스/보험 부문도 여전히 큰 비중을 차지하고 있으며, 다운타임 1초 미만으로 핵심 시스템의 라이브 마이그레이션을 가능하게 하는 올-포토닉 백본을 통한 현대화가 진행되고 있습니다. 미디어 및 엔터테인먼트 분야에서는 높은 비트레이트의 스트리밍에 따라 예산이 증가하는 한편, 산업계 기업들은 엣지에서 인더스트리 4.0 분석을 실현하기 위해 시스템을 업그레이드하고 있습니다. 이처럼 북미의 데이터센터 네트워킹 업계는 저지연 데이터 흐름을 통해 경쟁적 차별화를 꾀하는 모든 업종과 관련되어 있습니다.
기타 혜택 :
- 엑셀 형식 시장 예측(ME) 시트
- 3개월간의 애널리스트 지원
자주 묻는 질문
목차
제1장 서론
제2장 조사 방법
제3장 주요 요약
제4장 시장 구도
제5장 시장 규모 및 성장 예측
제6장 경쟁 구도
제7장 시장 기회 및 향후 전망
KTHAccording to Mordor Intelligence, North America data center networking market size in 2026 is estimated at USD 10.42 billion, growing from 2025 value of USD 9.8 billion with 2031 projections showing USD 14.17 billion, growing at 6.35% CAGR over 2026-2031.
This report Segments the Industry Into Components (By Product, by Services), End-Users (IT & Telecommunication, BFSI, Other End-Users). Data-Center Type(Colocation, Hyperscalers/Cloud Service Providers, and More). And Bandwidth(<=10 GbE, 25-40 GbE, and More). The Market Forecasts are Provided in Terms of Value (USD).
North America Data Center Networking Market Trends and Insights
AI/ML Workloads Driving Adoption of 400 G/800 G Switching
Demand for model training on thousands of GPUs has doubled the addressable network spend for AI fabric, pushing operators to jump from 100 G to 400 G and 800 G leaf-spine designs. Arista expects its AI-center networking revenue to reach USD 1.5 billion in 2025 as customers deploy ultra-low-latency Ethernet fabrics optimised for distributed learning. Broadcom's 102.4 Tbps Tomahawk 6 silicon underpins next-generation switches that interconnect more than 1 million accelerators per cluster. The Ultra Ethernet Consortium is finalising congestion-aware protocols that streamline all-reduce, all-gather, and collective ops typical in deep learning. Silicon photonics further narrows latency and power envelopes, with Taiwan's foundry network emerging as a critical scale-out supply base.
Rising Cybersecurity Threats Prompting Network Upgrades
Zero-trust adoption has accelerated after CISA reported coordinated attacks on managed service providers that ripple through downstream tenants. Financial majors such as J.P. Morgan have rebuilt inter-data-center encrypted channels and refreshed firewalls to satisfy evolving compliance requirements. AI-based threat-detection engines now sit inline on core switches, allowing sub-second anomaly isolation. Healthcare operators extend these controls to edge pods carrying protected health information, incorporating chip-level secure boot and telemetry to meet HIPAA mandates.
Power-Grid Interconnection Delays Lengthening Build Cycles
More than 2,600 GW of generation await grid interconnection in the United States, slowing data-center energisation by up to seven years in congested locales such as Northern Virginia. The backlog threatens 20% of planned facilities and could double Virginia's electricity consumption by 2033. Operators respond by co-locating on-site renewables or adopting micro-grids; Google's USD 20 billion programme pairs campuses with solar and wind parks that bypass transmission bottlenecks.
Other drivers and restraints analyzed in the detailed report include:
- Increasing Need for Cloud Storage and Low-Latency Application Performance
- Edge Data-Center Proliferation Alongside 5G Roll-outs
- High Capex for Next-Gen Optics and 800 GbE Switches
For complete list of drivers and restraints, kindly check the Table Of Contents.
Segment Analysis
Products still account for 71.25% of the North America data center networking market, anchored by Ethernet switches, routers and optical interconnects that underpin hyperscale fabrics. Services, however, are forecast to climb at an 10.85% CAGR as firms outsource design, monitoring and lifecycle support to managed providers. Installation and integration tasks balloon with 400 G/800 G rollouts, while managed network services absorb operational complexity for enterprises lacking in-house skillsets. This pivot toward services echoes the rise of consumption-based models across IT infrastructure.
A maturing installed base amplifies demand for proactive maintenance and AIOps-driven troubleshooting. Training and consulting revenues also rise because AI fabric tuning and silicon-photonic deployments require specialised expertise. The North America data center networking market size for services is set to outpace products in incremental growth even though hardware will continue to dominate absolute spend.
IT and telecommunications dominate with 36.90% share of the North America data center networking market, reflecting constant backbone upgrades by cloud and content providers. Healthcare and life sciences record the fastest 8.85% CAGR owing to telehealth expansion, genomics data spikes and strict compliance mandates. Hospital groups now ingest petabyte-scale imaging datasets and rely on encrypted, ultra-reliable interconnects for remote surgery support.
Banking, financial services and insurance remain sizeable, modernising with all-photonic backbones that allow live core-system migrations under one-second downtime nttdata. Media & entertainment budgets climb with high-bit-rate streaming, while industrial firms upgrade to enable Industry 4.0 analytics at the edge. The North America data center networking industry thus touches every vertical seeking competitive differentiation through low-latency data flows.
Complete Report Scope:
- By Component
- Products
- Ethernet Switches
- Routers
- Storage Area Network (SAN)
- Application Delivery Controllers (ADC)
- Network Security Appliances
- Software-Defined Networking (SDN) Controllers
- Optical Interconnects
- Services
- Installation and Integration
- Training and Consulting
- Support and Maintenance
- Managed Network Services
- Products
- By End-User
- IT and Telecommunications
- Banking, Financial Services and Insurance (BFSI)
- Government and Defense
- Media and Entertainment
- Healthcare and Life Sciences
- Manufacturing and Industrial
- Other End-Users
- By Data-Center Type
- Colocation
- Hyperscalers/Cloud Service Providers
- Edge/Micro Data Centers
- By Bandwidth
- Less Than equals to 10 GbE
- 25-40 GbE
- 50-100 GbE
- Greater than 100 GbE
- By Country
- United States
- Canada
- Mexico
List of Companies Covered in this Report:
- Cisco Systems, Inc.
- Broadcom Inc.
- Juniper Networks, Inc.
- Arista Networks, Inc.
- Dell Technologies Inc.
- Hewlett Packard Enterprise Company
- Extreme Networks, Inc.
- NVIDIA Corporation (incl. Cumulus Networks)
- VMware, Inc.
- Fortinet, Inc.
- F5, Inc.
- Radware Ltd.
- A10 Networks, Inc.
- NEC Corporation
- Lenovo Group Limited
- Ciena Corporation
- IBM Corporation
- Oracle Corporation
- Array Networks, Inc.
- Infinera Corporation
Additional Benefits:
- The market estimate (ME) sheet in Excel format
- 3 months of analyst support
TABLE OF CONTENTS
1 INTRODUCTION
- 1.1 Study Assumptions and Market Definition
- 1.2 Scope of the Study
2 RESEARCH METHODOLOGY
3 EXECUTIVE SUMMARY
4 MARKET LANDSCAPE
- 4.1 Market Overview
- 4.2 Market Drivers
- 4.2.1 Increasing need for cloud storage and low-latency application performance
- 4.2.2 Rising cybersecurity threats prompting network upgrades
- 4.2.3 AI / ML workloads driving adoption of 400/800 GbE switching
- 4.2.4 Edge data-center proliferation alongside 5G roll-outs
- 4.2.5 Utility-scale on-site generation unlocking high-density campuses
- 4.2.6 State-level tax incentives accelerating hardware refresh cycles
- 4.3 Market Restraints
- 4.3.1 Network complexity and multi-vendor interoperability issues
- 4.3.2 High capex for next-gen optics and 800 GbE switches
- 4.3.3 Power-grid interconnection delays lengthening build cycles
- 4.3.4 Optical transceiver supply-chain shortages
- 4.4 Value / Supply-Chain Analysis
- 4.5 Regulatory Landscape
- 4.6 Technological Outlook
- 4.7 Porter's Five Forces
- 4.7.1 Threat of New Entrants
- 4.7.2 Bargaining Power of Buyers/Consumers
- 4.7.3 Bargaining Power of Suppliers
- 4.7.4 Threat of Substitute Products
- 4.7.5 Intensity of Competitive Rivalry
- 4.8 Assessment of the Impact on Macro Economic Trends on the Market
5 MARKET SIZE and GROWTH FORECASTS (VALUE)
- 5.1 By Component
- 5.1.1 Products
- 5.1.1.1 Ethernet Switches
- 5.1.1.2 Routers
- 5.1.1.3 Storage Area Network (SAN)
- 5.1.1.4 Application Delivery Controllers (ADC)
- 5.1.1.5 Network Security Appliances
- 5.1.1.6 Software-Defined Networking (SDN) Controllers
- 5.1.1.7 Optical Interconnects
- 5.1.2 Services
- 5.1.2.1 Installation and Integration
- 5.1.2.2 Training and Consulting
- 5.1.2.3 Support and Maintenance
- 5.1.2.4 Managed Network Services
- 5.1.1 Products
- 5.2 By End-User
- 5.2.1 IT and Telecommunications
- 5.2.2 Banking, Financial Services and Insurance (BFSI)
- 5.2.3 Government and Defense
- 5.2.4 Media and Entertainment
- 5.2.5 Healthcare and Life Sciences
- 5.2.6 Manufacturing and Industrial
- 5.2.7 Other End-Users
- 5.3 By Data-Center Type
- 5.3.1 Colocation
- 5.3.2 Hyperscalers/Cloud Service Providers
- 5.3.3 Edge/Micro Data Centers
- 5.4 By Bandwidth
- 5.4.1 Less Than equals to 10 GbE
- 5.4.2 25-40 GbE
- 5.4.3 50-100 GbE
- 5.4.4 Greater than 100 GbE
- 5.5 By Country
- 5.5.1 United States
- 5.5.2 Canada
- 5.5.3 Mexico
6 COMPETITIVE LANDSCAPE
- 6.1 Market Concentration
- 6.2 Strategic Moves
- 6.3 Market Share Analysis
- 6.4 Company Profiles (includes Global level overview, Market level overview, Core segments, Financials as available, Strategic information, Market rank/share for key companies, Products and Services, and Recent developments)
- 6.4.1 Cisco Systems, Inc.
- 6.4.2 Broadcom Inc.
- 6.4.3 Juniper Networks, Inc.
- 6.4.4 Arista Networks, Inc.
- 6.4.5 Dell Technologies Inc.
- 6.4.6 Hewlett Packard Enterprise Company
- 6.4.7 Extreme Networks, Inc.
- 6.4.8 NVIDIA Corporation (incl. Cumulus Networks)
- 6.4.9 VMware, Inc.
- 6.4.10 Fortinet, Inc.
- 6.4.11 F5, Inc.
- 6.4.12 Radware Ltd.
- 6.4.13 A10 Networks, Inc.
- 6.4.14 NEC Corporation
- 6.4.15 Lenovo Group Limited
- 6.4.16 Ciena Corporation
- 6.4.17 IBM Corporation
- 6.4.18 Oracle Corporation
- 6.4.19 Array Networks, Inc.
- 6.4.20 Infinera Corporation
7 MARKET OPPORTUNITIES and FUTURE OUTLOOK
- 7.1 White-space and unmet-need assessment