|
시장보고서
상품코드
2119780
아프리카의 데이터센터 네트워킹 : 시장 점유율 분석, 업계 동향 및 통계, 성장 예측(2026-2031년)Africa Data Center Networking - Market Share Analysis, Industry Trends & Statistics, Growth Forecasts (2026 - 2031) |
||||||
 Mordor Intelligence
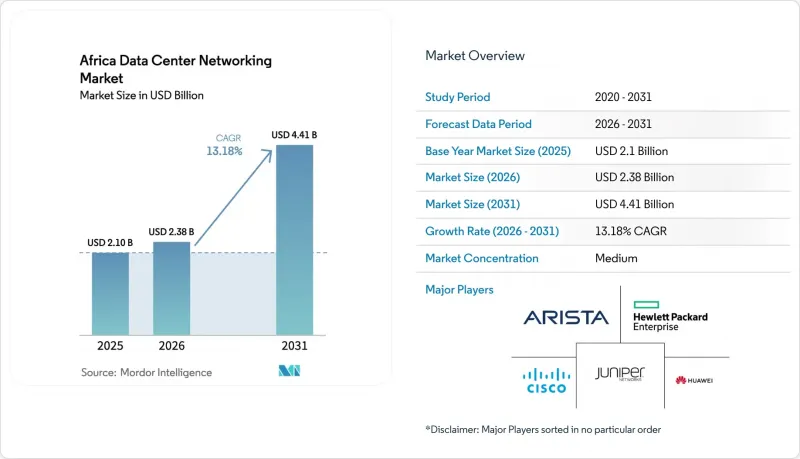
Mordor Intelligence에 의하면, 아프리카의 데이터센터 네트워킹 시장 규모는 2025년 21억 달러로 평가되었습니다. 2026년에는 23억 8,000만 달러로 확대되어 2026년부터 2031년에 걸쳐 CAGR 13.18%로 성장을 지속하여, 2031년에는 44억 1,000만 달러에 이를 것으로 예측됩니다.
본 보고서에서는 업계를 구성 요소(제품별, 서비스별), 최종 사용자(IT 및 통신, 은행, 금융서비스 및 보험(BFSI), 기타 최종 사용자), 데이터센터 유형(코로케이션, 하이퍼스케일러/클라우드 서비스 제공업체 등), 대역폭(10 GbE 이하, 25-40 GbE 등)별로 분류하고 있습니다. 시장 예측은 금액(달러) 기준으로 제시되어 있습니다.
아프리카의 데이터센터 네트워킹 시장 동향 및 인사이트
하이퍼스케일 및 클라우드 도입의 급속한 확대
마이크로소프트, 구글, 아마존 웹 서비스(AWS)가 각국의 클라우드 존에 새로운 자본을 투입하는 가운데, 하이퍼스케일러 기업들은 아프리카의 데이터센터 네트워킹 시장을 재편하고 있습니다. 마이크로소프트가 2억 9,800만 달러를 투자하는 남아프리카공화국 프로그램에서는 대규모 언어 모델 훈련을 지원하는 25GbE 리프 계층 및 100 GbE 스파인 계층을 핵심으로 하는 AI 지원 패브릭이 제공되고 있습니다. 2024년 초부터 가동 중인 구글의 요하네스버그 클라우드 리전은 암스테르담 경로에 비해 80밀리초의 지연 시간 단축을 실현하고 있으며, 이에 따라 지역 SaaS 기업들이 워크로드 이전을 진행하고 있습니다. 새로운 클라우드 가용성 구역이 개설될 때마다, 통신사 중립적인 미트룸, 다크 파이버 경로, 그리고 새로운 캠퍼스에 연결되는 오픈 브리지형 400G 광 업링크에 대한 병행 투자가 촉진되고 있습니다. 세네갈에서는 AWS가 Sonatel과 제휴하여 핀테크 워크로드를 위해 5밀리초 미만의 서비스를 제공하고 있으며, 이는 주권형 클라우드 리전이 스위칭, 라우팅 및 상호 연결에 대한 투자에 시너지 효과를 가져오고 있음을 여실히 보여줍니다.
사이버 공격 표면의 확대와 규정 준수 요건의 강화
개인정보 보호 관련 법규가 강화됨에 따라, 보안 스위칭 패브릭 및 마이크로 부문화된 리프 계층에 대한 자본 배분이 증가하고 있습니다. 남아프리카공화국의 POPIA(개인정보보호법)에 따라 기업들은 차세대 방화벽,제로 트러스트 오버레이, 그리고 감사 추적을 위해 플로우 데이터를 내보낼 수 있는 풍부한 텔레메트리 기능을 갖춘 라우터를 도입해야 합니다. 나이지리아와 남아프리카공화국의 은행들은 안전한 SD-WAN의 초기 도입자이며, 아프리카 뱅크의 포티넷 도입이 그 대표적인 사례입니다. 이를 통해 PCI DSS 규정을 준수하면서도 WAN 비용을 절반으로 줄일 수 있었습니다. 규정 준수 요건은 금융 업계에 그치지 않고, 의료 및 공공 부문의 클라우드에서도 암호화된 이스트-웨스트 경로를 유지하고 결정론적 데이터 거주지의 적용을 입증해야 합니다. 따라서 수요는 암호화 엔진을 내장하고, AI 기반 이상 감지 기능을 통해 ‘감지까지의 평균 시간(MTD)’을 몇 시간에서 몇 분으로 단축하는 인텐트 기반 패브릭으로 이동하고 있습니다.
멀티클라우드 패브릭에서 심화되는 네트워크 복잡성
멀티클라우드 전략을 채택한 아프리카 기업들은 성능 편차, 도구의 난립, 운영 비용 증가와 같은 과제에 직면해 있습니다. 남아프리카의 한 소매 은행의 경우, 2개의 로컬 클라우드와 1개의 유럽 구역에 걸친 트래픽을 보호하기 위해 5개의 서로 다른 제어 플레인이 필요했으며, 그 결과 설정 불일치와 변경 기간의 장기화를 초래했습니다. 사내 전문 지식이 제한적이기 때문에 조직은 기술 격차를 해소하면서도 운영 비용(OPEX)을 증가시키는 매니지드 오버레이 네트워크로 전환할 수밖에 없습니다. 이러한 상황은 소프트웨어 정의 패브릭의 도입을 지연시키고, 디지털 거래 플랫폼과 같은 지연에 민감한 용도의 마이그레이션을 정체시키고 있습니다.
부문별 분석
2025년, 아프리카의 데이터센터 네트워킹 시장에서 제품은 67.45%의 점유율을 유지했습니다. 이는 모든 시설에서 여전히 물리적 스위치, 라우터, 광전송 장비와 같은 기본 설비가 필요하기 때문입니다. 이더넷 스위치는 리프-스파인 설계에서 높은 포트 밀도의 TOR 유닛과 낮은 지연 시간을 가진 스파인 블록을 결합해야 하므로 여전히 최대의 수익원입니다. 라우팅은 캠퍼스 코어, 인터넷 게이트웨이, 그리고 메트로 노드와 해저 착륙국을 연결하는 데이터센터 상호 연결 분야에서 계속해서 수요가 예상됩니다. 제로 트러스트와 SSL 오프로드가 보급됨에 따라 보안 어플라이언스와 ADC(용도 전달 컨트롤러)의 성장세가 가속화되고 있습니다.
기업들이 운영 역량 부족을 보완하려 함에 따라, 서비스 분야는 2031년까지 연평균 성장률(CAGR) 14.08%라는 빠른 속도로 확대되고 있습니다. 확실한 시장 진입을 목표로 하는 하이퍼스케일러 신규 진출기업들에게 있어, 도입 및 통합 프로젝트는 첫 번째 선택지가 되고 있습니다. 관리형 네트워크 서비스는 지속적인 운영 지원을 제공하여 현지 IT 팀이 용도 활용에 집중할 수 있도록 돕습니다. 주요 다국적 기업들이 향후 사내에서 리프-스파인 운영을 자체 관리할 수 있는 지역별 센터 오브 엑설런스(Center of Excellence) 구축을 목표로 하고 있어, 교육 및 컨설팅 사업이 성장하고 있습니다. 또한, 금융 및 의료 등 SLA를 중시하는 업계가 ‘4 나인즈(99.99%)’의 가동률을 요구함에 따라, 지원 및 유지보수 수익도 마찬가지로 증가하고 있습니다.
IT 및 통신 사업자들은 고객의 VM, OTT 캐시, 5G 코어 기능을 호스팅하기 위해 고밀도 패브릭을 구축하고 있으며, 2025년 아프리카의 데이터센터 네트워킹 시장 규모의 32.65%를 차지했습니다. 통신 사업자들은 초고신뢰성·저지연 트래픽에 대비하여 엣지 집약 사이트를 10GbE에서 25GbE로 업그레이드하는 한편, 도시 간 경로를 제어하기 위한 부문 라우팅에도 투자하고 있습니다. 클라우드 네이티브 ISP는 SONiC을 실행하는 화이트박스 장비를 채택하고 있으며, 이를 통해 브랜드 제품에 비해 설비 투자를 40% 절감할 수 있을 뿐만 아니라, 전 세계적인 공급 제약 속에서도 리드 타임을 단축할 수 있습니다.
정부 및 국방 분야의 워크로드는 연평균 성장률(CAGR) 14.72%로 가장 빠른 성장세를 보이고 있습니다. 국가 클라우드, 전자 의료 저장소, 스마트 시티의 원격 측정에는 중복된 가용성 영역 간에 암호화된 100 GbE 링크가 필요합니다. 각 부처는 검사 기능을 경계가 아닌 코어 내에 배치하는 PASE(Private Access Service Edge)를 채택하고 있으며, 이로 인해 트래픽 흐름 패턴이 변화하고 동서 방향의 대역폭 수요가 증가하고 있습니다. 또한 국방 기관에서는 드론 영상을 분석하기 위한 On-Premise AI 추론을 우선시하고 있어, 이에 따라 GPU 지원 네트워크 토폴로지에 대한 수요가 증가하고 있습니다.
기타 혜택 :
- 엑셀 형식 시장 예측(ME) 시트
- 3개월간의 애널리스트 지원
자주 묻는 질문
목차
제1장 서론
제2장 조사 방법
제3장 주요 요약
제4장 시장 구도
제5장 시장 규모 및 성장 예측
제6장 경쟁 구도
제7장 시장 기회 및 향후 전망
KTHAccording to Mordor Intelligence, the Africa data center networking market size is expected to grow from USD 2.1 billion in 2025 to USD 2.38 billion in 2026 and is forecast to reach USD 4.41 billion by 2031 at 13.18% CAGR over 2026-2031.
This report Segments the Industry Into Components (By Product, by Services), End-Users (IT & Telecommunication, BFSI, Other End-Users). By Data-Center Type(Colocation, Hyperscalers/Cloud Service Providers, and More). And Bandwidth( <=10 GbE, 25-40 GbE, and More). The Market Forecasts are Provided in Terms of Value (USD).
Africa Data Center Networking Market Trends and Insights
Rapid Expansion of Hyperscale and Cloud Deployments
Hyperscalers are reshaping the Africa data center networking market as Microsoft, Google, and Amazon Web Services commit fresh capital for sovereign cloud zones. Microsoft's USD 298 million South African program delivers AI-ready fabrics built around 25 GbE leaf and 100 GbE spine layers that support large-language-model training. Google's Johannesburg cloud region, live since early 2024, shows latency reductions of 80 milliseconds compared with Amsterdam routes, prompting regional SaaS firms to migrate workloads. Each new cloud availability zone triggers parallel investments in carrier-neutral meet-me rooms, dark-fiber routes, and open-bridged 400G optical uplinks that feed the new campuses. In Senegal, AWS partners with Sonatel to deliver sub-5 millisecond services for fintech workloads, underlining how sovereign cloud regions spur a multiplier effect on switching, routing, and interconnection spending.
Rising Cyber-Attack Surface and Compliance Mandates
Tighter privacy statutes increase capital allocation toward secure switching fabrics and micro-segmented leaf layers. South Africa's POPIA forces enterprises to deploy next-generation firewalls, zero-trust overlays, and telemetry-rich routers able to export flow data for audit trails.Banks in Nigeria and South Africa are early adopters of secure SD-WAN, illustrated by African Bank's Fortinet rollout that halved WAN expense while meeting PCI DSS rules. Compliance extends beyond finance as healthcare and public-sector clouds must maintain encrypted east-west pathways and demonstrate deterministic data-residency enforcement. Demand therefore migrates toward intent-based fabrics with embedded crypto engines and AI-driven anomaly detection that shortens mean-time-to-detect from hours to minutes.
Escalating Network Complexity in Multi-Cloud Fabric
African enterprises adopting multi-cloud strategies face inconsistent performance, tool sprawl, and higher operational costs. A South African retail bank needed five different control planes to secure traffic across two local clouds and one European zone, resulting in configuration drift and extended change windows. Limited in-house expertise pushes organisations toward managed overlay networks that raise opex even while solving skill gaps. The situation delays the adoption of software-defined fabrics and stalls the migration of latency-sensitive apps such as digital trading platforms.
Other drivers and restraints analyzed in the detailed report include:
- Surge in Mobile Data Traffic and OTT Content
- Government-Backed National Data-Residency Policies
- Scarcity of Skilled DC Networking Professionals
For complete list of drivers and restraints, kindly check the Table Of Contents.
Segment Analysis
Products retained 67.45% of the Africa data center networking market share in 2025, as every facility still requires a baseline of physical switches, routers, and optical transport gear. Ethernet switches remain the largest revenue contributor because leaf-spine designs rely on high-port-density TOR units coupled with low-latency spine blocks. Routing continues to find purchase within campus cores, internet gateways, and data-center interconnects that link metro nodes to subsea landing stations. Security appliances and ADCs are gaining momentum as zero-trust and SSL offload proliferate.
Services are scaling faster at a 14.08% CAGR through 2031 as enterprises aim to bridge operational skill deficiencies. Installation and integration engagements are the first port of call for hyperscaler newcomers that want assured time-to-market. Managed network services deliver continuous operations support, freeing local IT teams to focus on application enablement. Training and consulting lines are growing because large multinationals attempt to build regional centres of excellence that can eventually own leaf-spine operations internally. Support and maintenance revenues likewise climb as SLA-sensitive sectors such as finance and healthcare demand four-nines uptime.
IT and telecommunications players accounted for 32.65% of the Africa data center networking market size in 2025 as they deploy dense fabrics to host customer VMs, OTT caches, and 5G core functions. Telcos are refreshing edge aggregation sites from 10 GbE to 25 GbE in preparation for ultra-reliable low-latency traffic while also investing in segment routing to control inter-city paths. Cloud-native ISPs embrace white-box units running SONiC, which lowers capital spending by 40% relative to branded stacks and shortens lead times amid global supply constraints.
Government and defence workloads exhibit the swiftest growth at 14.72% CAGR. National clouds, e-health repositories, and smart-city telemetry demand encrypted 100 GbE links across redundant availability zones. Ministries adopt private access service edges that place inspection functions inside the core rather than at the perimeter, which changes traffic flow patterns and increases east-west bandwidth needs. Defence agencies also prioritise on-premise AI inference to analyse drone footage, thereby driving requests for GPU-aware network topologies.
Complete Report Scope:
- By Component
- Products
- Ethernet Switches
- Routers
- Storage Area Network (SAN)
- Application Delivery Controllers (ADC)
- Network Security Appliances
- Software-Defined Networking (SDN) Controllers
- Optical Interconnects
- Services
- Installation and Integration
- Training and Consulting
- Support and Maintenance
- Managed Network Services
- Products
- By End-User
- IT and Telecommunications
- Banking, Financial Services and Insurance (BFSI)
- Government and Defense
- Media and Entertainment
- Healthcare and Life Sciences
- Manufacturing and Industrial
- Other End-Users
- By Data-Center Type
- Colocation
- Hyperscalers/Cloud Service Providers
- Edge/Micro Data Centers
- By Bandwidth
- Less Than or equals to 10 GbE
- 25-40 GbE
- 50-100 GbE
- Greater than 100 GbE
- By Country
- South Africa
- Nigeria
- Kenya
- Egypt
- Morocco
- Rest of Africa
List of Companies Covered in this Report:
- Huawei Technologies Co. Ltd.
- Cisco Systems, Inc.
- F5, Inc.
- H3C Holding Limited
- NEC Corporation
- Juniper Networks, Inc.
- VMware, Inc.
- A10 Networks, Inc.
- Extreme Networks, Inc.
- Dell Technologies Inc.
- Array Networks, Inc.
- Radware Ltd.
- TP-Link Corporation Limited
- Moxa Inc.
- Arista Networks, Inc.
- Hewlett Packard Enterprise Company
- Nokia Corporation
- Ciena Corporation
- Fortinet, Inc.
- Check Point Software Technologies Ltd.
Additional Benefits:
- The market estimate (ME) sheet in Excel format
- 3 months of analyst support
TABLE OF CONTENTS
1 INTRODUCTION
- 1.1 Study Assumptions and Market Definition
- 1.2 Scope of the Study
2 RESEARCH METHODOLOGY
3 EXECUTIVE SUMMARY
4 MARKET LANDSCAPE
- 4.1 Market Overview
- 4.2 Market Drivers
- 4.2.1 Rapid expansion of hyperscale and cloud deployments
- 4.2.2 Rising cyber-attack surface and compliance mandates
- 4.2.3 Surge in mobile data traffic and OTT content
- 4.2.4 Government backed national data-residency policies
- 4.2.5 Sub-sea cable landings enabling low-latency peering
- 4.2.6 Adoption of white-box/open networking to cut TCO
- 4.3 Market Restraints
- 4.3.1 Escalating network complexity in multi-cloud fabric
- 4.3.2 Scarcity of skilled DC networking professionals
- 4.3.3 Chronic power-grid instability causing downtime
- 4.3.4 Import tariffs and customs delays on networking gear
- 4.4 Value / Supply-Chain Analysis
- 4.5 Regulatory Landscape
- 4.6 Technological Outlook
- 4.7 Investment and Funding Analysis
- 4.8 Porters Five Forces
- 4.8.1 Threat of New Entrants
- 4.8.2 Bargaining Power of Buyers
- 4.8.3 Bargaining Power of Suppliers
- 4.8.4 Threat of Substitutes
- 4.8.5 Intensity of Competitive Rivalry
- 4.9 Assessment of the impact of Macro Economic Trends on the Market
5 MARKET SIZE and GROWTH FORECASTS (VALUE)
- 5.1 By Component
- 5.1.1 Products
- 5.1.1.1 Ethernet Switches
- 5.1.1.2 Routers
- 5.1.1.3 Storage Area Network (SAN)
- 5.1.1.4 Application Delivery Controllers (ADC)
- 5.1.1.5 Network Security Appliances
- 5.1.1.6 Software-Defined Networking (SDN) Controllers
- 5.1.1.7 Optical Interconnects
- 5.1.2 Services
- 5.1.2.1 Installation and Integration
- 5.1.2.2 Training and Consulting
- 5.1.2.3 Support and Maintenance
- 5.1.2.4 Managed Network Services
- 5.1.1 Products
- 5.2 By End-User
- 5.2.1 IT and Telecommunications
- 5.2.2 Banking, Financial Services and Insurance (BFSI)
- 5.2.3 Government and Defense
- 5.2.4 Media and Entertainment
- 5.2.5 Healthcare and Life Sciences
- 5.2.6 Manufacturing and Industrial
- 5.2.7 Other End-Users
- 5.3 By Data-Center Type
- 5.3.1 Colocation
- 5.3.2 Hyperscalers/Cloud Service Providers
- 5.3.3 Edge/Micro Data Centers
- 5.4 By Bandwidth
- 5.4.1 Less Than or equals to 10 GbE
- 5.4.2 25-40 GbE
- 5.4.3 50-100 GbE
- 5.4.4 Greater than 100 GbE
- 5.5 By Country
- 5.5.1 South Africa
- 5.5.2 Nigeria
- 5.5.3 Kenya
- 5.5.4 Egypt
- 5.5.5 Morocco
- 5.5.6 Rest of Africa
6 COMPETITIVE LANDSCAPE
- 6.1 Market Concentration
- 6.2 Strategic Moves
- 6.3 Market Share Analysis
- 6.4 Company Profiles (includes Global level Overview, Market level overview, Core Segments, Financials as available, Strategic Information, Market Rank/Share for key companies, Products and Services, and Recent Developments)
- 6.4.1 Huawei Technologies Co. Ltd.
- 6.4.2 Cisco Systems, Inc.
- 6.4.3 F5, Inc.
- 6.4.4 H3C Holding Limited
- 6.4.5 NEC Corporation
- 6.4.6 Juniper Networks, Inc.
- 6.4.7 VMware, Inc.
- 6.4.8 A10 Networks, Inc.
- 6.4.9 Extreme Networks, Inc.
- 6.4.10 Dell Technologies Inc.
- 6.4.11 Array Networks, Inc.
- 6.4.12 Radware Ltd.
- 6.4.13 TP-Link Corporation Limited
- 6.4.14 Moxa Inc.
- 6.4.15 Arista Networks, Inc.
- 6.4.16 Hewlett Packard Enterprise Company
- 6.4.17 Nokia Corporation
- 6.4.18 Ciena Corporation
- 6.4.19 Fortinet, Inc.
- 6.4.20 Check Point Software Technologies Ltd.
7 MARKET OPPORTUNITIES and FUTURE OUTLOOK
- 7.1 White-space and Unmet-Need Assessment