
|
시장보고서
상품코드
2119783
남미의 데이터센터 네트워킹 : 시장 점유율 분석, 업계 동향 및 통계, 성장 예측(2026-2031년)South America Data Center Networking - Market Share Analysis, Industry Trends & Statistics, Growth Forecasts (2026 - 2031) |
||||||
 Mordor Intelligence
Mordor Intelligence에 의하면, 남미의 데이터센터 네트워킹 시장 규모는 2025년 8억 8,000만 달러로 평가되었습니다. 2026년에는 9억 8,000만 달러로 확대되어 2026-2031년에 걸쳐 CAGR 11.38%로 성장을 지속하여, 2031년에는 16억 8,000만 달러에 이를 것으로 예측됩니다.
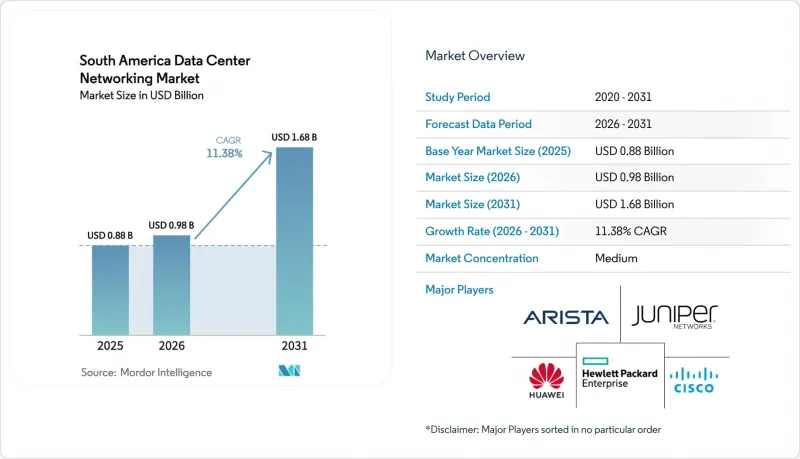
본 보고서는 구성 요소(제품 및 서비스), 최종 사용자(IT 및 통신, 은행 및 금융 서비스·보험(BFSI), 정부·국방, 기타),데이터센터 유형(코로케이션, 하이퍼스케일러·클라우드 서비스 제공업체, 엣지·마이크로 데이터센터), 대역폭(10GbE 이하, 25-40GbE, 기타), 국가별로 분류되어 있습니다. 시장 전망은 금액(달러) 기준으로 제시되어 있습니다.
남미의 데이터센터 네트워킹 시장 동향 및 인사이트
클라우드 스토리지 및 신뢰할 수 있는 용도 성능에 대한 수요 증가
기업들은 미션 크리티컬 워크로드를 클라우드 플랫폼으로 이전하고 있으며, 이로 인해 지역 내 시설에 대한 처리량 및 지연 시간 요구 사항이 높아지고 있습니다. 2028년까지 모든 핵심 시스템을 클라우드로 이전하겠다는 Banco Itau의 계획은 이러한 수요 급증을 상징하며, 통신 사업자들이 새로운 400G 및 800G 회선을 개통하도록 촉진하고 있습니다. Cirion Technologies는 이미 상파울루와 산티아고 간 1.6Tb/s 단일 캐리어 파장 실증에 성공하여, 광 백본이 AI 시대의 트래픽을 충분히 감당할 수 있음을 입증했습니다. On-Premise와 클라우드 리포지토리를 실시간으로 동기화하는 하이브리드 배포에서도 스토리지 성능은 마찬가지로 필수적입니다.
기업 대상 사이버 공격 증가
현재 라틴아메리카 기업에서는 주당 2,569건의 공격이 기록되고 있으며, 이는 세계 평균보다 40% 높은 수치입니다. 이러한 상황에 따라 CISO(최고 정보 보안 책임자)들은 차세대 방화벽, 보안 SD-WAN, AI를 활용한 위협 분석 도구의 도입을 서두르고 있습니다. 콜롬비아의 보험사인 Mutual Ser EPS는 멀티 클라우드 애플리케이션를 운영하는 50개 이상의 지점 보안을 강화하기 위해 Fortinet의 ‘FortiGate’ 어플라이언스를 도입했습니다. 예산 배분은 급속히 변화하고 있으며, 이 지역 기업의 절반이 사이버 보안 대책에 연간 1,000만-4,900만 달러를 할당하고 있습니다.
네트워크의 복잡화
하이브리드 클라우드 오버레이, 동서 방향 마이크로 세분화, 엣지 버스트로 인해 기술 격차가 드러나고 있습니다. 인텐트 기반 컨트롤러를 도입하는 기업들은 다양한 벤더의 API가 난립하는 상황에 직면하고 있으며, 이로 인해 인력이 부족한 NOC 팀의 부담이 가중되고 있습니다. 훈련된 인력 부족으로 인해 400G 도입 일정이 지연되고, 컨설팅에 대한 의존도가 높아지며, 실현 가능한 자동화의 깊이가 제한되고 있습니다.
부문 분석
2025년 매출의 75.63%를 제품이 차지했으며, 이는 모든 데이터센터 네트워킹 시장의 도입 기반을 형성하는 스위치, 라우터, 광 트랜스폰더, 보안 어플라이언스에 대한 막대한 지출을 반영합니다. 이더넷 리프-스파인의 업그레이드 주기는 25G/100G에서 400G급으로 전환되고 있는 반면, 모듈형 라우터는 SR-MPLS를 통합하여 언더레이 자동화를 간소화하고 있습니다. 각 벤더는 컨버지드 이더넷 상에서 RDMA를 실행하는 AI 클러스터의 지연 시간 요구 사항을 충족하기 위해 스위치용 ASIC 로드맵을 상용 실리콘 기술 혁신과 연계하고 있습니다. 서비스 부문은 관리형 SDN 컨트롤러, 라이프사이클 자동화, 사내 기술 역량이 부족한 기업을 위한 세심한 제로 트러스트 오버레이에 힘입어 연평균 성장률(CAGR) 11.49%로 확대되고 있습니다. 각 OEM 기업의 컨설팅 부서는 ‘네트워크 애즈 코드(Network-as-Code)’ 청사진과 DevNet 스타일의 교육을 함께 제공하여 도입 리드타임을 단축하고 있습니다. 지역 MSP는 멀티 클라우드 연결 핸드오버 및 ISO 27001을 준수하는 관리형 감지·대응 서비스를 제공함으로써 틈새 시장을 개척하고, 이기종 혼합 환경에서의 규정 준수를 확보하고 있습니다.
2025년, 통신 사업자의 클라우드가 코어 네트워크 슬라이스를 가상화하고, OTT 동영상 플랫폼이 니어 엣지 노드에 캐싱을 수행한 가운데, IT 및 통신 산업은 36.89%의 매출 점유율을 유지했습니다. 은행 산업은 즉시 결제 지시에 대응하기 위해 멀티 리전 지원 액티브-액티브형 데이터 스토어를 유지하며, 암호화된 100G MAC-sec 포트에 대한 수요를 높였습니다. 그러나 제조·산업 부문은 11.88%라는 가장 높은 연평균 성장률(CAGR)을 기록했습니다. 이는 인더스트리 4.0 개편 과정에서 결정론적 이더넷, 시간 민감형 네트워킹, PLC를 포그 서버에 연결하는 프라이빗 5G 게이트웨이가 요구되고 있기 때문입니다. 광업 컨소시엄은 왕복 전파 시간(RTT) 10밀리초 이하의 Cisco URWB 링크를 통해 원격 전송을 수행하고, 진동이 심한 갱내 환경에서도 견딜 수 있는 견고한 광 링을 입증했습니다. 자동차 공장에서는 클라우드상의 AI 품질 관리 엔진에 데이터를 공급하는 CAN 버스 디지털 트윈을 통해, 벤더에 구애받지 않는 텔레메트리를 철저히 구현하는 오픈 네트워킹 시범 프로젝트를 주도하고 있습니다.
기타 혜택
- 엑셀 형식 시장 예측(ME) 시트
- 3개월간의 애널리스트 지원
자주 묻는 질문
목차
제1장 서론
제2장 조사 방법
제3장 주요 요약
제4장 시장 구도
제5장 시장 규모 및 성장 예측
제6장 경쟁 구도
제7장 시장 기회 및 향후 전망
KTHAccording to Mordor Intelligence, the South America data center networking market size is expected to grow from USD 0.88 billion in 2025 to USD 0.98 billion in 2026 and is forecast to reach USD 1.68 billion by 2031 at 11.38% CAGR over 2026-2031.
This report is Segmented by Component (Product and Services), End User( IT and Telecommunications, Banking, Financial Services and Insurance (BFSI), Government and Defense and More), Data Center Type (Colocation, Hyperscalers/Cloud Service Providers, Edge/Micro Data Centers), by Bandwidth (<=10 GbE, 25-40 GbE and More) and by Country. The Market Forecasts are Provided in Terms of Value (USD).
South America Data Center Networking Market Trends and Insights
Increasing need for cloud storage and reliable application performance
Enterprises are shifting mission-critical workloads to cloud platforms, which raises throughput and latency requirements inside regional facilities. Banco Itau's program to move all core systems to the cloud by 2028 typifies the demand spike, prompting carriers to light new 400G and 800G links. Cirion Technologies has already demonstrated a 1.6 Tb/s single-carrier wavelength between Sao Paulo and Santiago, proving that optical backbones can stay ahead of AI-era traffic. Storage performance is equally vital for hybrid deployments that synchronize on-premises and cloud repositories in real time.
Rising cyber-attacks among enterprises
Latin-American companies now record 2,569 attacks per week-40% above the global average-pushing CISOs to buy next-generation firewalls, secure SD-WAN, and AI-augmented threat analytics. Mutual Ser EPS, a Colombian insurer, adopted Fortinet's FortiGate appliances to harden more than 50 branch locations that run multi-cloud applications. Budgets are shifting fast; half of regional firms allocate between USD 10 million and USD 49 million annually to cybersecurity controls
Increasing network complexity
Hybrid-cloud overlays, east-west microsegmentation, and edge bursts expose skill gaps. Enterprises deploying intent-based controllers face multi-vendor API sprawl that strains thin NOC teams. Lack of trained staff delays 400G adoption schedules, inflates consulting reliance, and limits achievable automation depth.
Other drivers and restraints analyzed in the detailed report include:
- Proliferation of hyperscale data-center builds by global cloud providers
- Surge in submarine-cable landings enabling low-latency coastal hubs
- High import tariffs & CAPEX for advanced equipment
For complete list of drivers and restraints, kindly check the Table Of Contents.
Segment Analysis
Products anchored 75.63% of 2025 revenue, reflecting heavy outlays on switches, routers, optical transponders, and security appliances that form the bedrock of every data center networking market deployment. Ethernet leaf-spine upgrade cycles shift from 25G/100G toward 400G class, while modular routers integrate SR-MPLS for simplified underlay automation. Vendors synchronize switch ASIC roadmaps with merchant-silicon breakthroughs to meet latency budgets of AI clusters running RDMA over Converged Ethernet.Services expand at an 11.49% CAGR, fueled by managed SDN controllers, lifecycle automation, and white-glove zero-trust overlays for enterprises lacking in-house skill sets. Consulting arms of OEMs bundle network-as-code blueprints plus DevNet-style training that compress deployment lead times. Regional MSPs carve niches by delivering multicloud connectivity hand-offs and ISO 27001-aligned managed detection and response, ensuring compliance across heterogeneous domiciles.
IT & Telecommunications kept a 36.89% revenue lead in 2025 as telco clouds virtualized core network slices and OTT video platforms cached near-edge nodes. Banking retained multi-region active-active data stores to satisfy instant-payment directives, lifting demand for encrypted 100G MAC-sec ports. Yet Manufacturing & Industrial registers the fastest 11.88% CAGR as Industry 4.0 retrofits call for deterministic Ethernet, Time-Sensitive Networking, and private 5G gateways linking PLCs to fog servers. Mining consortia run tele-remote haulage over Cisco URWB links under 10 ms RTT, demonstrating ruggedized optical rings that survive high-vibration pits. Automotive plants spearhead open networking pilots that enforce vendor-agnostic telemetry on CAN-bus digital twins feeding cloud AI quality-control engines.
Complete Report Scope:
- By Component
- Products
- Ethernet Switches
- Routers
- Storage Area Network (SAN)
- Application Delivery Controllers (ADC)
- Network Security Appliances
- Software-Defined Networking (SDN) Controllers
- Optical Interconnects
- Services
- Installation and Integration
- Training and Consulting
- Support and Maintenance
- Managed Network Services
- Products
- By End-User
- IT and Telecommunications
- Banking, Financial Services and Insurance (BFSI)
- Government and Defense
- Media and Entertainment
- Healthcare and Life Sciences
- Manufacturing and Industrial
- Other End-Users
- By Data-Center Type
- Colocation
- Hyperscalers/Cloud Service Providers
- Edge/Micro Data Centers
- By Bandwidth
- Less than or Equal to 10 GbE
- 25-40 GbE
- 50-100 GbE
- Greater than 100 GbE
- By Country
- Brazil
- Mexico
- Argentina
- Rest of South America
List of Companies Covered in this Report:
- Cisco Systems Inc.
- Huawei Technologies Co. Ltd.
- Juniper Networks Inc.
- Hewlett Packard Enterprise Development LP
- Arista Networks Inc.
- Dell Technologies Inc. (Dell EMC)
- Extreme Networks Inc.
- Fortinet Inc.
- VMware Inc.
- NEC Corporation
- TP-Link Corporation Ltd.
- A10 Networks Inc.
- Radware Ltd.
- Moxa Inc.
- EdgeCore Networks Corp.
- Nokia Corp.
- FiberHome Telecommunication Technologies Co. Ltd.
- Check Point Software Technologies Ltd.
- Palo Alto Networks Inc.
- Ciena Corp.
- Mellanox Technologies Ltd. (NVIDIA)
- Super Micro Computer Inc.
- Ubiquiti Inc.
- NetScout Systems Inc.
- F5 Inc.
Additional Benefits:
- The market estimate (ME) sheet in Excel format
- 3 months of analyst support
TABLE OF CONTENTS
1 INTRODUCTION
- 1.1 Study Assumptions and Market Definition
- 1.2 Scope of the Study
2 RESEARCH METHODOLOGY
3 EXECUTIVE SUMMARY
4 MARKET LANDSCAPE
- 4.1 Market Overview
- 4.2 Market Drivers
- 4.2.1 Increasing need for cloud storage and reliable application performance
- 4.2.2 Rising cyber-attacks among enterprises
- 4.2.3 Proliferation of hyperscale data-center builds by global cloud providers
- 4.2.4 Surge in submarine-cable landings enabling low-latency coastal hubs
- 4.2.5 Brazil's renewable-energy incentives for green networking upgrades
- 4.2.6 Adoption of open networking (white-box + SONiC) cutting CAPEX
- 4.3 Market Restraints
- 4.3.1 Increasing network complexity
- 4.3.2 High import tariffs and CAPEX for advanced equipment
- 4.3.3 Shortage of automation-skilled network engineers
- 4.3.4 Fragmented data-sovereignty regulations across South America
- 4.4 Supply-Chain Analysis
- 4.5 Regulatory Landscape
- 4.6 Technological Outlook
- 4.7 Porter's Five Forces Analysis
- 4.7.1 Threat of New Entrants
- 4.7.2 Bargaining Power of Buyers
- 4.7.3 Bargaining Power of Suppliers
- 4.7.4 Threat of Substitutes
- 4.7.5 Intensity of Competitive Rivalry
- 4.8 Assessment of Macroeconomic Factors
5 MARKET SIZE and GROWTH FORECASTS
- 5.1 By Component
- 5.1.1 Products
- 5.1.1.1 Ethernet Switches
- 5.1.1.2 Routers
- 5.1.1.3 Storage Area Network (SAN)
- 5.1.1.4 Application Delivery Controllers (ADC)
- 5.1.1.5 Network Security Appliances
- 5.1.1.6 Software-Defined Networking (SDN) Controllers
- 5.1.1.7 Optical Interconnects
- 5.1.2 Services
- 5.1.2.1 Installation and Integration
- 5.1.2.2 Training and Consulting
- 5.1.2.3 Support and Maintenance
- 5.1.2.4 Managed Network Services
- 5.1.1 Products
- 5.2 By End-User
- 5.2.1 IT and Telecommunications
- 5.2.2 Banking, Financial Services and Insurance (BFSI)
- 5.2.3 Government and Defense
- 5.2.4 Media and Entertainment
- 5.2.5 Healthcare and Life Sciences
- 5.2.6 Manufacturing and Industrial
- 5.2.7 Other End-Users
- 5.3 By Data-Center Type
- 5.3.1 Colocation
- 5.3.2 Hyperscalers/Cloud Service Providers
- 5.3.3 Edge/Micro Data Centers
- 5.4 By Bandwidth
- 5.4.1 Less than or Equal to 10 GbE
- 5.4.2 25-40 GbE
- 5.4.3 50-100 GbE
- 5.4.4 Greater than 100 GbE
- 5.5 By Country
- 5.5.1 Brazil
- 5.5.2 Mexico
- 5.5.3 Argentina
- 5.5.4 Rest of South America
6 COMPETITIVE LANDSCAPE
- 6.1 Market Concentration
- 6.2 Strategic Moves
- 6.3 Market Share Analysis
- 6.4 Company Profiles (includes Global level Overview, Market level overview, Core Segments, Financials as available, Strategic Information, Market Rank/Share for key companies, Products and Services, and Recent Developments)
- 6.4.1 Cisco Systems Inc.
- 6.4.2 Huawei Technologies Co. Ltd.
- 6.4.3 Juniper Networks Inc.
- 6.4.4 Hewlett Packard Enterprise Development LP
- 6.4.5 Arista Networks Inc.
- 6.4.6 Dell Technologies Inc. (Dell EMC)
- 6.4.7 Extreme Networks Inc.
- 6.4.8 Fortinet Inc.
- 6.4.9 VMware Inc.
- 6.4.10 NEC Corporation
- 6.4.11 TP-Link Corporation Ltd.
- 6.4.12 A10 Networks Inc.
- 6.4.13 Radware Ltd.
- 6.4.14 Moxa Inc.
- 6.4.15 EdgeCore Networks Corp.
- 6.4.16 Nokia Corp.
- 6.4.17 FiberHome Telecommunication Technologies Co. Ltd.
- 6.4.18 Check Point Software Technologies Ltd.
- 6.4.19 Palo Alto Networks Inc.
- 6.4.20 Ciena Corp.
- 6.4.21 Mellanox Technologies Ltd. (NVIDIA)
- 6.4.22 Super Micro Computer Inc.
- 6.4.23 Ubiquiti Inc.
- 6.4.24 NetScout Systems Inc.
- 6.4.25 F5 Inc.
7 MARKET OPPORTUNITIES and FUTURE OUTLOOK
- 7.1 White-Space and Unmet-Need Assessment