
|
시장보고서
상품코드
2119874
미국의 데이터센터 네트워킹 : 시장 점유율 분석, 업계 동향 및 통계, 성장 예측(2026-2031년)United States Data Center Networking - Market Share Analysis, Industry Trends & Statistics, Growth Forecasts (2026 - 2031) |
||||||
 Mordor Intelligence
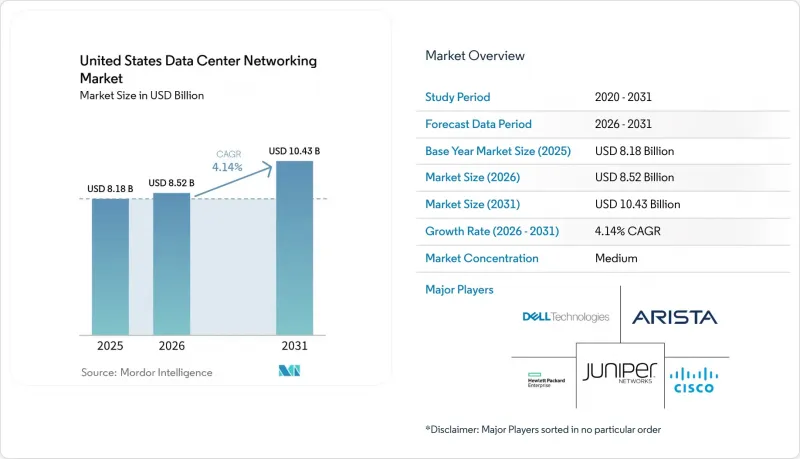
Mordor Intelligence에 의하면, 미국의 데이터센터 네트워킹 시장 규모는 2025년 81억 8,000만 달러로 평가되었습니다. 2026년에는 85억 2,000만 달러로 확대되어 2026-2031년에 걸쳐 CAGR 4.14%로 성장을 지속하여, 2031년에는 104억 3,000만 달러에 이를 것으로 예측됩니다.
본 보고서는 구성 요소(제품 및 서비스), 최종 사용자(IT 및 통신, 은행 및 금융 서비스·보험(BFSI),정부·국방, 기타), 데이터센터 유형(코로케이션, 하이퍼스케일러·클라우드 서비스 제공업체, 엣지·마이크로 데이터센터), 대역폭(10GbE 이하, 25-40GbE, 기타)별로 분류되어 있습니다. 시장 예측은 금액(미 달러) 기준으로 제시되어 있습니다.
미국의 데이터센터 네트워킹 시장 동향 및 인사이트
하이퍼스케일 및 AI 주도 대역폭 수요의 급증
하이퍼스케일 사업자들은 기존 용도에 비해 10-100배 많은 데이터를 처리하는 AI 워크로드를 지원하기 위해 네트워크 재구축을 추진하고 있습니다. Meta가 훈련 클러스터용으로 Arista 7700R4 플랫폼을 채택한 것은 분산형 GPU의 지연을 줄여주는 논블로킹 테라비트급 이스트-웨스트 패브릭이 보급되고 있음을 보여줍니다. 마이크로소프트의 800억 달러 규모 AI 인프라 구축과 AWS의 300억 달러 규모 확장은 AI 전용 스위치, 광 모듈, NIC에 대한 장비 수요의 급증을 뒷받침하고 있습니다. NVIDIA와 AMD의 맞춤형 실리콘은 범용 디바이스를 피하고, 긴밀하게 통합된 800G 부품을 우선시하려는 사업자들의 의향을 여실히 드러내고 있습니다.
400G/800G 이더넷 패브릭으로의 전환
400G 및 800G로의 전환은 10GbE 이후 가장 큰 도약이며, 100G 링크를 포화시키는 GPU 클러스터에 의해 주도되고 있습니다. Broadcom의 ‘Tomahawk 6’은 향후 확장 가능성을 염두에 두고 1.6Tb/s 포트를 지원합니다. 울트라 이더넷 컨소시엄(UEC)은 2025년 6월 UEC 1.0을 승인하며, AI 트래픽에 특화된 패킷 스프레이잉과 네트워크 내 연산 기능을 추가했습니다. 도입에 있어서는 800G 광 모듈의 리드타임이 18개월이 소요되므로, 2026년에 생산이 본격화될 때까지 일부 하이퍼스케일 구축에 제약이 따를 것입니다.
광트랜시버 및 ASIC 공급 병목 현상
각 제조업체가 초저지터 AI 등급 광 모듈을 우선시하고 있어, 800G 모듈의 리드타임은 18개월까지 늘어났습니다. Lumentum은 이 틈새 시장에 대응하기 위해 로드맵을 수정하고 있으며, 기존 트랜시버 제품 라인공급 부족이 두드러지고 있습니다. 관세의 영향으로 장비 비용이 8-20% 상승함에 따라, 일부 기업은 업그레이드를 연기하고 100G 자산을 계획보다 더 오랫동안 계속 사용해야 하는 상황에 처해 있습니다.
부문 분석
각 하이퍼스케일러 기업들이 수천 대의 고정 폼 팩터 스위치를 구매함에 따라, 제품 부문은 2025년 매출의 77.60%를 계속 차지했습니다. 이더넷 스위치는 여전히 주력 카테고리로 남아 있었지만, 운영 자동화 측면에서 소프트웨어 정의형 컨트롤러가 지지를 얻었습니다. 고속 광통신을 통해 컴퓨팅과 스토리지를 분리하는 디어그리게이션 아키텍처의 보급에 따라, 스토리지 영역 네트워크(SAN) 장비의 성장세는 둔화되었습니다. 제로 트러스트 설계에서는 광범위한 세분화가 요구되기 때문에 네트워크 보안 어플라이언스가 다시 주목을 받았습니다.
서비스 부문은 고객이 멀티벤더 400G/800G 패브릭을 위한 설계, 통합, 관리형 지원을 요구하는 가운데 연평균 성장률(CAGR) 4.32%로 성장하고 있습니다. 설치 팀은 타이밍에 민감한 광 모듈을 조정하고 있으며, 관리형 서비스는 사내 자동화 기술 부족을 보완하고 있습니다. 교육 및 컨설팅 기업들은 AI에 특화된 네트워크 튜닝과 관련된 인력 부족 심화에 대응하고 있습니다. 미국의 데이터센터 네트워킹 시장에서는 성과 기반 계약 하에 하드웨어, 광 모듈, 전문 지식을 묶어 제공하는 업체들이 점점 더 우대를 받고 있습니다.
IT 및 통신 사업자는 초기 단계의 5G 코어 구축과 퍼블릭 클라우드 백본 개편을 주도하며, 2025년에도 34.15%의 점유율을 유지했습니다. 이에 이어 금융 기관이 알고리즘 트레이딩를 위한 저지연 채널 업그레이드를 추진하고 있습니다. 한편, 제조업에서는 인더스트리 4.0을 지원하는 공장이 실시간 분석 및 로봇 생산 라인으로의 개조를 추진함에 따라 5.08%의 연평균 성장률(CAGR)을 기록하고 있습니다. 주요 자동차 제조업체들은 산업용 프로토콜과 엔터프라이즈 트래픽을 융합한 결정론적 패브릭을 도입하고 있습니다.
정부 및 국방 기관은 기밀 네트워크를 현대화하여 안전한 AI 모델 훈련을 실현하고 있습니다. 의료 서비스 제공업체는 영상 진단 및 전자 건강 기록을 위해 대역폭을 확대되고 있습니다. 미디어 플레이어들은 버스트 용량과 지터 제어가 필요한 4K/8K 파이프라인을 추진하고 있습니다. 따라서 미국의 데이터센터 네트워킹 시장은 통신 사업자가 주도하는 단일 영역이라기보다는 산업별 이용 사례가 모인 형태로 변화하고 있습니다.
기타 혜택
- 엑셀 형식 시장 예측(ME) 시트
- 3개월간의 애널리스트 지원
자주 묻는 질문
목차
제1장 서론
제2장 조사 방법
제3장 주요 요약
제4장 시장 구도
제5장 시장 규모 및 성장 예측
제6장 경쟁 구도
제7장 시장 기회 및 향후 전망
KTHAccording to Mordor Intelligence, the United States data center networking market size is expected to grow from USD 8.18 billion in 2025 to USD 8.52 billion in 2026 and is forecast to reach USD 10.43 billion by 2031 at 4.14% CAGR over 2026-2031.
This report is Segmented by Component (Product, and Services), End User (IT and Telecommunications, Banking, Financial Services and Insurance (BFSI), Government and Defense, and More), Data Center Type (Colocation, Hyperscalers/Cloud Service Providers, and Edge/Micro Data Centers), Bandwidth (<=10 GbE, 25-40 GbE, and More). The Market Forecasts are Provided in Terms of Value (USD).
United States Data Center Networking Market Trends and Insights
Surge in Hyperscale and AI-driven Bandwidth Demand
Hyperscale operators are rebuilding networks to serve AI workloads that move 10-100 times more data than legacy applications. Meta's adoption of Arista 7700R4 platforms for training clusters highlights the spread of non-blocking, terabit-scale east-west fabrics that reduce latency for distributed GPUs. Microsoft's USD 80 billion AI build-out and AWS's USD 30 billion expansion reinforce the steep equipment pull for AI-specific switches, optics, and NICs. Custom silicon from NVIDIA and AMD underlines operators' desire to bypass general-purpose devices in favor of tightly integrated 800G parts.
Migration to 400G/800G Ethernet Fabrics
The jump to 400G and 800G is the largest step since 10 GbE, driven by GPU clusters that saturate 100G links. Broadcom's Tomahawk 6 supports 1.6 Tb/s ports, anticipating future headroom. The Ultra Ethernet Consortium ratified UEC 1.0 in June 2025, adding packet-spraying and in-network compute specifically for AI traffic. Rollouts face 18-month lead times for 800G optics, constraining some hyperscale buildouts until production ramps in 2026.
Optical Transceiver and ASIC Supply Bottlenecks
Lead times on 800G modules have stretched to 18 months as manufacturers prioritize AI-grade optics with ultra-low jitter. Lumentum shifted its roadmap to serve this niche, demonstrating the squeeze on conventional transceiver lines. Tariff impacts added 8-20% to equipment costs, prompting some enterprises to defer upgrades and sweat 100G assets longer than planned.
Other drivers and restraints analyzed in the detailed report include:
- Expansion of Edge and 5G Micro-data-centers
- State Energy-efficiency Incentives for Smart Fabrics
- High Capex for Legacy 10/40 G above 400 G Upgrades
For complete list of drivers and restraints, kindly check the Table Of Contents.
Segment Analysis
Products continued to hold 77.60% of 2025 revenue as hyperscalers bought thousands of fixed-form-factor switches. Ethernet switches remained the anchor category, while software-defined controllers gained favor for policy automation. Storage-area networking equipment lost momentum as disaggregated architectures separated compute and storage across high-speed optics. Network security appliances regained focus because zero-trust designs require pervasive segmentation.
The services slice is climbing at a 4.32% CAGR as clients seek design, integration, and managed support for multi-vendor 400G/800G fabrics. Installation teams coordinate timing-sensitive optics, while managed services offset scarce in-house automation skills. Training and consulting firms address a widening talent gap around AI-specific network tuning. The United States data center networking market increasingly rewards providers that bundle hardware, optics, and expertise under outcome-based contracts.
IT-telecom operators retained a 34.15% share in 2025, anchored by early 5G core deployments and public-cloud backbone refreshes. Financial institutions followed, upgrading latency paths for algorithmic trading. Manufacturing, however, is posting a 5.08% CAGR as Industry 4.0 plants retrofit with real-time analytics and robotic lines. Automotive giants are installing deterministic fabrics that blend industrial protocols with enterprise traffic.
Government and defense agencies are modernizing classified networks to enable secure AI model training. Healthcare providers expand bandwidth for diagnostic imaging and electronic records. Media firms push 4K/8K pipelines that need burst capacity and jitter control. The United States data center networking market is therefore becoming a patchwork of vertical use cases rather than a monolithic telecom-led domain.
Complete Report Scope:
- By Component
- Products
- Ethernet Switches
- Routers
- Storage Area Network (SAN)
- Application Delivery Controllers (ADC)
- Network Security Appliances
- Software-Defined Networking (SDN) Controllers
- Optical Interconnects
- Services
- Installation and Integration
- Training and Consulting
- Support and Maintenance
- Managed Network Services
- Products
- By End-User
- IT and Telecommunications
- Banking, Financial Services and Insurance (BFSI)
- Government and Defense
- Media and Entertainment
- Healthcare and Life Sciences
- Manufacturing and Industrial
- Other End-Users
- By Data-Center Type
- Colocation
- Hyperscalers/Cloud Service Providers
- Edge/Micro Data Centers
- By Bandwidth
- Less Than or Equal to 10 GbE
- 25-40 GbE
- 50-100 GbE
- Greater Than 100 GbE
List of Companies Covered in this Report:
- Cisco Systems, Inc.
- Arista Networks, Inc.
- Juniper Networks, Inc.
- Dell Technologies, Inc.
- Hewlett Packard Enterprise (HPE)
- NVIDIA Corp. (Mellanox and Cumulus)
- Intel Corporation
- Broadcom Inc.
- Extreme Networks, Inc.
- Microsoft (SONiC Open-Source)
- VMware by Broadcom
- Huawei Technologies Co., Ltd.
- IBM Corporation
- Schneider Electric SE
- Eaton Corporation plc
- Emerson Electric Co.
- NetApp, Inc.
- Super Micro Computer, Inc.
- Nvidia Networking (Infiniband)
- Equinix, Inc. (Interconnection)
- Digital Realty Trust, Inc.
- Panduit Corp.
- CommScope Holding Co., Inc.
Additional Benefits:
- The market estimate (ME) sheet in Excel format
- 3 months of analyst support
TABLE OF CONTENTS
1 INTRODUCTION
- 1.1 Study Assumptions and Market Definition
- 1.2 Scope of the Study
2 RESEARCH METHODOLOGY
3 EXECUTIVE SUMMARY
4 MARKET LANDSCAPE
- 4.1 Market Overview
- 4.2 Market Drivers
- 4.2.1 Surge in hyperscale and AI-driven bandwidth demand
- 4.2.2 Migration to 400G/800G Ethernet fabrics
- 4.2.3 Expansion of edge and 5G micro-data-centers
- 4.2.4 State energy-efficiency incentives for smart fabrics
- 4.2.5 Adoption of CXL-enabled disaggregated architectures
- 4.2.6 Zero-trust push driving fabric-level micro-segmentation
- 4.3 Market Restraints
- 4.3.1 Optical transceiver and ASIC supply bottlenecks
- 4.3.2 High capex for legacy 10/40 G above 400 G upgrades
- 4.3.3 Rising water-usage limits curbing hyperscale expansion
- 4.3.4 Scarcity of automation-skilled network engineers
- 4.4 Supply-Chain Analysis
- 4.5 Regulatory Landscape
- 4.6 Technological Outlook
- 4.7 Porter's Five Forces Analysis
- 4.7.1 Threat of New Entrants
- 4.7.2 Bargaining Power of Buyers
- 4.7.3 Bargaining Power of Suppliers
- 4.7.4 Threat of Substitutes
- 4.7.5 Intensity of Competitive Rivalry
- 4.8 Assesment of Macroeconomic Factors on the Market
5 MARKET SIZE AND GROWTH FORECASTS (VALUE)
- 5.1 By Component
- 5.1.1 Products
- 5.1.1.1 Ethernet Switches
- 5.1.1.2 Routers
- 5.1.1.3 Storage Area Network (SAN)
- 5.1.1.4 Application Delivery Controllers (ADC)
- 5.1.1.5 Network Security Appliances
- 5.1.1.6 Software-Defined Networking (SDN) Controllers
- 5.1.1.7 Optical Interconnects
- 5.1.2 Services
- 5.1.2.1 Installation and Integration
- 5.1.2.2 Training and Consulting
- 5.1.2.3 Support and Maintenance
- 5.1.2.4 Managed Network Services
- 5.1.1 Products
- 5.2 By End-User
- 5.2.1 IT and Telecommunications
- 5.2.2 Banking, Financial Services and Insurance (BFSI)
- 5.2.3 Government and Defense
- 5.2.4 Media and Entertainment
- 5.2.5 Healthcare and Life Sciences
- 5.2.6 Manufacturing and Industrial
- 5.2.7 Other End-Users
- 5.3 By Data-Center Type
- 5.3.1 Colocation
- 5.3.2 Hyperscalers/Cloud Service Providers
- 5.3.3 Edge/Micro Data Centers
- 5.4 By Bandwidth
- 5.4.1 Less Than or Equal to 10 GbE
- 5.4.2 25-40 GbE
- 5.4.3 50-100 GbE
- 5.4.4 Greater Than 100 GbE
6 COMPETITIVE LANDSCAPE
- 6.1 Market Concentration
- 6.2 Strategic Moves
- 6.3 Market Share Analysis
- 6.4 Company Profiles (includes Global level Overview, Market level overview, Core Segments, Financials as available, Strategic Information, Market Rank/Share for key companies, Products and Services, and Recent Developments)
- 6.4.1 Cisco Systems, Inc.
- 6.4.2 Arista Networks, Inc.
- 6.4.3 Juniper Networks, Inc.
- 6.4.4 Dell Technologies, Inc.
- 6.4.5 Hewlett Packard Enterprise (HPE)
- 6.4.6 NVIDIA Corp. (Mellanox and Cumulus)
- 6.4.7 Intel Corporation
- 6.4.8 Broadcom Inc.
- 6.4.9 Extreme Networks, Inc.
- 6.4.10 Microsoft (SONiC Open-Source)
- 6.4.11 VMware by Broadcom
- 6.4.12 Huawei Technologies Co., Ltd.
- 6.4.13 IBM Corporation
- 6.4.14 Schneider Electric SE
- 6.4.15 Eaton Corporation plc
- 6.4.16 Emerson Electric Co.
- 6.4.17 NetApp, Inc.
- 6.4.18 Super Micro Computer, Inc.
- 6.4.19 Nvidia Networking (Infiniband)
- 6.4.20 Equinix, Inc. (Interconnection)
- 6.4.21 Digital Realty Trust, Inc.
- 6.4.22 Panduit Corp.
- 6.4.23 CommScope Holding Co., Inc.
7 MARKET OPPORTUNITIES AND FUTURE OUTLOOK
- 7.1 White-space and Unmet-Need Assessment