
|
시장보고서
상품코드
2119784
데이터센터 네트워킹 : 시장 점유율 분석, 업계 동향 및 통계, 성장 예측(2026-2031년)Data Center Networking - Market Share Analysis, Industry Trends & Statistics, Growth Forecasts (2026 - 2031) |
||||||
 Mordor Intelligence
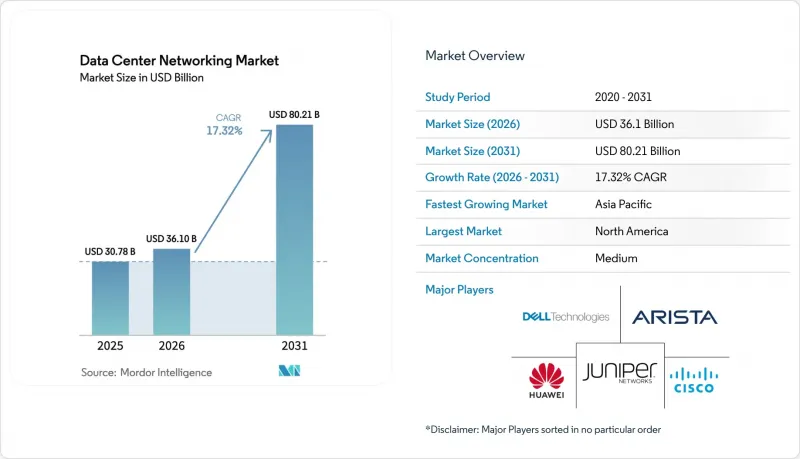
Mordor Intelligence에 의하면, 세계의 데이터센터 네트워킹 시장 규모는 2025년 307억 8,000만 달러로 평가되었습니다. 2026년에는 361억 달러로 확대되어 2026-2031년에 걸쳐 CAGR 17.32%로 성장을 지속하여, 2031년에는 802억 1,000만 달러에 이를 것으로 예측됩니다.
본 보고서는 구성 요소(제품 및 서비스), 최종 사용자(IT 및 통신, 은행 및 금융 서비스·보험(BFSI), 정부·국방, 기타),데이터센터 유형(코로케이션, 하이퍼스케일러·클라우드 서비스 제공업체, 엣지·마이크로 데이터센터), 대역폭(10GbE 이하, 25-40GbE, 기타), 지역별로 분류되어 있습니다. 시장 예측은 금액(달러) 기준으로 제시되어 있습니다.
세계의 데이터센터 네트워킹 시장 동향 및 인사이트
확대되는 ‘클라우드 퍼스트’ 기업 IT 전략
허브 앤 스포크형 설계에서 마이크로서비스로 전환하는 기업에서는 예측 불가능한 트래픽의 급증 현상이 발생하고 있으며, 이에 대응하기 위해서는 소프트웨어 정의 오버레이와 실시간 텔레메트리가 요구되고 있습니다. 금융 기관이 클라우드 예산을 확대함에 따라 프로그래머블 스위치, 클라우드 네이티브 방화벽, 제로 트러스트 기반 세분화이 필수 요소로 대두되고 있습니다. 이러한 요인으로 인해 400GbE 리프-스파인 패브릭과 지연 핫스팟을 감지하여 시정하는 분석 엔진의 업데이트 주기가 유지되고 있습니다.
AI·ML에 의한 이스트-웨스트 트래픽의 급증
GPU 클러스터는 기존 워크로드에 비해 최대 100배에 달하는 볼륨으로 기울기 및 매개변수를 전송하기 때문에 기존의 노스-사우스형 아키텍처로는 처리할 수 없습니다. 우선순위 흐름 제어(Priority Flow Control)와 명시적 혼잡 알림(Explicit Congestion Notification) 기능을 갖춘 RoCE-v2는 집합적 연산 처리 중 발생하는 패킷 손실을 방지합니다. 한편, 800G 및 1.6T 인터페이스에 대한 수요 증가가 상용 실리콘의 혁신을 가속화하고 있습니다. Tier 2 클라우드에서는 비용과 상호 운용성의 균형을 맞추기 위해 독자적인 규격의 전송 방식 대신 이더넷을 채택하고 있습니다.
다중 벤더 간 상호 운용성 과제
독자적인 프로토콜의 확산은 스위치, 광 모듈, 텔레메트리 에이전트 간의 원활한 통합을 방해하며, 기업들이 고가의 검증 실험실에 투자하도록 강요하고 있습니다. 오픈 표준 컨트롤러에 대한 지원 지연은 전환 기간을 연장하고 운영상의 사일로화를 초래합니다. 특히 AI 클러스터가 이종 패브릭 간에 결정론적 지연 시간을 보장해야 하는 경우, 그 영향은 현저합니다.
부문 분석
2025년, 데이터센터 네트워킹 시장 매출의 74.72%를 제품 부문이 차지했으며, 그 주도적 역할을 한 것은 AI 워크로드를 처리하기 위해 100G에서 400G로 전환된 이더넷 스위치였습니다. 광 인터커넥트, 스토리지 패브릭,용도 전달 컨트롤러는 제품 부문의 우위를 공고히 했으나, 기업들이 아키텍처 단순화에 주력함에 따라 현재는 판매량 증가세가 둔화되고 있습니다. 각 벤더들은 GPU 클러스터 확대에 따라 51.2Tbps 섀시 판매가 증가했다고 보고하고 있습니다.
서비스 부문은 고객이 무손실 패브릭의 설계, 통합, 라이프사이클 관리를 외부에 위탁하는 경향이 강해짐에 따라 연평균 성장률(CAGR) 17.7%를 나타낼 것으로 예측됩니다. 우선순위 흐름 제어(PFC) 튜닝 관련 도입 서비스, 혼잡 메트릭스에 대한 컨설팅, 지속적인 매니지드 패브릭 구독이 지속적인 수익의 원동력이 되고 있습니다. 기업들은 턴키 방식의 관리형 운영을 도입한 결과, 평균 구축 시간이 38% 단축되었다고 밝혔으며, 이를 통해 서비스는 AI를 통한 비즈니스 성과 달성을 위한 핵심 요소로서의 입지를 공고히 하고 있습니다.
IT 및 통신 부문은 디지털 서비스 제공을 뒷받침하는 하이퍼스케일 클라우드, CDN, 통신 사업자의 투자에 힘입어 2025년에는 데이터센터 네트워킹 시장의 35.75%를 차지했습니다. 메트로 캠퍼스 전역의 지역별 소비에서는 은행, 미디어 스트리밍, 전자상거래 워크로드가 주류를 이루고 있습니다.
제조·산업 부문은 예측 유지보수 알고리즘이 중앙 집중형 클라우드에서 공장 현장의 마이크로 데이터센터로 이전됨에 따라, 2031년까지 연평균 성장률(CAGR) 18.05%로 성장할 전망입니다. 저지연 이더넷 패브릭이 로봇,머신 비전 카메라, MES 용도를 연결하여 가동 중단 시간과 에너지 낭비를 줄입니다. 엣지 네이티브 네트워킹 계약 건수는 2023년 이후 2.4배 증가했으며, 이는 콤팩트하고 팬이 없는 400GbE 리프 스위치에 대한 지속적인 수요를 뒷받침하고 있습니다.
지역별 분석
데이터센터 네트워킹 시장이 수십억 달러 규모의 하이퍼스케일 확장에 대응하기 위해 성장하는 가운데, 2025년 매출의 26.05%를 북미가 차지했습니다. 미국이 지역별 자본 지출(CAPEX)을 주도하는 한편, 캐나다의 엣지 클라우드 사업자와 멕시코의 니어쇼어 캠퍼스가 수요 증가에 기여하고 있습니다. 현지 장비 제조업체들은 유리한 세제 혜택과 탄소 강도가 매우 낮은 전력망의 이점을 누리고 있습니다. 아시아태평양은 2031년 연평균 성장률(CAGR)이 17.55%로 가장 빠르게 성장하는 지역이며, 이는 국내 처리를 우선시하는 각국의 AI 전략을 반영하고 있습니다. 중국의 ‘동부 데이터, 서부 컴퓨팅’이라는 백본은 8개의 사막 지역에 위치한 하이퍼스케일 허브를 연안 지역의 상호 연결망과 연결하여 트랜시버의 대량 조달을 촉진하고 있습니다. 인도의 경우 2025년에 IT 부하 설치 용량이 950MW를 넘어섰으며, 코로케이션 시설과 통신 사업자의 엣지 사이트 모두에서 400GbE 패브릭에 대한 수요가 급증하고 있습니다. 인도네시아와 베트남 등 시장에서는 지원적인 규제 체계와 지역 해저 케이블에 대한 투자로 인해 이러한 성장세가 더욱 강화되고 있습니다.
기타 혜택
- 엑셀 형식 시장 예측(ME) 시트
- 3개월간의 애널리스트 지원
자주 묻는 질문
목차
제1장 서론
제2장 조사 방법
제3장 주요 요약
제4장 시장 구도
제5장 시장 규모 및 성장 예측
제6장 경쟁 구도
제7장 시장 기회 및 향후 전망
KTHAccording to Mordor Intelligence, the global data center networking market size is expected to grow from USD 30.78 billion in 2025 to USD 36.1 billion in 2026 and is forecast to reach USD 80.21 billion by 2031 at 17.32% CAGR over 2026-2031.
This report is Segmented by Component (Product and Services), End User( IT and Telecommunications, Banking, Financial Services and Insurance (BFSI), Government and Defense and More), Data Center Type (Colocation, Hyperscalers/Cloud Service Providers, Edge/Micro Data Centers), by Bandwidth (<=10 GbE, 25-40 GbE and More) and by Geography. The Market Forecasts are Provided in Terms of Value (USD).
Global Data Center Networking Market Trends and Insights
Growing Cloud-First Enterprise IT Strategies
Enterprises replacing hub-and-spoke designs with micro-services generate unpredictable traffic bursts that demand software-defined overlays and realtime telemetry. Programmable switches, cloud-native firewalls, and zero-trust segmentation become mandatory as financial institutions expand cloud budgets. This driver sustains refresh cycles for 400 GbE leaf-spine fabrics and analytics engines that discover and remediate latency hotspots.
AI/ML East-West Traffic Surge
GPU clusters move gradients and parameters at volumes up to 100 times higher than legacy workloads, overwhelming conventional north-south architectures. RoCE-v2 with Priority Flow Control and Explicit Congestion Notification prevents packet loss during collective operations, while demand for 800 G and 1.6 T interfaces accelerates merchant-silicon innovation. Tier-2 clouds adopt Ethernet rather than proprietary transports to balance cost and interoperability.
Multi-Vendor Interoperability Issues
Proprietary protocol extensions impede seamless integration across switches, optics, and telemetry agents, forcing enterprises to invest in costly validation labs. Delays in open-standard controller support extend migration timelines and create operational silos, particularly where AI clusters require deterministic latency guarantees across dissimilar fabrics.
Other drivers and restraints analyzed in the detailed report include:
- Telecom-Led Edge Data-Center Build-Outs
- 400 GbE Port Price Erosion
- Rising Network Complexity and Skill Gaps
For complete list of drivers and restraints, kindly check the Table Of Contents.
Segment Analysis
Products retained 74.72% of data center networking market revenue in 2025, led by Ethernet switches that transitioned from 100 G to 400 G to satisfy AI workloads. Optical interconnects, storage fabrics, and application delivery controllers reinforced Product dominance but now face slowing unit growth as enterprises focus on architectural simplification. Vendors reported upticks in 51.2 Tbps chassis sales as GPU clusters expanded.
The Services segment is projected to grow at 17.7% CAGR as customers offload design, integration, and lifecycle management of lossless fabrics. Installation services for Priority Flow Control tuning, consulting on congestion metrics, and ongoing managed-fabric subscriptions fuel recurring revenue. Enterprises cite reduced mean-time-to-deploy by 38% after adopting turnkey managed operations, positioning Services as a critical enabler of AI business outcomes.
IT & Telecommunications captured 35.75% of the data center networking market in 2025 by virtue of hyperscale cloud, CDN, and telco investments that underpin digital-service delivery. Banking, media streaming, and e-commerce workloads dominate regional consumption across metro campuses.
Manufacturing & Industrial will advance at an 18.05% CAGR through 2031 as predictive-maintenance algorithms migrate from centralized clouds to factory-floor micro-data centers. Low-latency Ethernet fabrics link robotics, machine-vision cameras, and MES applications, cutting downtime and energy waste. Edge-native networking contracts have grown 2.4 times since 2023, underpinning sustained demand for compact, fanless 400 GbE leaf switches.
Complete Report Scope:
- By Component
- Products
- Ethernet Switches
- Routers
- Storage Area Network (SAN)
- Application Delivery Controllers (ADC)
- Network Security Appliances
- Software-Defined Networking (SDN) Controllers
- Optical Interconnects
- Services
- Installation and Integration
- Training and Consulting
- Support and Maintenance
- Managed Network Services
- Products
- By End-User
- IT and Telecommunications
- Banking, Financial Services and Insurance (BFSI)
- Government and Defense
- Media and Entertainment
- Healthcare and Life Sciences
- Manufacturing and Industrial
- Other End-Users
- By Data-Center Type
- Colocation
- Hyperscalers/Cloud Service Providers
- Edge/Micro Data Centers
- By Bandwidth
- Less than 10 GbE
- 25-40 GbE
- 50-100 GbE
- Greater than 100 GbE
- By Geography
- North America
- United States
- Canada
- Mexico
- South America
- Brazil
- Argentina
- Rest of South America
- Europe
- Germany
- United Kingdom
- France
- Netherlands
- Rest of Europe
- Asia-Pacific
- China
- Japan
- India
- South Korea
- Australia and New Zealand
- Rest of Asia-Pacific
- Middle East and Africa
- Middle East
- United Arab Emirates
- Saudi Arabia
- Turkey
- Rest of Middle East
- Africa
- South Africa
- Nigeria
- Rest of Africa
- Middle East
- North America
Geography Analysis
North America controlled 26.05% of 2025 revenue as the data center networking market scaled to support multi-billion-dollar hyperscale expansions. The United States dominates regional capex, while Canadian edge-cloud operators and Mexican near-shore campuses contribute incremental demand. Local equipment manufacturers benefit from favorable tax incentives and ultra-low carbon-intensity power grids.Asia-Pacific is the fastest-growing territory with a 17.55% CAGR through 2031, reflecting sovereign AI strategies that favor domestic processing. China's Eastern-Data-Western-Compute backbone aligns eight desert-region hyperscale hubs with coastal interconnects, driving bulk transceiver procurement. India exceeded 950 MW installed IT load in 2025, triggering step-function demand for 400 GbE fabrics across both colocation and telco edge sites. Markets such as Indonesia and Vietnam reinforce the growth wave with supportive regulatory frameworks and regional subsea-cable investments.
- Cisco Systems Inc.
- Arista Networks Inc.
- Juniper Networks Inc.
- Huawei Technologies Co. Ltd.
- Dell Technologies (Dell EMC)
- Extreme Networks Inc.
- Hewlett Packard Enterprise (HPE)
- Lenovo Group Ltd.
- NEC Corporation
- NVIDIA Corp. (Cumulus and Mellanox)
- Broadcom Inc.
- Intel Corp.
- Fortinet Inc.
- F5 Inc.
- Radware Ltd.
- A10 Networks Inc.
- Check Point Software Technologies
- Palo Alto Networks Inc.
- Array Networks Inc.
- Moxa Inc.
- Supermicro (Super Micro Computer Inc.)
- Edgecore Networks Corp.
- H3C Holding Ltd.
- NetApp Inc.
- Keysight Technologies Inc.
Additional Benefits:
- The market estimate (ME) sheet in Excel format
- 3 months of analyst support
TABLE OF CONTENTS
1 INTRODUCTION
- 1.1 Study Assumptions and Market Definition
- 1.2 Scope of the Study
2 RESEARCH METHODOLOGY
3 EXECUTIVE SUMMARY
4 MARKET LANDSCAPE
- 4.1 Market Overview
- 4.2 Market Drivers
- 4.2.1 Growing cloud?first enterprise IT strategies
- 4.2.2 Surge in East-West traffic owing to AI / ML workloads
- 4.2.3 Edge data-centre build-outs by telecom operators
- 4.2.4 400 GbE port price erosion improves RoI
- 4.2.5 Adoption of lossless Ethernet for accelerated computing
- 4.2.6 Hyperscalers open-source network OS contributions
- 4.3 Market Restraints
- 4.3.1 Multi-vendor interoperability challenges
- 4.3.2 Rising network complexity and skill gaps
- 4.3.3 Supply-chain risk for merchant silicon
- 4.3.4 Escalating data-centre power density limits port upgrades
- 4.4 Supply-Chain Analysis
- 4.5 Regulatory Landscape
- 4.6 Technological Outlook
- 4.7 Porter's Five Forces
- 4.7.1 Threat of New Entrants
- 4.7.2 Bargaining Power of Buyers
- 4.7.3 Bargaining Power of Suppliers
- 4.7.4 Threat of Substitutes
- 4.7.5 Intensity of Competitive Rivalry
- 4.8 Assessment of Macroeocnomic Factors on the Market
5 MARKET SIZE and GROWTH FORECASTS (VALUE)
- 5.1 By Component
- 5.1.1 Products
- 5.1.1.1 Ethernet Switches
- 5.1.1.2 Routers
- 5.1.1.3 Storage Area Network (SAN)
- 5.1.1.4 Application Delivery Controllers (ADC)
- 5.1.1.5 Network Security Appliances
- 5.1.1.6 Software-Defined Networking (SDN) Controllers
- 5.1.1.7 Optical Interconnects
- 5.1.2 Services
- 5.1.2.1 Installation and Integration
- 5.1.2.2 Training and Consulting
- 5.1.2.3 Support and Maintenance
- 5.1.2.4 Managed Network Services
- 5.1.1 Products
- 5.2 By End-User
- 5.2.1 IT and Telecommunications
- 5.2.2 Banking, Financial Services and Insurance (BFSI)
- 5.2.3 Government and Defense
- 5.2.4 Media and Entertainment
- 5.2.5 Healthcare and Life Sciences
- 5.2.6 Manufacturing and Industrial
- 5.2.7 Other End-Users
- 5.3 By Data-Center Type
- 5.3.1 Colocation
- 5.3.2 Hyperscalers/Cloud Service Providers
- 5.3.3 Edge/Micro Data Centers
- 5.4 By Bandwidth
- 5.4.1 Less than 10 GbE
- 5.4.2 25-40 GbE
- 5.4.3 50-100 GbE
- 5.4.4 Greater than 100 GbE
- 5.5 By Geography
- 5.5.1 North America
- 5.5.1.1 United States
- 5.5.1.2 Canada
- 5.5.1.3 Mexico
- 5.5.2 South America
- 5.5.2.1 Brazil
- 5.5.2.2 Argentina
- 5.5.2.3 Rest of South America
- 5.5.3 Europe
- 5.5.3.1 Germany
- 5.5.3.2 United Kingdom
- 5.5.3.3 France
- 5.5.3.4 Netherlands
- 5.5.3.5 Rest of Europe
- 5.5.4 Asia-Pacific
- 5.5.4.1 China
- 5.5.4.2 Japan
- 5.5.4.3 India
- 5.5.4.4 South Korea
- 5.5.4.5 Australia and New Zealand
- 5.5.4.6 Rest of Asia-Pacific
- 5.5.5 Middle East and Africa
- 5.5.5.1 Middle East
- 5.5.5.1.1 United Arab Emirates
- 5.5.5.1.2 Saudi Arabia
- 5.5.5.1.3 Turkey
- 5.5.5.1.4 Rest of Middle East
- 5.5.5.2 Africa
- 5.5.5.2.1 South Africa
- 5.5.5.2.2 Nigeria
- 5.5.5.2.3 Rest of Africa
- 5.5.5.1 Middle East
- 5.5.1 North America
6 COMPETITIVE LANDSCAPE
- 6.1 Market Concentration
- 6.2 Strategic Moves
- 6.3 Market Share Analysis
- 6.4 Company Profiles (includes Global level Overview, Market level overview, Core Segments, Financials as available, Strategic Information, Market Rank/Share for key companies, Products and Services, Recent Developments)
- 6.4.1 Cisco Systems Inc.
- 6.4.2 Arista Networks Inc.
- 6.4.3 Juniper Networks Inc.
- 6.4.4 Huawei Technologies Co. Ltd.
- 6.4.5 Dell Technologies (Dell EMC)
- 6.4.6 Extreme Networks Inc.
- 6.4.7 Hewlett Packard Enterprise (HPE)
- 6.4.8 Lenovo Group Ltd.
- 6.4.9 NEC Corporation
- 6.4.10 NVIDIA Corp. (Cumulus and Mellanox)
- 6.4.11 Broadcom Inc.
- 6.4.12 Intel Corp.
- 6.4.13 Fortinet Inc.
- 6.4.14 F5 Inc.
- 6.4.15 Radware Ltd.
- 6.4.16 A10 Networks Inc.
- 6.4.17 Check Point Software Technologies
- 6.4.18 Palo Alto Networks Inc.
- 6.4.19 Array Networks Inc.
- 6.4.20 Moxa Inc.
- 6.4.21 Supermicro (Super Micro Computer Inc.)
- 6.4.22 Edgecore Networks Corp.
- 6.4.23 H3C Holding Ltd.
- 6.4.24 NetApp Inc.
- 6.4.25 Keysight Technologies Inc.
7 MARKET OPPORTUNITIES and FUTURE OUTLOOK
- 7.1 White-space and Unmet-Need Assessment