

|
시장보고서
상품코드
2120717
미국의 재생에너지 : 시장 점유율 분석, 업계 동향과 통계, 성장 예측(2026-2031년)United States Renewable Energy - Market Share Analysis, Industry Trends & Statistics, Growth Forecasts (2026 - 2031) |
||||||
 Mordor Intelligence
미국의 재생에너지 시장 규모는 2025년에 507.67기가와트로 평가되었으며, 2026년 545.16기가와트에서 2031년까지 778.78기가와트에 달할 것으로 예측되며, 예측 기간(2026-2031년) 동안 CAGR 7.38%로 확대될 것으로 예측됩니다.
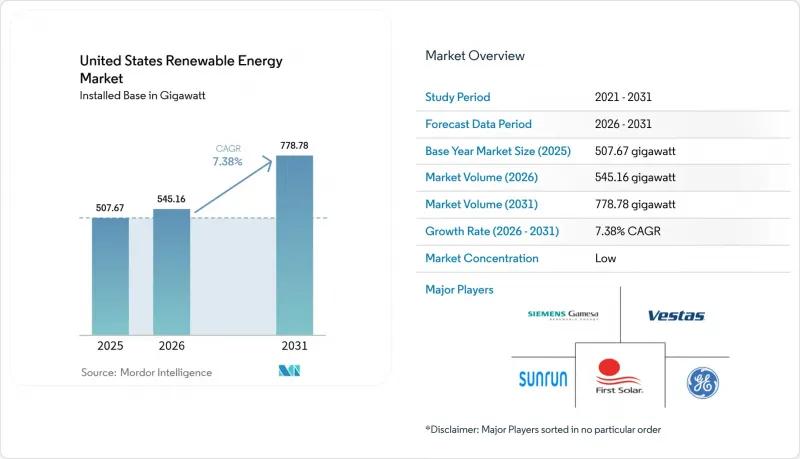
본 보고서는 기술별(태양광발전, 풍력발전, 수력발전, 바이오 에너지, 지열발전, 해양 에너지) 및 최종사용자별(공익 사업, 상업·산업, 주택)로 분류되어 있습니다. 시장 규모 및 전망은 설치 용량(GW) 단위로 표시되어 있습니다.
미국 재생에너지 시장의 동향 및 인사이트
연방 정부의 투자 세액 공제 및 생산 세액 공제 연장
태양광발전에 대한 30%의 투자 세액 공제 및 풍력발전에 대한 1MWh당 26달러의 생산 세액 공제가 2032년까지 장기적으로 확보됨에 따라, 미국의 재생에너지 시장은 꾸준한 성장 궤도를 유지하며 과거의 호황과 불황이 반복되던 패턴을 피하고 있습니다. 국내 조달률에 따른 보너스로 인해 실질적인 세액 공제율이 10퍼센트 포인트 인상되어, 이미 2024년 미국의 태양광 패널 생산량을 40% 증가시키는 요인이 되고 있습니다. 태양전지에 대해 1와트당 최대 0.07달러 상당의 다층적 제조 세액 공제는 프로젝트의 경제성을 더욱 향상시키고, 전통적인 산업 주에 새로운 공장을 정착시킴으로써 미국 재생에너지 시장이 가져다주는 세수 기반의 혜택을 확대하고 있습니다.
태양광 및 풍력발전의 LCOE 급격한 하락
2024년에는 유틸리티 규모의 태양광발전이 1kWh당 0.048달러, 육상 풍력이 1kWh당 0.033달러에 도달하여, 둘 다 보조금을 적용하지 않은 복합 사이클 가스 발전의 가격을 밑돌았습니다. 대형 터빈, 고밀도 셀 구조, 공급망 최적화를 통해 자본 비용이 절감되는 한편, 에너지 저장 시스템의 도입으로 변동하는 발전 출력을 조절 가능한 전력으로 전환할 수 있게 되었습니다. 기업 구매자들은 이러한 가격 하락을 화석 연료 가격 변동에 대한 헤지 수단으로 간주하고 있으며, 이는 미국 재생에너지 시장의 프로젝트 파이프라인에 활력을 불어넣고 투자자들에게 예측 가능한 수익원을 창출하고 있습니다.
송전 병목 현상과 계통연계 대기
2024년까지 계통연계 신청 미처리 건수는 2.6 TW에 달해 2020년 수준의 4배가 되었으며, 이로 인해 프로젝트 실행이 4-5년 지연되었습니다. FERC 지침 2023에 따라 클러스터 조사 규정 및 상업적 타당성 심사가 의무화되었지만, 미처리 신청 건의 대부분은 여전히 1 MW당 100만 달러를 초과하는 네트워크 업그레이드가 필요합니다. 풍력 자원이 풍부한 그레이트 플레인스 지역에서는 부하 중심지로의 송전 경로가 정비되지 않아 개발이 저해되고 있으며, 그 결과 미국 재생에너지 시장의 단기 신규 도입량이 억제되고 있습니다.
부문 분석
태양광발전 기술은 2025년 미국 재생에너지 시장 점유율의 40.80%를 차지했으며, 2031년까지 연평균 성장률(CAGR) 12.05%로 가장 빠른 성장이 예상됩니다. 축전지와 결합하여 신규 유틸리티 규모의 태양광발전 설비의 85%에 축전 시스템이 도입되어, 주간 발전량을 피크 수요 대응 능력으로 전환함으로써 수익의 확실성을 높이고 있습니다. 아그리볼타익스는 작물 생산과 태양광발전을 융합한 것으로, 토지 제약을 완화하면서 농가의 수익성을 향상시킵니다. 풍력발전은 여전히 많은 포트폴리오의 핵심을 이루고 있으며, 타워 높이와 로터의 대형화를 통해 발전 가능한 지역이 확대되고 있습니다. 해상 풍력발전은 연방 정부의 임대 입찰과 주 정부의 공모(총 15GW)를 통해 탄력을 받고 있습니다. 수력발전과 지열 에너지는 신뢰성 높은 발전 용량을 제공하지만, 자원 제약과 높은 초기 비용으로 인해 보급 속도가 상대적으로 더딘 편입니다. 기술 구성 결정에 있어서는 현재 킬로와트시 단가에 더해 계통 서비스 가치도 고려되게 되면서, 미국 재생에너지 시장의 투자 논리가 재구성되고 있습니다.
미국 재생에너지 시장 규모 중 태양광만으로도 2031년까지 326.4 GW에 달할 것으로 예상되는 반면, 육상 풍력은 지역별 송전망 구축이 진행됨에 따라 253.1 GW까지 확대될 것으로 전망됩니다. 강화형 지열 시스템이나 해양 에너지와 같은 신흥 자원은 현재로서는 소규모 도입 실적에 그치고 있지만, 시범 프로젝트를 통해 비용이 최적화된다면 확장 가능성이 있음을 보여주고 있습니다. 전반적으로, 기술의 다양화는 주요 주에서 재생에너지 보급률이 50%를 넘어감에 따라 기상 조건에 따른 발전량 변동을 완화하고 신뢰성을 높이고 있습니다.
기타 혜택:
- 엑셀 형식의 시장 예측(ME) 시트
- 3개월간 애널리스트 지원
자주 묻는 질문
목차
제1장 소개
제2장 조사 방법
제3장 주요 요약
제4장 시장 구도
제5장 시장 규모와 성장 예측
제6장 경쟁 구도
제7장 시장 기회와 향후 전망
KSM 26.09.02According to Mordor Intelligence, the United States renewable energy market size was valued at 507.67 gigawatt in 2025 and estimated to grow from 545.16 gigawatt in 2026 to reach 778.78 gigawatt by 2031, at a CAGR of 7.38% during the forecast period (2026-2031).
This report is Segmented by Technology (Solar Energy, Wind Energy, Hydropower, Bioenergy, Geothermal, and Ocean Energy) and End-User (Utilities, Commercial and Industrial, and Residential). The Market Sizes and Forecasts are Provided in Terms of Installed Capacity (GW).
United States Renewable Energy Market Trends and Insights
Extension of Federal Investment & Production Tax Credits
Long-term certainty through 2032 for the 30% investment tax credit on solar and USD 26 per MWh production tax credit for wind keeps the US renewable energy market on a steady build schedule, avoiding the historical boom-bust pattern.Domestic-content bonuses lift effective credits by 10 percentage points and have already encouraged a 40% increase in US solar panel output during 2024. Layered manufacturing credits, worth up to USD 0.07 per watt for solar cells, further improve project economics and anchor new factories in traditional industrial states, broadening the tax base benefits of the US renewable energy market.
Rapid Decline in Solar-PV & Wind LCOE
Utility-scale solar reached USD 0.048 per kWh and onshore wind USD 0.033 per kWh in 2024, both undercutting combined-cycle gas prices without subsidies. Larger turbines, high-density cell architectures, and supply-chain optimization compress capital costs, while energy storage attachments convert variable output into dispatchable power. Corporate buyers treat these falling prices as a hedge against fossil-fuel volatility, adding momentum to the US renewable energy market's project pipeline and creating predictable revenue streams for investors.
Transmission Bottlenecks & Interconnection Queues
The interconnection backlog hit 2.6 TW by 2024, quadrupling 2020 levels and delaying projects by 4-5 years. Although FERC Order 2023 imposes cluster-study rules and commercial readiness screens, most pending applications still face network upgrades valued at more than USD 1 million per MW. The Great Plains, rich in wind, sees development stymied without conduits to load centers, resulting in trimmed near-term additions in the US renewable energy market.
Other drivers and restraints analyzed in the detailed report include:
- Corporate Net-Zero & RE100 Procurement Targets
- Inflation Reduction Act-linked Manufacturing Upswing
- Volatility in Commodity Prices for Turbines & Panels
For complete list of drivers and restraints, kindly check the Table Of Contents.
Segment Analysis
Solar technology accounted for 40.80% of the US renewable energy market share in 2025 and is projected to grow at the fastest rate, with a 12.05% CAGR, to 2031. Pairing with batteries means that 85% of new utility solar installations include storage, turning midday generation into peaking capacity and raising revenue certainty. Agrivoltaics blends crop production and photovoltaics, easing land constraints while improving farmer economics. Wind still anchors many portfolios and benefits from taller towers and larger rotors that expand viable terrain. Offshore wind gains momentum through federal lease auctions and state solicitations totaling 15 GW. Hydropower and geothermal energy offer dependable capacity, yet resource limitations and higher upfront costs slow their relative advancement. Technology mix decisions now reflect grid-service value in addition to kilowatt-hour prices, reshaping investment logic inside the US renewable energy market.
The US renewable energy market size for solar alone is expected to reach 326.4 GW by 2031, while onshore wind is projected to expand to 253.1 GW amid regional transmission upgrades. Emerging resources, such as enhanced geothermal systems and marine energy, exhibit modest baselines, but pilot projects reveal scalability once costs are optimized. In aggregate, technology diversification cushions weather-related output swings and strengthens reliability as penetration rises beyond 50% in leading states.
Complete Report Scope:
- By Technology
- Solar Energy (PV and CSP)
- Wind Energy (Onshore and Offshore)
- Hydropower (Small, Large, PSH)
- Bioenergy
- Geothermal
- Ocean Energy (Tidal and Wave)
- By End-User
- Utilities
- Commercial and Industrial
- Residential
List of Companies Covered in this Report:
- NextEra Energy, Inc.
- Invenergy LLC
- Orsted US Offshore Wind
- General Electric Company
- Vestas Wind Systems A/S
- First Solar, Inc.
- Canadian Solar Inc.
- Sunrun Inc.
- Enphase Energy, Inc.
- Siemens Gamesa Renewable Energy S.A.
- Brookfield Renewable Partners L.P.
- Pattern Energy Group LP
- AES Clean Energy
- Dominion Energy, Inc.
- Duke Energy Renewables
- EDF Renewables North America
- EDP Renewables North America LLC
- Clearway Energy Group LLC
- Mitsubishi Power Americas, Inc.
- Trina Solar Co., Ltd.
Additional Benefits:
- The market estimate (ME) sheet in Excel format
- 3 months of analyst support
TABLE OF CONTENTS
1 Introduction
- 1.1 Study Assumptions & Market Definition
- 1.2 Scope of the Study
2 Research Methodology
3 Executive Summary
4 Market Landscape
- 4.1 Market Overview
- 4.2 Market Drivers
- 4.2.1 Extension of Federal Investment & Production Tax Credits
- 4.2.2 Rapid Decline in Solar-PV & Wind LCOE
- 4.2.3 Corporate Net-Zero & RE100 Procurement Targets
- 4.2.4 Inflation Reduction Act-linked Manufacturing Upswing
- 4.2.5 Grid-enhancing Technologies enabling higher renewable penetration
- 4.3 Market Restraints
- 4.3.1 Transmission Bottlenecks & Interconnection Queues
- 4.3.2 Volatility in Commodity Prices for Turbines & Panels
- 4.3.3 Community Opposition to Utility-Scale Projects
- 4.4 Supply-Chain Analysis
- 4.5 Regulatory Outlook
- 4.6 Technological Outlook
- 4.7 Porters Five Forces
- 4.7.1 Threat of New Entrants
- 4.7.2 Bargaining Power of Suppliers
- 4.7.3 Bargaining Power of Buyers
- 4.7.4 Threat of Substitutes
- 4.7.5 Competitive Rivalry
- 4.8 PESTLE Analysis
5 Market Size & Growth Forecasts
- 5.1 By Technology
- 5.1.1 Solar Energy (PV and CSP)
- 5.1.2 Wind Energy (Onshore and Offshore)
- 5.1.3 Hydropower (Small, Large, PSH)
- 5.1.4 Bioenergy
- 5.1.5 Geothermal
- 5.1.6 Ocean Energy (Tidal and Wave)
- 5.2 By End-User
- 5.2.1 Utilities
- 5.2.2 Commercial and Industrial
- 5.2.3 Residential
6 Competitive Landscape
- 6.1 Market Concentration
- 6.2 Strategic Moves (M&A, JVs, Funding, PPAs)
- 6.3 Market Share Analysis (Market Rank/Share for key companies)
- 6.4 Company Profiles (includes Global-level Overview, Market-level Overview, Core Segments, Financials, Strategic Information, Products & Services, Recent Developments)
- 6.4.1 NextEra Energy, Inc.
- 6.4.2 Invenergy LLC
- 6.4.3 Orsted US Offshore Wind
- 6.4.4 General Electric Company
- 6.4.5 Vestas Wind Systems A/S
- 6.4.6 First Solar, Inc.
- 6.4.7 Canadian Solar Inc.
- 6.4.8 Sunrun Inc.
- 6.4.9 Enphase Energy, Inc.
- 6.4.10 Siemens Gamesa Renewable Energy S.A.
- 6.4.11 Brookfield Renewable Partners L.P.
- 6.4.12 Pattern Energy Group LP
- 6.4.13 AES Clean Energy
- 6.4.14 Dominion Energy, Inc.
- 6.4.15 Duke Energy Renewables
- 6.4.16 EDF Renewables North America
- 6.4.17 EDP Renewables North America LLC
- 6.4.18 Clearway Energy Group LLC
- 6.4.19 Mitsubishi Power Americas, Inc.
- 6.4.20 Trina Solar Co., Ltd.
7 Market Opportunities & Future Outlook
- 7.1 White-space & Unmet-Need Assessment


