|
시장보고서
상품코드
2124313
동남아시아의 재생에너지 시장 : 시장 점유율 분석, 업계 동향 및 통계, 성장 예측(2026-2031년)Southeast Asia Renewable Energy - Market Share Analysis, Industry Trends & Statistics, Growth Forecasts (2026 - 2031) |
||||||
 Mordor Intelligence
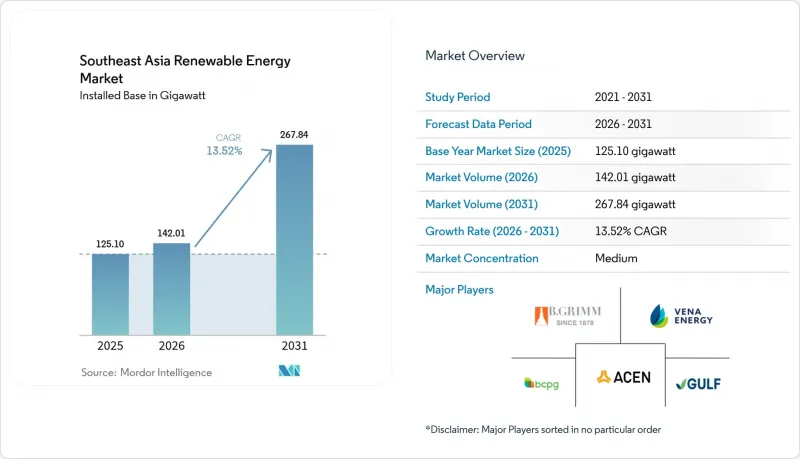
Mordor Intelligence에 의하면, 동남아시아의 재생에너지 시장 규모는 2025년에 125.10GW라고 평가되었고, 2026년 142.01GW로 추정되고, 2031년까지 267.84GW에 이를 것으로 추정되고 있어 예측 기간(2026-2031년) CAGR은 13.52%를 나타낼 전망입니다.
본 보고서는 기술별(태양에너지, 풍력, 수력, 바이오에너지, 지열, 해양 에너지), 최종 사용자별(유틸리티, 상업 및 산업, 주택), 지역별(베트남, 인도네시아, 필리핀, 태국, 말레이시아, 싱가포르, 기타 동남아시아 국가)로 분류되어 있습니다. 시장 규모와 전망은 설비 용량(GW)으로 표시되어 있습니다.
동남아시아의 재생에너지 시장 동향 및 인사이트
싱가포르에 기반을 둔 펀드가 주도하는 그린 에너지 자금 조달의 급속한 성장
싱가포르의 그린본드 프레임워크는 2030년까지 350억 싱가포르 달러 규모의 지속가능 채권 발행을 목표로 하고 있으며, 아세안 전역의 재생에너지 프로젝트로 국경을 넘는 자본 유입을 촉진하고 있습니다. 테마섹(Temasek)과 같은 정부계 투자 기관은 블랙록(BlackRock)의 14억 달러 규모 기후 변화 대응 펀드와 제휴하여 민간 자본을 분산형 태양광 발전 개발업체로 유도함으로써, 그동안 충분히 활용되지 않았던 상업 및 산업(C&I) 시설의 옥상 공간을 개척하고 있습니다. 노르웨이 기후 투자 기금이 인도네시아의 Xurya에 5,500만 달러를 투자한 것은 외국 투자자들이 산업용 전력 수요의 특성에 부합하는 소규모이며 확장성이 있는 태양광 발전 시스템을 선호하고 있음을 보여줍니다. 현지 은행들도 이에 발맞추고 있으며, DBS 은행의 RE100 참여 선언은 금융 기관들이 기업 대출에 녹색 조달 조항을 포함시키고 있어, 재생에너지 조달이 기본 요건이 되는 생태계가 형성되고 있음을 시사합니다.
베트남과 태국의 수출 주도형 산업에서 기업들의 RE100에 대한 신속한 대응
베트남에서는 중국에서 이전해 온 다국적 기업들이 기존 예측을 상회하는 수요를 보임에 따라, 2030년 태양광 발전 목표를 73GW로 상향 조정했습니다. 태국도 유사한 움직임을 보이고 있으며, 태국의 5GW 고정가격임베디드제도(FIT) 공모에서는 자동차 및 전자기기 제조업체가 검증된 청정 전력을 필요로 하는 산업단지가 명시적으로 대상으로 지정되었습니다. 아시아개발은행(ADB)이 태국의 태양광 발전·축전 병용 프로젝트 12건에 대해 8억 2,000만 달러를 대출한 것은 축전이 시험 단계에서 24시간 공급의 필수 요건으로 전환되고 있음을 강조하고 있습니다. 대부분의 경우 15-20년에 걸친 장기 기업 간 전력 구매 계약(PPA)은 현재 가격 변동이 심한 LNG 연동 요금보다 저렴한 가격으로 제공되고 있어, 수출업체에 비용의 확실성과 공급업체의 행동 규범 준수를 모두 보장하고 있습니다.
베트남 남부 회랑의 송전망 혼잡 및 출력 제한 위험
베트남의 재생에너지 도입 속도는 500kV 간선 송전망 확충 속도를 앞지르고 있으며, 수요가 수백 킬로미터 북쪽에 위치해 있어 닌투안과 빈투안의 태양광 발전소는 출력 제한을 피할 수 없는 실정입니다. 제8차 전력 개발 계획에서는 이러한 병목 현상이 인식되고 있으나, 신규 송전선 건설 일정은 여전히 불투명한 상태입니다. 개발업체들은 현금 흐름 산정 시 5-10%의 출력 억제를 가정하고 있어, 이로 인해 필요한 요금 수준과 수익률이 높아지고 있습니다. 정부는 임시 대책으로 지역 산업체와의 직접 송전형 전력구매계약(PPA)을 제안하고 있으나, 이는 혼잡 문제를 해결하기보다는 단순히 문제를 전가하는 데 그칠 뿐입니다. 송전망이 이를 따라잡을 때까지는 자금 제공업체들이 잉여 송전 용량이 있는 지역을 우선적으로 선택할 가능성이 있습니다.
부문별 분석
2025년 설비 용량 중 수력 발전이 51.35%를 차지했습니다. 이는 인근 국가에 잉여 전력을 수출하는 라오스와 말레이시아 사라왁주에 위치한 대규모 댐에 힘입은 결과입니다. 태양광 발전은 2019-2020년에 걸친 붐을 거쳐 베트남 에너지 공급의 약 35%를 차지했습니다. 이는 모듈 공급 과잉으로 인해 가격이 1와트당 0.15달러 아래로 떨어진 것이 호재가 되었기 때문입니다. 육상 풍력은 8-10%를 차지하며 베트남 중부 고지대에 집중되어 있지만, 해상 풍력은 수 GW 규모의 사업권이 승인되었음에도 불구하고 여전히 건설 전 단계에 머물러 있습니다. 해양 에너지는 대폭적인 성장이 예상되며, 필리핀과 인도네시아의 조력·파력 발전 시범 사업은 2031년까지 연평균 성장률(CAGR) 134.85%를 나타낼 것으로 예측됩니다.
해양 에너지 기술의 총 발전 용량은 현재 10MW 미만이므로, 소폭 증가만으로도 세 자릿수의 성장률로 이어집니다. MW당 설비 투자액은 여전히 해상 풍력의 3-4배 수준이며, 해저 케이블의 지역 공급망이 구축되지 않아 단기적인 상용화에는 제약이 따르고 있습니다. 바이오에너지는 4-5%를 차지하며, 주요 공급원은 인도네시아의 팜유 공장 폐수와 태국의 벼 껍질 연소입니다. 한편, ‘기타’로 분류되는 지열 발전은 주로 인도네시아와 필리핀에서 약 2GW를 공급했습니다.
기타 혜택
- 엑셀 형식 시장 예측(ME) 시트
- 3개월간의 애널리스트 지원
자주 묻는 질문
목차
제1장 서론
제2장 조사 방법
제3장 주요 요약
제4장 시장 구도
제5장 시장 규모 및 성장 예측
제6장 경쟁 구도
제7장 시장 기회 및 향후 전망
AJY 26.09.11According to Mordor Intelligence, the Southeast Asia renewable energy market size was valued at 125.10 gigawatt in 2025 and estimated to grow from 142.01 gigawatt in 2026 to reach 267.84 gigawatt by 2031, at a CAGR of 13.52% during the forecast period (2026-2031).
This report is Segmented by Technology (Solar Energy, Wind Energy, Hydropower, Bioenergy, Geothermal, and Ocean Energy), End-User (Utilities, Commercial and Industrial, and Residential), and Geography (Vietnam, Indonesia, Philippines, Thailand, Malaysia, Singapore, and Rest of Southeast Asia). The Market Sizes and Forecasts are Provided in Terms of Installed Capacity (GW).
Southeast Asia Renewable Energy Market Trends and Insights
Green-energy financing booms led by Singapore-based funds
Singapore's Green Bond Framework aims to target SGD 35 billion of sustainable issuance by 2030, catalyzing cross-border capital flows into renewable projects across ASEAN. Sovereign investment vehicles, such as Temasek, partnering with BlackRock's USD 1.4 billion climate fund, are steering private capital toward distributed solar developers, unlocking commercial and industrial (C&I) rooftops that were previously underserved. The Norwegian Climate Investment Fund's USD 55 million equity investment in Indonesia's Xurya demonstrates that foreign investors favor smaller, scalable arrays that match industrial electricity profiles. Local banks follow suit, DBS's RE100 pledge signals that financiers are embedding green-sourcing clauses in corporate loans, creating an ecosystem where renewable procurement becomes a baseline requirement.
Rapid corporate RE100 procurement across export-led industries in Vietnam & Thailand
Vietnam has lifted its 2030 solar target to 73 GW after multinationals relocating from China indicated demand that outstrips earlier forecasts. Thailand mirrors this push: its 5 GW feed-in-tariff round explicitly earmarks industrial zones where auto and electronics producers need verified clean electricity. The Asian Development Bank's USD 820 million loan for 12 Thai solar-plus-storage projects underscores storage moving from pilot to prerequisite for round-the-clock supply. Long-term corporate PPAs, often spanning 15 to 20 years, now price below volatile LNG-indexed tariffs, providing exporters with both cost certainty and compliance with supplier codes of conduct.
Grid congestion & curtailment risks in Vietnam's southern corridor
Vietnam's renewable energy rollout has outpaced its 500 kV backbone, forcing solar farms in Ninh Thuan and Binh Thuan to curtail output as demand lies hundreds of kilometers to the north. The eighth Power Development Plan acknowledges this bottleneck, but timelines for new lines remain vague. Developers are incorporating 5 to 10% curtailment assumptions into their cash flows, which increases the required tariffs or returns. The government has floated direct-wire PPAs to local industry as an interim relief, yet that would shift rather than solve congestion. Until transmission catches up, financiers may favor regions with excess evacuation capacity.
Other drivers and restraints analyzed in the detailed report include:
- Accelerating LNG price volatility improving LCOE competitiveness of solar-plus-storage
- Cross-border power-trade initiatives (Lao-PDR-Thailand-Malaysia-Singapore) scaling regional demand
- Land-banking & right-of-way challenges for utility-scale projects in the Philippines
For complete list of drivers and restraints, kindly check the Table Of Contents.
Segment Analysis
Hydropower accounted for 51.35% of installed capacity in 2025, underpinned by large dams in Laos and Malaysia's Sarawak region that export surplus electricity to neighbors. Solar photovoltaics supplied roughly 35% of Vietnam's energy after its 2019-2020 boom, benefiting from a module oversupply that pushed prices below USD 0.15 per watt. Onshore wind contributed 8-10%, concentrated in Vietnam's central highlands, while offshore wind remained in pre-construction despite multi-gigawatt concessions. Ocean energy is poised for significant growth, with a projected 134.85% CAGR through 2031 for tidal and wave pilots in the Philippines and Indonesia.
Ocean technologies currently total less than 10 MW, so even modest additions will result in triple-digit growth. Capital expenditure per megawatt remains 3-4 times that of offshore wind, and regional supply chains for subsea cables are lacking, which temper near-term commercialization. Bioenergy supplied 4-5%, mainly from palm oil mill effluent in Indonesia and rice husk combustion in Thailand, whereas geothermal, classified under "Other", delivered roughly 2 GW, mostly in Indonesia and the Philippines.
Complete Report Scope:
- By Technology
- Solar Energy (PV and CSP)
- Wind Energy (Onshore and Offshore)
- Hydropower (Small, Large, PSH)
- Bioenergy
- Geothermal
- Ocean Energy (Tidal and Wave)
- By End-User
- Utilities
- Commercial and Industrial
- Residential
- By Geography
- Vietnam
- Indonesia
- Philippines
- Thailand
- Malaysia
- Singapore
- Rest of Southeast Asia
List of Companies Covered in this Report:
- ACEN Corp (Ayala Group)
- B.Grimm Power PCL
- Gulf Energy Development PCL
- BCPG PCL
- Trung Nam Group
- JinkoSolar Holding Co. Ltd
- Canadian Solar Inc.
- Trina Solar Co. Ltd
- Sindicatum Renewable Energy Co.
- Sunseap Group Pte Ltd (EDP Renewables)
- Sembcorp Industries Ltd
- Nexif Energy
- Orsted A/S
- Vena Energy
- Citicore Renewable Energy Corp
- Siemens Gamesa Renewable Energy SA
- Vestas Wind Systems A/S
- First Gen Corporation
- Sarawak Energy Berhad
- PT Pertamina Geothermal Energy Tbk
- Masdar
Additional Benefits:
- The market estimate (ME) sheet in Excel format
- 3 months of analyst support
TABLE OF CONTENTS
1 Introduction
- 1.1 Study Assumptions & Market Definition
- 1.2 Scope of the Study
2 Research Methodology
3 Executive Summary
4 Market Landscape
- 4.1 Market Overview
- 4.2 Market Drivers
- 4.2.1 ASEAN Green-Energy Financing Booms Led by Singapore-Based Funds
- 4.2.2 Rapid Corporate RE100 Procurement Across Export-Led Industries in Vietnam & Thailand
- 4.2.3 Accelerating LNG Price Volatility Improving LCOE Competitiveness of Solar-Plus-Storage
- 4.2.4 Cross-Border Power-Trade Initiatives (Lao-PDR-Thailand-Malaysia-Singapore) Scaling Regional Demand
- 4.2.5 Aggressive Net-Zero Targets from Indonesia & Philippines Unlocking Gigawatt-Scale Auctions
- 4.2.6 Grid-Connected Floating Solar Pilots Unlocking Water-Constrained Opportunities in Indonesia
- 4.3 Market Restraints
- 4.3.1 Grid Congestion & Curtailment Risks in Vietnam's Southern Corridor
- 4.3.2 Uncertain Feed-in-Tariff Transition to Auction in Indonesia Delaying IPP Pipelines
- 4.3.3 Land-Banking & Right-of-Way Challenges for Utility-Scale Projects in the Philippines
- 4.3.4 Limited Regional Wind-Turbine Manufacturing Base Elevating Cap-Ex & Lead-Times
- 4.4 Supply-Chain Analysis
- 4.5 Regulatory Outlook
- 4.6 Technological Outlook
- 4.7 Porters Five Forces
- 4.7.1 Bargaining Power of Suppliers
- 4.7.2 Bargaining Power of Consumers
- 4.7.3 Threat of New Entrants
- 4.7.4 Threat of Substitutes
- 4.7.5 Competitive Rivalry
5 Market Size & Growth Forecasts
- 5.1 By Technology
- 5.1.1 Solar Energy (PV and CSP)
- 5.1.2 Wind Energy (Onshore and Offshore)
- 5.1.3 Hydropower (Small, Large, PSH)
- 5.1.4 Bioenergy
- 5.1.5 Geothermal
- 5.1.6 Ocean Energy (Tidal and Wave)
- 5.2 By End-User
- 5.2.1 Utilities
- 5.2.2 Commercial and Industrial
- 5.2.3 Residential
- 5.3 By Geography
- 5.3.1 Vietnam
- 5.3.2 Indonesia
- 5.3.3 Philippines
- 5.3.4 Thailand
- 5.3.5 Malaysia
- 5.3.6 Singapore
- 5.3.7 Rest of Southeast Asia
6 Competitive Landscape
- 6.1 Market Concentration
- 6.2 Strategic Moves (M&A, Partnerships, PPAs)
- 6.3 Market Share Analysis (Market Rank/Share for key companies)
- 6.4 Company Profiles (includes Global level Overview, Market level overview, Core Segments, Financials as available, Strategic Information, Products & Services, and Recent Developments)
- 6.4.1 ACEN Corp (Ayala Group)
- 6.4.2 B.Grimm Power PCL
- 6.4.3 Gulf Energy Development PCL
- 6.4.4 BCPG PCL
- 6.4.5 Trung Nam Group
- 6.4.6 JinkoSolar Holding Co. Ltd
- 6.4.7 Canadian Solar Inc.
- 6.4.8 Trina Solar Co. Ltd
- 6.4.9 Sindicatum Renewable Energy Co.
- 6.4.10 Sunseap Group Pte Ltd (EDP Renewables)
- 6.4.11 Sembcorp Industries Ltd
- 6.4.12 Nexif Energy
- 6.4.13 Orsted A/S
- 6.4.14 Vena Energy
- 6.4.15 Citicore Renewable Energy Corp
- 6.4.16 Siemens Gamesa Renewable Energy SA
- 6.4.17 Vestas Wind Systems A/S
- 6.4.18 First Gen Corporation
- 6.4.19 Sarawak Energy Berhad
- 6.4.20 PT Pertamina Geothermal Energy Tbk
- 6.4.21 Masdar
7 Market Opportunities & Future Outlook
- 7.1 White-Space & Unmet-Need Assessment