

|
시장보고서
상품코드
2121703
유럽 폐기물 발전 : 시장 점유율 분석, 업계 동향과 통계, 성장 예측(2026-2031년)Europe Waste-to-Energy - Market Share Analysis, Industry Trends & Statistics, Growth Forecasts (2026 - 2031) |
||||||
 Mordor Intelligence
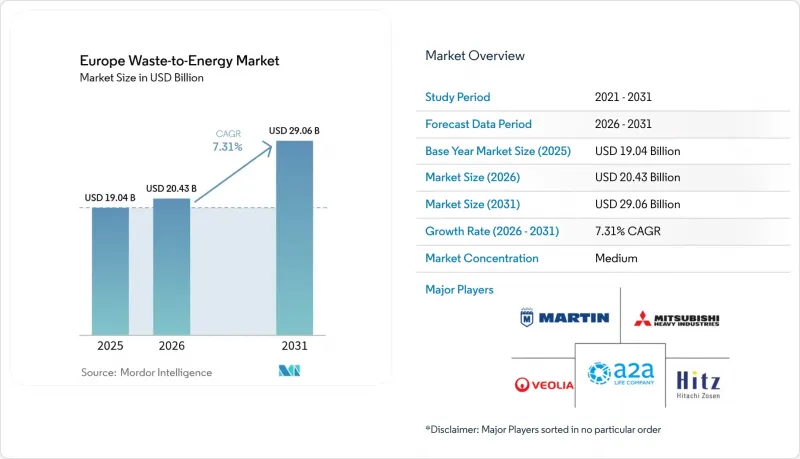
Mordor Intelligence에 의하면, 유럽 폐기물 발전 시장 규모는 2025년에 190억 4,000만 달러로 평가되었고, 2026년204억 3,000만 달러에서 2031년까지 290억 6,000만 달러에 이를 것으로 예측되며, 예측 기간(2026-2031년) CAGR은 7.31%를 기록할 전망입니다.
본 보고서는 기술별(물리적 처리, 열처리, 생물학적 처리), 폐기물 유형별(일반 폐기물, 산업 폐기물, 농업 및 농업 관련 산업의 잔재물, 하수 슬러지, 기타),에너지 생산량별(전력, 열, 기타), 최종 사용자별(산업용 자가 발전소, 운송용 연료 판매업체, 기타), 국가별(독일, 영국, 이탈리아, 프랑스, 북유럽 국가, 기타)로 분류되어 있습니다.
유럽 폐기물 발전 시장 동향 및 인사이트
EU 폐기물 기본 지침 2018/851의 목표에 따른 매립 처분 전환 촉진
이 지침은 2035년까지 일반 폐기물의 매립 처분량을 10%로 제한하고 있으며, 회원국들에게 잔여 폐기물 흐름에 대한 열처리 능력 강화를 요구하고 있습니다. 2010년부터 2020년에 걸쳐 매립 처분량은 27.5% 감소했으나, 14개국이 위반 위험에 직면해 있어 새로운 소각 시설 및 혐기성 소화 시설의 조달이 진행되고 있습니다. 폴란드와 루마니아는 턴키 방식의 시설 건설 자금으로 EU 결속 기금을 우선적으로 활용하고 있으며, 기한을 맞추기 위해 승인 절차를 단축하고 있습니다. 에너지 회수는 폐기물 처리 계층에서 매립보다 상위 단계에 위치하기 때문에 지자체는 프로젝트의 수익성을 높이기 위해 더 높은 수거 요금을 정당화하고 있습니다. 동유럽 당국은 폐기물 발전이 매립 처분에서 벗어나는 전환과 겨울철 전력 수요 피크 시의 부족이라는 두 가지 과제에 대한 해결책으로 간주하고 있으며, 이것이 유럽 전체 폐기물 발전 시장 수요를 뒷받침하고 있습니다.
EU의 탄소국경조정메커니즘(CBAM) 도입에 따른 폐기물 유래 에너지 크레딧 수요 증가
2026년에 본격적으로 도입될 CBAM에 따라, 폐기물 발전으로 생산된 전력이 화석 연료 발전을 대체할 경우, 감축된 배출량이 금전적 가치로 평가되게 됩니다. 탄소 강도가 낮음을 입증한 시설은 산업 부문 구매자가 제출해야 하는 프리미엄 인증을 취득할 수 있으며, 이를 통해 실질적으로 발전소의 수익이 보조되는 효과가 있습니다. EU 배출권 거래 제도(EU ETS) 가격이 톤당 80유로를 상회하는 추세인 가운데, 이러한 인증은 신규 건설 프로젝트의 내부수익률을 향상시킵니다. 개발업자들은 탄소 계수를 검증하기 위해 첨단 배기가스 처리 설비 도입을 시작하고 있습니다. 이 제도는 탄소 배출량이 많은 전력을 수입하는 업체가 동등한 과세 대상이 되므로, 간접적으로 국내 사업자를 보호하게 되어 유럽의 폐기물 발전 시장을 더욱 강화하게 됩니다.
도시 지역 주민들의 반대 운동 및 소송 격화
환경 보호 단체들은 기후 변화 대책과 관련된 2024년 유럽인권재판소의 판결을 근거로 허가 신청에 이의를 제기하고 있어, 승인 절차가 장기화되고 있습니다. 암스테르담에서는 주민들의 청원을 받아 계획 중이던 시설 건설이 중단되었으며, 마드리드에서도 유사한 반발에 직면하고 있습니다. 법적 불확실성으로 인해 금융 기관의 리스크 프리미엄이 상승함에 따라, 개발 사업자는 소각에 앞서 철저한 재활용 노력을 입증해야 할 의무가 부과되고 있습니다. 코펜하겐 등 공공 부문 소유자의 경우 사회적 수용도가 높은 편이지만, 민간 양허 계약에는 시민으로 구성된 감독위원회의 설치 조항이 점점 더 많이 포함되고 있습니다. 이러한 동향으로 인해 인구 밀도가 높은 도시에서의 프로젝트 추진이 지연되면서, 유럽 폐기물 발전 시장의 단기 처리 능력 확대가 억제되고 있습니다.
부문 분석
2025년에는 19개 EU 회원국에 걸쳐 확립된 화격자 연소 시설에 힘입어 열처리 방식이 부문 매출의 59.40%를 차지했습니다. 가스화 및 열분해 시범 사업은 현재 EU 혁신 기금의 지원을 받고 있으며, 이는 이산화탄소 포집 대응 설계에 대한 정책적 우선순위를 보여줍니다. 혐기성 소화는 2030년까지 35bcm이라는 ‘REPowerEU’의 바이오메탄 목표와 부합하기 때문에 생물 처리 부문은 연평균 성장률(CAGR) 11.96%로 성장하고 있습니다. 유기물의 전처리 선별 및 소화 처리, 폐기물 유래 연료의 연소 처리를 결합한 통합형 시설은 매립 처분되는 잔류물량을 줄이고 순환형 경제 지표를 향상시키고 있습니다. 생물학적 솔루션과 관련된 유럽의 폐기물 발전 시장 규모는 2026년 60억 5,000만 달러에서 2031년에는 106억 6,000만 달러로 확대될 것으로 예측되며, 저탄소 가스에 대한 투자자의 높은 수요가 부각되고 있습니다.
Hitachi Zosen Inova, Martin, Babcock & Wilcox와 같은 열처리 장비 공급업체들은 화격자 라인의 모듈화 및 산소 연소용 회수 포트 통합을 통해 이에 대응하고 있습니다. 프로젝트 후원사는 현재 산업 배출 지침의 상한치를 초과하도록 배기가스 처리 시스템을 설계하고 있으며, 이를 통해 향후 회수 시스템 통합에 소요되는 리드 타임을 단축하고 있습니다. 생물 처리 기술 제공업체들은 소규모 지자체에 적합한 컨테이너형 소화조에 주력하며, 처리 대상량을 확대되고 있습니다. 공기 유량, 슬래그 처리, 소화조의 체류 시간을 조정하는 디지털 제어를 통해 가동률이 92% 가까이 향상되어, 유럽 폐기물 발전 시장 전체의 수익 회복력이 강화되고 있습니다.
2025년에는 성숙한 수거 물류 체계와 최소한의 처리 의무 덕분에 일반 폐기물(MSW)이 처리량의 61.30%를 차지했습니다. 그러나 농업 종사자들이 질산염 지침을 충족하기 위해 가축 분뇨와 작물 잔여물을 수익화하고 있기 때문에 농업 및 농업 관련 산업의 잔여물은 연간 11.12%의 속도로 증가하고 있습니다. 이탈리아와 덴마크에서 가스 송전망에 가스를 주입함으로써 얻는 프리미엄을 배경으로, 농업계 원료에 기인한 유럽의 폐기물 발전 시장 규모는 2031년까지 74억 4,000만 달러에 달할 가능성이 있습니다.
육류 가공 시 발생하는 내장이나 치즈의 유청은 수율이 높은 바이오가스 원료가 되어 투자 회수 기간을 12개월 이하로 단축할 수 있기 때문에 협동조합이 소유한 소화조를 유치하고 있습니다. 도시 인구 증가와 폐수 규제 강화에 따라 하수 슬러지 양이 증가하고 있으며, 수도 유틸리티자들은 에너지 자급자족을 도모하기 위해 슬러지 소각로 설치를 추진하고 있습니다. 포장재나 섬유 등 상업 및 산업계에서 발생하는 재활용 가능한 폐기물은 발열량이 높지만, PVC나 금속을 제거하기 위한 사전 선별용 로봇이 필요합니다. 혼합 투입 전략을 통해 발열량의 변동이 평준화되고 연중 안정적인 공급망이 확보되므로, 유럽의 폐기물 발전 시장 전체에서 플랜트의 가동률이 향상됩니다.
기타 혜택
- 엑셀 형식 시장 예측(ME) 시트
- 3개월간의 애널리스트 지원
자주 묻는 질문
목차
제1장 서론
제2장 조사 방법
제3장 주요 요약
제4장 시장 구도
제5장 시장 규모와 성장 예측
제6장 경쟁 구도
제7장 시장 기회와 향후 전망
LSH 26.09.02According to Mordor Intelligence, the Europe waste-to-Energy market size was valued at USD 19.04 billion in 2025 and estimated to grow from USD 20.43 billion in 2026 to reach USD 29.06 billion by 2031, at a CAGR of 7.31% during the forecast period (2026-2031).
This report is Segmented by Technology (Physical, Thermal, and Biological), Waste Type (Municipal Solid Waste, Industrial Waste, Agricultural and Agro-Industrial Residues, Sewage Sludge, and Others), Energy Output (Electricity, Heat, and More), End-User (Industrial Captive Plants, Transport Fuel Distributors, and More), and Country (Germany, United Kingdom, Italy, France, Nordic Countries, and More).
Europe Waste-to-Energy Market Trends and Insights
EU Waste Framework Directive 2018/851 Targets Driving Diversion from Landfill
The Directive caps municipal landfills at 10% by 2035, pushing member states to add thermal capacity for residual waste streams. Landfilled volumes fell 27.5% between 2010-2020, yet 14 nations risk infringement, accelerating procurement for new incineration and anaerobic digestion plants . Poland and Romania prioritize EU cohesion funds to finance turnkey facilities, compressing approval windows to meet the deadline. Because energy recovery sits above disposal in the hierarchy, municipalities justify higher gate fees that improve project returns. Eastern European authorities see waste-to-energy as a twin answer to landfill diversion and winter-peak electricity deficits, underpinning demand across the European waste-to-energy market.
Upcoming EU Carbon Border Adjustment Mechanism Boosting Demand for Waste-Derived Energy Credits
CBAM's full launch in 2026 monetizes avoided emissions when waste-to-energy electricity displaces fossil generation. Facilities demonstrating lower carbon intensity earn premium certificates that industrial buyers must surrender, effectively subsidizing plant revenues. With EU ETS prices trending above EUR 80/tCO2, certificates enhance internal rates of return for new builds. Developers have started embedding advanced flue-gas treatment to verify carbon factors. The mechanism indirectly shields domestic operators because importers of carbon-heavy electricity face equivalent levies, further strengthening the European waste-to-energy market.
Escalating Public Opposition and Litigation in Urban Hubs
Environmental groups leverage the 2024 European Court of Human Rights ruling on climate action to contest permits, lengthening approval processes. Amsterdam halted a planned plant after resident petitions, while Madrid faces similar pushback. Legal uncertainties raise lender risk premiums and oblige developers to prove exhaustive recycling efforts before incineration. Although public-sector owners such as Copenhagen record higher social acceptance, private concessions increasingly include citizen oversight boards. These dynamics slow project roll-outs in dense cities and curb near-term capacity additions within the European waste-to-energy market.
Other drivers and restraints analyzed in the detailed report include:
- Rapid Decommissioning of Coal Power Plants in Germany Creating Baseload Demand
- District-Heating Expansion in Nordics & CEE Favouring CHP Plants
- Declining Wholesale Power Prices from Wind & Solar Surge
For complete list of drivers and restraints, kindly check the Table Of Contents.
Segment Analysis
Thermal routes generated 59.40% of segment revenue in 2025, driven by established grate combustion fleets spread across 19 EU members. Gasification and pyrolysis pilots now secure EU Innovation Fund support, indicating policy preference for capture-ready designs. The biological cluster grows at a 11.96% CAGR as anaerobic digestion aligns with the REPowerEU biomethane goal of 35 bcm by 2030. Integrated sites that marry front-end sorting with digestion for organics and combustion for refuse-derived fuel cut residual landfill volumes, boosting circularity metrics. The Europe waste-to-energy market size linked to biological solutions is projected to climb from USD 6.05 billion in 2026 to USD 10.66 billion in 2031, underscoring investor appetite for low-carbon gases.
Thermal suppliers such as Hitachi Zosen Inova, Martin GmbH, and Babcock & Wilcox respond by modularising grate lines and embedding oxy-fuel capture ports. Project sponsors now design flue-gas treatment to exceed Industrial Emissions Directive ceilings, shortening later capture integration lead times. Biological technology providers focus on containerized digesters suitable for small municipalities, broadening addressable volumes. Digital controls that adjust air flow, slag handling, and digester retention times raise availability by close to 92%, enhancing revenue resilience across the European waste-to-energy market.
Municipal solid waste (MSW) represented 61.30% throughput in 2025, thanks to mature collection logistics and minimum disposal mandates. However, agricultural and agro-industrial residues grow 11.12% annually as farmers monetise manure and crop residues to meet the nitrates directives. The European waste-to-energy market size attributable to agricultural feedstock could reach USD 7.44 billion by 2031, supported by gas-grid injection premiums in Italy and Denmark.
Meat-processing offal and cheese whey supply high-yield biogas streams that cut payback to under 12 months, attracting co-operative-owned digesters. Sewage sludge volumes climb with urban population growth and tighter wastewater rules, prompting water utilities to install sludge incinerators for energy self-sufficiency. Commercial and industrial recyclables such as packaging and textiles offer higher calorific value but demand pre-sort robotics to remove PVC and metals. Blended-feed strategies even out calorific swings and secure year-round supply chains, enhancing plant utilization across the European waste-to-energy market.
Complete Report Scope:
- By Technology
- Physical (Refuse-Derived Fuel, Mechanical Biological Treatment)
- Thermal (Incineration/Combustion, Gasification, Pyrolysis and Plasma-Arc)
- Biological (Anaerobic Digestion, Fermentation)
- By Waste Type
- Municipal Solid Waste (MSW)
- Industrial Waste
- Agricultural and Agro-industrial Residues
- Sewage Sludge
- Others (Commercial, Construction, Hazardous)
- By Energy Output
- Electricity
- Heat
- Combined Heat and Power (CHP)
- Transportation Fuels (Bio-SNG, Bio-LNG, Ethanol)
- By End-user
- Utilities and Independent Power Producers (IPPs)
- Industrial Captive Plants
- District Heating Operators
- Transport Fuel Distributors
- By Country
- Germany
- United Kingdom
- France
- Italy
- Spain
- Nordic Countries (Denmark, Sweden, Finland, Norway)
- Poland
- Turkey
- Russia
- Rest of Europe
List of Companies Covered in this Report:
- Veolia Environnement SA
- SUEZ SA
- Hitachi Zosen Inova AG
- Mitsubishi Heavy Industries Environmental & Chemical Engineering Co.
- Martin GmbH
- A2A SpA
- STEAG Energy Services GmbH
- Wheelabrator Technologies
- EEW Energy from Waste GmbH
- Indaver NV
- AVR Afvalverwerking BV
- Viridor Ltd.
- FCC Environment Ltd.
- Zabalgarbi S.A.
- Tiru S.A. (Paprec Group)
- Cory Group
- Geminor AS
- Remondis SE & Co. KG
- Babcock & Wilcox Volund A/S
- Keppel Seghers Belgium NV
Additional Benefits:
- The market estimate (ME) sheet in Excel format
- 3 months of analyst support
TABLE OF CONTENTS
1 Introduction
- 1.1 Study Assumptions & Market Definition
- 1.2 Scope of the Study
2 Research Methodology
3 Executive Summary
4 Market Landscape
- 4.1 Market Overview
- 4.2 Market Drivers
- 4.2.1 EU Waste Framework Directive 2018/851 Targets Driving Diversion from Landfill
- 4.2.2 Upcoming EU Carbon Border Adjustment Mechanism Boosting Demand for Waste-Derived Energy Credits
- 4.2.3 Rapid Decommissioning of Coal Power Plants in Germany Creating Baseload Demand for WtE Electricity
- 4.2.4 District-Heating Expansion in Nordics & CEE Favouring CHP WtE Plants
- 4.2.5 Rising Gate Fees for Landfill Operations in the UK & France Enhancing WtE Economics
- 4.2.6 EU Innovation-Fund Grants for Carbon-Capture-Ready WtE Facilities
- 4.3 Market Restraints
- 4.3.1 Escalating Public Opposition & Litigation Against Incineration in Urban Hubs (Amsterdam, Madrid)
- 4.3.2 Declining Wholesale Power Prices from Surging Wind & Solar Undermining WtE Revenue
- 4.3.3 Permitting Delays Under the EU Industrial Emissions Directive Increasing Project Lead-Times
- 4.3.4 Competition from Advanced (Chemical) Recycling Stealing Plastic Feedstock Streams
- 4.4 Supply-Chain Analysis
- 4.5 Regulatory Outlook
- 4.6 Technological Outlook
- 4.7 Porters Five Forces Analysis
- 4.7.1 Bargaining Power of Suppliers
- 4.7.2 Bargaining Power of Buyers
- 4.7.3 Threat of New Entrants
- 4.7.4 Threat of Substitutes
- 4.7.5 Competitive Rivalry
5 Market Size & Growth Forecasts
- 5.1 By Technology
- 5.1.1 Physical (Refuse-Derived Fuel, Mechanical Biological Treatment)
- 5.1.2 Thermal (Incineration/Combustion, Gasification, Pyrolysis and Plasma-Arc)
- 5.1.3 Biological (Anaerobic Digestion, Fermentation)
- 5.2 By Waste Type
- 5.2.1 Municipal Solid Waste (MSW)
- 5.2.2 Industrial Waste
- 5.2.3 Agricultural and Agro-industrial Residues
- 5.2.4 Sewage Sludge
- 5.2.5 Others (Commercial, Construction, Hazardous)
- 5.3 By Energy Output
- 5.3.1 Electricity
- 5.3.2 Heat
- 5.3.3 Combined Heat and Power (CHP)
- 5.3.4 Transportation Fuels (Bio-SNG, Bio-LNG, Ethanol)
- 5.4 By End-user
- 5.4.1 Utilities and Independent Power Producers (IPPs)
- 5.4.2 Industrial Captive Plants
- 5.4.3 District Heating Operators
- 5.4.4 Transport Fuel Distributors
- 5.5 By Country
- 5.5.1 Germany
- 5.5.2 United Kingdom
- 5.5.3 France
- 5.5.4 Italy
- 5.5.5 Spain
- 5.5.6 Nordic Countries (Denmark, Sweden, Finland, Norway)
- 5.5.7 Poland
- 5.5.8 Turkey
- 5.5.9 Russia
- 5.5.10 Rest of Europe
6 Competitive Landscape
- 6.1 Market Concentration
- 6.2 Strategic Moves (M&A, Partnerships, PPAs)
- 6.3 Market Share Analysis (Market Rank/Share for key companies)
- 6.4 Company Profiles (includes Global level Overview, Market level overview, Core Segments, Financials as available, Strategic Information, Products & Services, and Recent Developments)
- 6.4.1 Veolia Environnement SA
- 6.4.2 SUEZ SA
- 6.4.3 Hitachi Zosen Inova AG
- 6.4.4 Mitsubishi Heavy Industries Environmental & Chemical Engineering Co.
- 6.4.5 Martin GmbH
- 6.4.6 A2A SpA
- 6.4.7 STEAG Energy Services GmbH
- 6.4.8 Wheelabrator Technologies
- 6.4.9 EEW Energy from Waste GmbH
- 6.4.10 Indaver NV
- 6.4.11 AVR Afvalverwerking BV
- 6.4.12 Viridor Ltd.
- 6.4.13 FCC Environment Ltd.
- 6.4.14 Zabalgarbi S.A.
- 6.4.15 Tiru S.A. (Paprec Group)
- 6.4.16 Cory Group
- 6.4.17 Geminor AS
- 6.4.18 Remondis SE & Co. KG
- 6.4.19 Babcock & Wilcox Volund A/S
- 6.4.20 Keppel Seghers Belgium NV
7 Market Opportunities & Future Outlook
- 7.1 White-Space & Unmet-Need Assessment


