|
시장보고서
상품코드
2121744
데이터센터 전력 : 시장 점유율 분석, 업계 동향과 통계, 성장 예측(2026-2031년)Data Center Power - Market Share Analysis, Industry Trends & Statistics, Growth Forecasts (2026 - 2031) |
||||||
 Mordor Intelligence
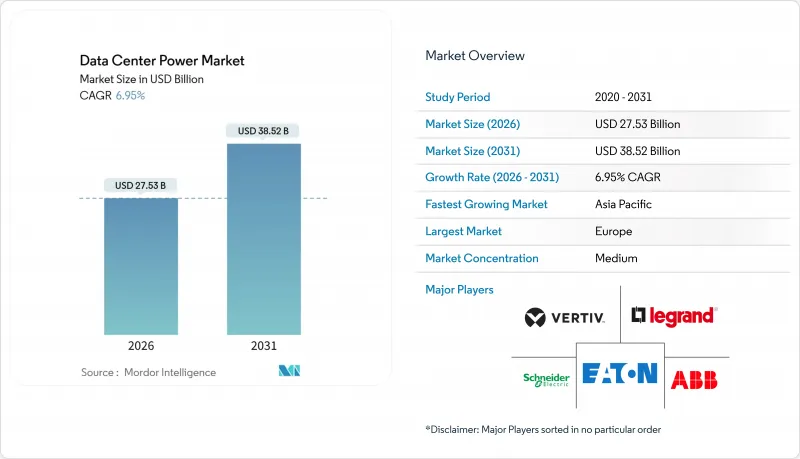
Mordor Intelligence에 의하면, 데이터센터 전력 시장 규모는 2026년에 275억 3,000만 달러에 이르고, 2031년까지 385억 2,000만 달러에 이를 것으로 예측되며, 이 기간 CAGR은 6.95%를 기록할 전망입니다.
본 보고서는 구성 요소(전기 솔루션 및 서비스), 티어 유형(Tier 1 및 2, Tier 3, Tier 4), 데이터센터 규모(소규모, 중규모, 대규모, 하이퍼스케일),데이터센터 유형(코로케이션, 하이퍼스케일러/CSP, 엔터프라이즈 및 엣지), 지역(북미, 남미, 유럽, 아시아태평양, 중동 및 아프리카)별로 분류되어 있습니다. 시장 예측은 금액(달러) 기준으로 제시되어 있습니다.
세계 데이터센터 전력 시장 동향 및 인사이트
하이퍼스케일 및 클라우드 컴퓨팅의 확대
캠퍼스 프로젝트의 IT 부하는 현재 100메가와트를 초과하며, 각 사이트에는 전용 230킬로볼트 변전소와 N+1 구성의 발전기 군이 필요합니다. 마이크로소프트는 2025년에 15기가와트의 용량을 가동할 예정이며, 가동 중인 랙을 중단하지 않고도 추가할 수 있는 모듈식 개폐 장치를 표준화했습니다. 아마존 웹 서비스(AWS)는 200kW를 소비하는 액체 냉각 캐비닛을 시범 운영하여, 바닥 면적을 줄이면서 랙 밀도를 2배로 높였습니다. 구글은 AI 클러스터를 위해 480볼트 직류 배전을 채택하여 AC-DC 간 손실을 8% 줄였습니다. 이러한 설계로 인해 버스웨이, 대용량 PDU, 그리고 1,000암페어를 초과하는 연속 전류를 견딜 수 있는 솔리드 스테이트 브레이커에 대한 수요가 가속화되고 있습니다.
AI 주도형 고밀도 워크로드
생성형 AI 훈련으로 인해 GPU 클러스터의 전력 소비량은 홀당 40-50메가와트에 달하며, 가상화된 엔터프라이즈 워크로드에 비해 10배 증가했습니다. 운영 사업자들은 고상식 레이아웃을 폐지하고, 오버헤드 버스웨이 및 열원에서 3미터 이내의 위치에 설치되는 인로우 냉각 방식을 채택하고 있습니다. Vertiv사의 Liebert EXL S1 UPS 시리즈(모듈당 정격 1.5메가와트)는 하이퍼스케일러 기업들이 기존 홀의 개보수를 진행하는 가운데, 2025년에 수주가 140% 증가했습니다. 리튬이온 캐비닛은 현재 밸브 제어형 납축전지 스트링의 설치 면적의 3분의 1만을 차지하지만, 전 부하 시에도 15분간의 라이드스루를 실현하고 있습니다. 슈나이더 일렉트릭의 ‘Galaxy VXL’은 3메가와트시의 배터리를 내장하고 97.5%의 효율을 실현함으로써, 보호 대상 1메가와트당 30kW의 열 부하를 저감하고 있습니다.
전기 인프라의 고액 설비 투자(CAPEX)
10메가와트 규모의 Tier 3 시설에는 전기 장비에 1,500만-2,000만 달러가 필요하며, 100메가와트를 초과하는 하이퍼스케일 사이트의 경우 변전소 및 가스 절연 개폐 장치를 포함해 2억 달러를 초과하는 경우도 있습니다. 신흥국에서는 자금 조달 기회가 여전히 제한적이며, 새로운 전력 공급선 승인에 18-24개월이 소요될 수 있어 보유 비용이 증가합니다. Vertiv사의 모듈식 ‘Smart Cabinet’은 설치 작업을 40% 줄이고 수익화까지 걸리는 기간을 8주 단축하지만, 초기 투자 부담이 중견 기업 시장 진입을 가로막고 있습니다. 자금 사정의 압박으로 인해 공급업체가 개폐 장치를 소유하고월사용료를 청구하는 ‘구독형 서비스’ 모델의 성장이 촉진되고 있지만, 그 보급은 아직 초기 단계에 불과합니다.
부문 분석
데이터센터 전력 시장 규모에서 서비스 부문의 점유율이 확대되고 있습니다. 이는 사업자들이 하이브리드형(디젤·가스·수소) 발전 설비의 통합이나 예측 유지보수 계약을 외부에 위탁하게 되었기 때문입니다. 전기 솔루션은 리튬 이온 UPS 시스템, 솔리드 스테이트 브레이커, 랙 레벨 PDU가 주도하며 2025년 매출의 63.54%를 계속 차지하고 있습니다. 공급업체들이 설치, 펌웨어, 원격 모니터링을 번들로 제공하고 있어 서비스 매출은 연평균 성장률(CAGR) 7.43%로 확대되고 있습니다. 슈나이더 일렉트릭은 2025년 데이터센터 매출의 38%가 다년 계약의 서비스 계약에서 비롯될 것이라고 밝혔으며, 이는 성과 기반 조달로의 전환을 반영합니다.
UPS 제품 라인은 현재 IT 부하 근처에 배치되는 500kW 단위의 블록으로 확장 가능하며, 천연가스 및 수소 발전기는 도시 지역의 배출 규제를 준수합니다. 개폐 장치에는 패널 깊이를 40% 줄이고 2밀리초 미만으로 고장을 격리하는 실리콘 카바이드 소재의 솔리드 스테이트 장치가 채택되어 있습니다. 에너지 저장 랙은 단순한 대기 기능에서 벗어나, 조직화된 시장에서 1메가와트시당 연간 5만-10만 달러의 수익을 창출하는 계통 지원 자산으로 전환되고 있습니다. 현장의 복잡성이 증가함에 따라, 특히 숙련된 인력이 부족하고 엄격한 가동률 조항이 부과되는 시장에서 서비스의 가치 제안이 더욱 강화되고 있습니다.
2025년 도입 건수의 64.42%를 차지하는 Tier 3 시설은 99.982%의 가용성과 적당한 자본 집약도의 균형을 통해 데이터센터의 전력 시장 점유율을 뒷받침하고 있습니다. Tier 4 시설은 비용이 25-30% 더 높지만, 규제 산업에서 내결함성에 대한 수요가 증가함에 따라 연평균 성장률(CAGR) 7.65%로 확대되고 있습니다. Tier 3 시설의 보험료는 40% 더 비쌀 수 있으며, 단 한 번의 정전만으로도 절약한 자본을 상회하는 손실이 발생할 가능성이 있으므로, 미션 크리티컬 워크로드의 경우 Tier 4 인증 획득이 매우 중요합니다.
각 공급업체는 단계적인 전환을 가능하게 하는 모듈식 아키텍처로 이에 대응하고 있습니다. 이튼(Eaton)사의 ‘Power Xpert 9395P’는 기존 장비를 철거하지 않고도 추가 UPS 스트링을 병렬로 연결할 수 있게 해줍니다. ISO/IEC 22237 및 ANSI/TIA-942 표준이 현재 공공 조달 조항에 포함되어 있어, 정부 워크로드에 대해 사실상 Tier 4가 의무화되어 있습니다. AI 밀도가 높아지는 것도 Tier 4 도입을 더욱 뒷받침하고 있습니다. 이는 GPU 클러스터가 예기치 않게 종료될 경우 재훈련 주기가 장기화되기 때문입니다.
지역별 분석
2025년에는 독일, 영국, 프랑스의 엄격한 에너지 효율 규제와 엣지 노드의 성장에 힘입어 유럽이 전 세계 데이터센터 전력 시장 매출의 38.54%를 차지하며 1위를 차지했습니다. 프랑크푸르트에서만 해도 은행들이 결제 시스템에 대한 저지연 연결을 요구함에 따라 코로케이션 용량이 45메가와트 증가했습니다. 런던 도크랜즈에서는 132킬로볼트 런던 링 메인(London Ring Main)의 업그레이드에 힘입어 사업자들이 38메가와트의 용량을 가동했습니다. 파리의 시설에서는 냉각기의 출력을 제한하는 히트 아일랜드 규제를 준수하기 위해 액체 냉각이 채택되었으며, 이는 지방 자치 단체의 규제가 전기 설계에 어떤 영향을 미치는지를 보여줍니다.
아시아태평양은 가장 빠르게 성장하는 지역으로, 2031년까지 연평균 성장률(CAGR)이 7.91%를 나타낼 것으로 예측됩니다. 중국은 2025년 베이징, 상하이, 선전에서 85메가와트의 신규 용량을 승인했으며, 허가 조건으로 전력 사용 효율(PUE)을 1.25 미만으로, 재생에너지 비율을 50% 이상으로 정했습니다. 인도의 2025년 ‘국가 데이터센터 정책’에서는 20메가와트 이상의 Tier 3 시설에 대해 국산 UPS 및 개폐 장치를 채택하는 것을 조건으로 5년간의 세제 혜택을 부여하고 있습니다. 일본에서는 18메가와트가 추가되었으며, 규모 7의 지진을 견딜 수 있는 내진 사양의 개폐 장치 사용이 의무화되었습니다. 한국에서는 삼성과 SK텔레콤이 자금을 지원한 12메가와트 규모의 AI 추론 센터가 가동을 시작했습니다. 호주는 1메가와트시당 8만 달러의 부가 서비스 수익을 창출하는 계통 연계형 데이터센터를 선구적으로 도입했습니다.
북미는 여전히 최대의 단일 지역 클러스터이며, 2025년 미국의 신규 용량의 60%를 버지니아주, 텍사스주, 캘리포니아주가 차지하고 있습니다. 캐나다에서는 토론토와 몬트리올에 총 15메가와트가 추가되었으며, 한랭 지역 특유의 자연 냉각과 저비용 수력 발전이 활용되었습니다. 멕시코의 케레타로 코리도에서는 미국 지역으로의 저지연 연결이 필요한 니어쇼어링 제조업체를 위해 8메가와트가 공급되었습니다. 중동 및 아프리카에서는 스마트 시티 계획으로 인해 Tier 3 데이터센터가 필요한 두바이와 리야드에 투자가 집중되었습니다. 브라질은 전자상거래 및 핀테크 수요에 힘입어 상파울루에서 10메가와트를 공급하며 남미를 선도했습니다.
기타 혜택:
- 엑셀 형식 시장 예측(ME) 시트
- 3개월간의 애널리스트 지원
자주 묻는 질문
목차
제1장 서론
제2장 조사 방법
제3장 주요 요약
제4장 시장 구도
제5장 시장 규모와 성장 예측
제6장 경쟁 구도
제7장 시장 기회와 향후 전망
LSH 26.09.09According to Mordor Intelligence, the data center power market size reached USD 27.53 billion in 2026 and is forecast to advance to USD 38.52 billion by 2031, reflecting a 6.95% CAGR over the period.
This report is Segmented by Component (Electrical Solution, and Service), Tier Type (Tier 1 and 2, Tier 3, and Tier 4), Data Center Size (Small, Medium, Large, and Hyperscale), Data Center Type (Colocation, Hyperscalers/CSPs, and Enterprise and Edge), and Geography (North America, South America, Europe, Asia-Pacific, and Middle East and Africa). The Market Forecasts are Provided in Terms of Value (USD).
Global Data Center Power Market Trends and Insights
Hyperscale and Cloud-Computing Expansion
Campus projects now exceed 100 megawatts of IT load, and each site requires dedicated 230-kilovolt substations plus N+1 generator farms. Microsoft commissioned 15 gigawatts of capacity in 2025, standardizing on modular switchgear that can be added without interrupting live racks. Amazon Web Services piloted liquid-cooled cabinets that draw 200 kilowatts, doubling rack density while shrinking floor plate. Google adopted 480-volt direct-current distribution for AI clusters, cutting AC-DC losses by 8%. These designs accelerate demand for busway, high-capacity PDUs, and solid-state breakers that tolerate continuous currents above 1,000 amperes.
AI-Driven High-Density Workloads
Generative AI training pushes GPU clusters to 40-50 megawatts per hall, a tenfold rise over virtualized enterprise workloads. Operators are abandoning raised-floor layouts in favor of overhead busways and in-row cooling placed within three meters of heat sources. Vertiv's Liebert EXL S1 UPS line, rated at 1.5 megawatts per module, saw 140% order growth in 2025 as hyperscalers retrofit existing halls. Lithium-ion cabinets now occupy one-third the footprint of valve-regulated lead-acid strings yet provide 15-minute ride-through at full load. Schneider Electric's Galaxy VXL integrates a three-megawatt-hour battery and delivers 97.5% efficiency, lowering thermal load by 30 kilowatts per megawatt protected.
High CAPEX of Electrical Infrastructure
A 10-megawatt Tier 3 facility needs USD 15-20 million in electrical gear, and hyperscale sites above 100 megawatts can exceed USD 200 million, including substations and gas-insulated switchgear. Access to finance remains limited in emerging economies, and new utility feeders can take 18-24 months to approve, adding holding costs. Vertiv's modular Smart Cabinet trims installation labor by 40% and accelerates revenue by eight weeks, yet the upfront outlay still deters mid-tier firms. Capital pressure is prompting growth of service-as-a-subscription models where vendors own switchgear and charge monthly fees, but adoption is still nascent.
Other drivers and restraints analyzed in the detailed report include:
- Stricter Uptime and Redundancy Standards
- Sustainability and Energy-Efficiency Mandates
- Transformer and Switchgear Supply Bottlenecks
For complete list of drivers and restraints, kindly check the Table Of Contents.
Segment Analysis
Services captured a rising slice of the data center power market size as operators outsourced integration of hybrid diesel-gas-hydrogen fleets and predictive maintenance contracts. Electrical solutions still held 63.54% of 2025 revenue, led by lithium-ion UPS systems, solid-state breakers, and rack-level PDUs. Service revenue is advancing at a 7.43% CAGR as suppliers bundle installation, firmware, and remote monitoring. Schneider Electric disclosed that 38% of data-center turnover in 2025 stemmed from multi-year service agreements, reflecting a shift toward outcome-based procurement.
UPS lines now scale in 500-kilowatt blocks positioned near the IT load, while natural-gas and hydrogen generators address urban emission limits. Switchgear adopts solid-state silicon carbide devices that cut panel depth by 40% and isolate faults in under two milliseconds. Energy-storage racks transition from standby roles to grid-support assets that earn USD 50,000-100,000 per megawatt-hour annually in organized markets. Field complexity strengthens the services value proposition, particularly in markets that lack skilled labor and enforce strict uptime clauses.
Tier 3 installations represented 64.42% of 2025 deployments, anchoring the data center power market share due to their balance of 99.982% availability and moderate capital intensity. Tier 4 sites, though costlier by 25-30%, are expanding at a 7.65% CAGR as regulated industries demand fault tolerance. Insurance premiums on Tier 3 halls can run 40% higher, and a single outage may exceed the saved capital, making Tier 4 certification compelling for mission-critical workloads.
Suppliers respond with modular architectures that allow stepwise migration. Eaton's Power Xpert 9395P lets operators parallel an additional UPS string without displacing existing gear. ISO/IEC 22237 and ANSI/TIA-942 standards now appear in public procurement clauses, effectively mandating Tier 4 for government workloads. Rising AI density further drives Tier 4 adoption, because any unexpected shutdown of GPU clusters triggers prolonged retraining cycles.
Complete Report Scope:
- By Component
- Electrical Solution
- UPS Systems
- Generators
- Diesel Generators
- Gas Generators
- Hydrogen Fuel-cell Generators
- Power Distribution Units
- Switchgear
- Transfer Switches
- Remote Power Panels
- Energy-storage Systems
- Service
- Installation and Commissioning
- Maintenance and Support
- Training and Consulting
- Electrical Solution
- By Tier Type
- Tier 1 and 2
- Tier 3
- Tier 4
- By Data Center Size
- Small Data Center
- Medium Data Center
- Large Data Center
- Hyperscale Data Center
- By Data Center Type
- Colocation Data Center
- Hyperscalers Data Center/CSPs
- Enterprise and Edge Data Center
- By Geography
- North America
- United States
- Canada
- Mexico
- South America
- Brazil
- Argentina
- Rest of South America
- Europe
- Germany
- United Kingdom
- France
- Italy
- Spain
- Rest of Europe
- Asia-Pacific
- China
- Japan
- India
- South Korea
- Australia
- Rest of Asia-Pacific
- Middle East and Africa
- Middle East
- United Arab Emirates
- Saudi Arabia
- Turkey
- Rest of Middle East
- Africa
- South Africa
- Nigeria
- Rest of Africa
- Middle East
- North America
Geography Analysis
Europe led with 38.54% of global data center power market revenue in 2025, driven by stringent energy-efficiency statutes and edge-node growth in Germany, the United Kingdom, and France. Frankfurt alone added 45 megawatts of colocation capacity as banks demanded low-latency links to clearing systems. Operators in London's Docklands brought 38 megawatts online, helped by upgrades to the 132-kilovolt London Ring Main. Paris facilities adopted liquid-cooling to comply with heat-island restrictions that cap chiller output, illustrating how municipal rules shape electrical design.
Asia-Pacific is the fastest region, with a 7.91% CAGR projected through 2031. China approved 85 megawatts of new capacity in Beijing, Shanghai, and Shenzhen in 2025, conditioning permits on power-usage effectiveness below 1.25 and 50% renewable energy. India's 2025 National Data Center Policy grants five-year tax holidays for Tier 3 sites above 20 megawatts that source indigenous UPS and switchgear. Japan added 18 megawatts and mandated seismic-rated switchgear that tolerates magnitude 7 seismic events. South Korea saw 12 megawatts of AI inference halls funded by Samsung and SK Telecom. Australia pioneered grid-interactive data centers that earn USD 80,000 per megawatt-hour in ancillary-service revenue.
North America remains the single largest country cluster, with Virginia, Texas, and California accounting for 60% of new U.S. capacity in 2025. Canada added 15 megawatts across Toronto and Montreal, leveraging cold-climate free cooling and low-cost hydropower. Mexico's Queretaro corridor delivered eight megawatts for near-shoring manufacturers needing low-latency links to U.S. regions. The Middle East and Africa drew investment in Dubai and Riyadh where smart-city programs require Tier 3 halls. Brazil led South America with 10 megawatts in Sao Paulo, supported by e-commerce and fintech demand.
- Schneider Electric SE
- Vertiv Holdings Co.
- ABB Ltd
- Eaton Corporation plc
- Legrand SA
- Huawei Technologies Co. Ltd
- Fujitsu Ltd
- Cisco Systems Inc.
- Rittal GmbH and Co. KG
- Mitsubishi Electric Corp.
- Cummins Inc.
- Kohler Power Systems
- PDU Experts UK Ltd
- Bloom Energy
- Delta Electronics Inc.
- Caterpillar Inc.
- Socomec Group
- Tripp Lite (by Eaton)
- Riello UPS S.p.A.
- KEHUA Tech
- Fluence Energy
Additional Benefits:
- The market estimate (ME) sheet in Excel format
- 3 months of analyst support
TABLE OF CONTENTS
1 INTRODUCTION
- 1.1 Study Assumptions and Market Definition
- 1.2 Scope of the Study
2 RESEARCH METHODOLOGY
3 EXECUTIVE SUMMARY
4 MARKET LANDSCAPE
- 4.1 Market Overview
- 4.2 Market Drivers
- 4.2.1 Hyperscale and Cloud-Computing Expansion
- 4.2.2 AI-Driven High-Density Workloads
- 4.2.3 Stricter Uptime and Redundancy Standards
- 4.2.4 Sustainability and Energy-Efficiency Mandates
- 4.2.5 Grid-Interactive Revenue Streams (Behind-the-Meter)
- 4.2.6 Coal-Plant Site Repurposing for Campuses
- 4.3 Market Restraints
- 4.3.1 High CAPEX of Electrical Infrastructure
- 4.3.2 Carbon-Intensity Regulations and Reporting
- 4.3.3 Transformer and Switchgear Supply Bottlenecks
- 4.3.4 Local Opposition to Sub-Station Expansion
- 4.4 Industry Supply-Chain Analysis
- 4.5 Regulatory Landscape
- 4.6 Technological Outlook
- 4.7 Porter's Five Forces Analysis
- 4.7.1 Threat of New Entrants
- 4.7.2 Bargaining Power of Buyers
- 4.7.3 Bargaining Power of Suppliers
- 4.7.4 Threat of Substitute Products
- 4.7.5 Intensity of Competitive Rivalry
- 4.8 Impact of Macroeconomic Factors on the Market
5 MARKET SIZE AND GROWTH FORECASTS (VALUE)
- 5.1 By Component
- 5.1.1 Electrical Solution
- 5.1.1.1 UPS Systems
- 5.1.1.2 Generators
- 5.1.1.2.1 Diesel Generators
- 5.1.1.2.2 Gas Generators
- 5.1.1.2.3 Hydrogen Fuel-cell Generators
- 5.1.1.3 Power Distribution Units
- 5.1.1.4 Switchgear
- 5.1.1.5 Transfer Switches
- 5.1.1.6 Remote Power Panels
- 5.1.1.7 Energy-storage Systems
- 5.1.2 Service
- 5.1.2.1 Installation and Commissioning
- 5.1.2.2 Maintenance and Support
- 5.1.2.3 Training and Consulting
- 5.1.1 Electrical Solution
- 5.2 By Tier Type
- 5.2.1 Tier 1 and 2
- 5.2.2 Tier 3
- 5.2.3 Tier 4
- 5.3 By Data Center Size
- 5.3.1 Small Data Center
- 5.3.2 Medium Data Center
- 5.3.3 Large Data Center
- 5.3.4 Hyperscale Data Center
- 5.4 By Data Center Type
- 5.4.1 Colocation Data Center
- 5.4.2 Hyperscalers Data Center/CSPs
- 5.4.3 Enterprise and Edge Data Center
- 5.5 By Geography
- 5.5.1 North America
- 5.5.1.1 United States
- 5.5.1.2 Canada
- 5.5.1.3 Mexico
- 5.5.2 South America
- 5.5.2.1 Brazil
- 5.5.2.2 Argentina
- 5.5.2.3 Rest of South America
- 5.5.3 Europe
- 5.5.3.1 Germany
- 5.5.3.2 United Kingdom
- 5.5.3.3 France
- 5.5.3.4 Italy
- 5.5.3.5 Spain
- 5.5.3.6 Rest of Europe
- 5.5.4 Asia-Pacific
- 5.5.4.1 China
- 5.5.4.2 Japan
- 5.5.4.3 India
- 5.5.4.4 South Korea
- 5.5.4.5 Australia
- 5.5.4.6 Rest of Asia-Pacific
- 5.5.5 Middle East and Africa
- 5.5.5.1 Middle East
- 5.5.5.1.1 United Arab Emirates
- 5.5.5.1.2 Saudi Arabia
- 5.5.5.1.3 Turkey
- 5.5.5.1.4 Rest of Middle East
- 5.5.5.2 Africa
- 5.5.5.2.1 South Africa
- 5.5.5.2.2 Nigeria
- 5.5.5.2.3 Rest of Africa
- 5.5.5.1 Middle East
- 5.5.1 North America
6 COMPETITIVE LANDSCAPE
- 6.1 Market Concentration
- 6.2 Strategic Moves
- 6.3 Market Share Analysis
- 6.4 Company Profiles (includes Global Level Overview, Market Level Overview, Core Segments, Financials as available, Strategic Information, Market Rank/Share, Products and Services, Recent Developments)
- 6.4.1 Schneider Electric SE
- 6.4.2 Vertiv Holdings Co.
- 6.4.3 ABB Ltd
- 6.4.4 Eaton Corporation plc
- 6.4.5 Legrand SA
- 6.4.6 Huawei Technologies Co. Ltd
- 6.4.7 Fujitsu Ltd
- 6.4.8 Cisco Systems Inc.
- 6.4.9 Rittal GmbH and Co. KG
- 6.4.10 Mitsubishi Electric Corp.
- 6.4.11 Cummins Inc.
- 6.4.12 Kohler Power Systems
- 6.4.13 PDU Experts UK Ltd
- 6.4.14 Bloom Energy
- 6.4.15 Delta Electronics Inc.
- 6.4.16 Caterpillar Inc.
- 6.4.17 Socomec Group
- 6.4.18 Tripp Lite (by Eaton)
- 6.4.19 Riello UPS S.p.A.
- 6.4.20 KEHUA Tech
- 6.4.21 Fluence Energy
7 MARKET OPPORTUNITIES AND FUTURE OUTLOOK
- 7.1 White-Space and Unmet-Need Assessment