

|
시장보고서
상품코드
2121781
유럽의 활성탄 : 시장 점유율 분석, 업계 동향과 통계, 성장 예측(2026-2031년)Europe Activated Carbon - Market Share Analysis, Industry Trends & Statistics, Growth Forecasts (2026 - 2031) |
||||||
 Mordor Intelligence
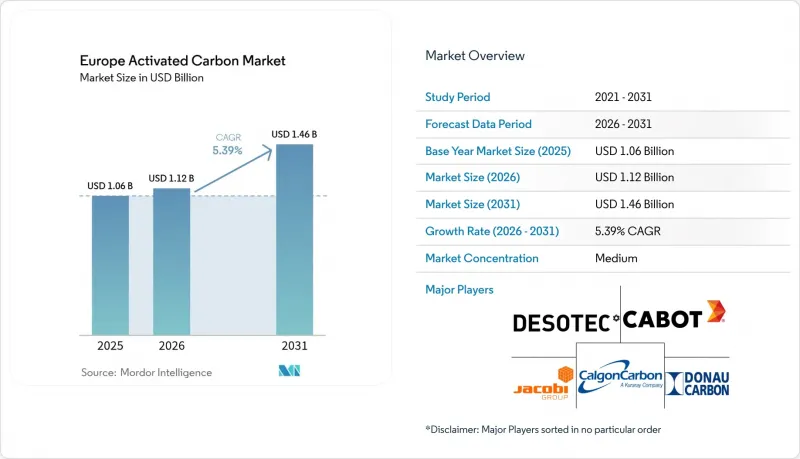
Mordor Intelligence에 따르면 유럽의 활성탄 시장 규모는 2025년에 10억 6,000만 달러, 2026년에 11억 2,000만 달러에 달하며, 2031년까지 14억 6,000만 달러에 달할 것으로 예측되고 있으며, 2026-2031년에 CAGR 5.39%로 성장할 것으로 전망되고 있습니다.
이 보고서는 유형(분말 활성탄, 입상 활성탄, 압출·펠릿형 활성탄), 용도(가스 정화, 수질 정화, 금속 추출, 의약품, 기타 산업 공정) 및 지역(독일, 영국, 프랑스, 이탈리아, 스페인 및 기타 유럽)별로 분류되어 있습니다. 시장 전망은 금액(달러) 기준으로 제시되어 있습니다.
유럽 활성탄 시장의 동향 및 인사이트
지방 자치단체 상수도 사업자의 수요 급증
상수도 사업자 구매자들은 PFAS 모니터링 및 제거에 대해 2029년 1월을 법적 구속력 있는 기한으로 정한 ‘2026년 음용수 지침’을 준수하기 위해 주문을 앞당기고 있습니다. 독일 연방환경청은 2025년 12월, 표본 조사된 지하수 우물의 23%가 이미 0.10µg/L의 상한치를 초과하고 있음을 발표했으며, 이에 따라 바이에른주 및 헤센주 전역에서 긴급 입찰이 실시되었습니다. 프랑스의 사업자인 베올리아(Veolia)사는 14곳의 정수장을 새로운 GAC(과립 활성탄) 층과 PAC(폴리염화알루미늄) 주입 스키드로 개조하기 위해 8,500만 유로를 투자했습니다. 이 회사는 기존의 흡착재로는 단쇄 PFAS 목표치를 달성할 수 없음을 분명히 지적하고 있습니다. 공급망 리드타임은 2026년 3분기까지 연장되었으며, 제품 사양에서는 현재 4탄소 PFBA 분자에 대해 더 높은 흡착 능력을 보이는 코코넛 껍질 유래 메조포러스 카본이 중시되고 있습니다. 이러한 파급 효과로 PAC와 GAC의 현물 가격이 측정 가능한 수준으로 상승하고 있지만, 규제 위반시 건당 최대 50만 유로의 벌금이 부과될 수 있으므로 공공사업자들은 이 높은 가격을 기꺼이 지불할 의향이 있는 것으로 보입니다. 이러한 동향은 유럽 활성탄 시장에 단기적인 활력을 불어넣는 한편, 유연한 투여 기술의 중요성을 부각시키고 있습니다.
석탄·바이오매스 혼소시 수은 배출 상한선
2024년 BAT(최적 이용 기술) 결론에 따라 300MW th를 초과하는 대규모 연소 플랜트의 수은 배출 제한이 대폭 낮아져, 사업자들은 PAC 주입량을 2배, 혹은 3배로 늘릴 수밖에 없는 상황에 처해 있습니다. 폴란드의 PGE Energia는 현재 벨차토프와 트로우 두 발전소에서 배기가스내 수은 농도를 1µg/Nm³ 미만으로 유지하기 위해 연간 1,200 t의 브롬화 PAC를 소비하고 있습니다. RWE의 노이라트 갈탄 복합 발전소도 비슷한 길을 걷고 있으며, 주입 설비를 확충하는 동시에 특수 탄소 공급업체와 다년간의 공급 계약을 체결했습니다. 브롬화 처리에 따라 단가는 30%-40% 상승하지만, EU 배출권 거래 제도(EU-ETS)에 따른 탄소배출권 비용을 고려하면, 수명 주기 비용 모델에서는 여전히 PAC가 촉매 흡착제보다 유리한 것으로 평가됩니다. 소규모 바이오매스 혼소 설비도 유사한 과제에 직면해 있습니다. 이러한 설비는 본래 기준 수은 농도가 낮고 원료의 편차가 크기 때문에 안전 조치로서 PAC의 연속 투여를 불가피하게 하고 있습니다. 그 결과, 지속적이고 경기 순환에 다소 역행하는 수요가 발생하여 유럽 활성탄 시장의 수익 다각화를 지원하고 있습니다.
코코넛 껍질 및 석탄 원료의 가격 변동
2025년,태풍 ‘마와르’와 사이클론 ‘모카’로 인해 코코넛 껍질 공급망이 혼란을 겪으며 스리랑카의 목탄 수출량이 24% 감소했을 뿐만 아니라, 로테르담의 PAC 현물 가격은 1월 2,100유로/톤에서 9월에는 2,480유로/톤으로 상승했습니다. 무연탄 가격도 마찬가지로 급등하여 TTF 가스 선물 가격 상승을 따랐습니다. 2025년 12월 가스 가격이 45유로/MWh에 도달했을 때, 무연탄 가격은 전월 대비 14% 상승했습니다. 코코넛과 석탄 시장은 상관관계가 없었고, 헤지 수단도 부족했으므로 공급업체들은 공급 부족의 영향을 상쇄할 여지가 거의 없었고, 유럽의 활성탄 업계 전체에서 매출 총이익률이 축소되었습니다. 고정 가격 입찰을 시행하는 전력 회사는 가장 큰 타격을 입었으며, 비용을 회수하기 위해 때때로 불가항력 조항을 발동하기도 했습니다.
부문 분석
2025년에는 분말 활성탄(PAC)이 매출의 47.65%를 차지하며, 유럽 활성탄 시장 규모에서 차지하는 그 점유율은 2031년까지 연평균 성장률(CAGR) 5.67%로 꾸준히 확대될 것으로 전망됩니다. 상수도 사업자들은 하천에서 유래한 PFAS 및 지오스민의 발생을 감지한 후 몇 시간 이내에 PAC를 정화조에 직접 투입할 수 있다는 점을 높이 평가하고 있으며, 이는 고정층식 GAC 시스템으로는 실현할 수 없는 유연성입니다. Veolia의 2025년 입찰에서는 3,200톤의 분말 활성탄(PAC)에 대해 48시간 이내의 납품을 요구하고 있으며, 공급망의 대응 능력이 조달 기준으로 자리 잡고 있음을 여실히 보여주었습니다. GAC는 성장 속도는 완만하지만, 지속적인 정화 및 산업용 재활용 사이클의 핵심으로 남아 있습니다. 네덜란드의 Waternet은 초기 설비 투자로 400만 유로를 지출했으나, 주요 처리 시설을 GAC로 전환한 결과 연간 탄소 소비량을 35% 절감했습니다. 압출 성형품 및 펠릿화 등급의 시장 점유율은 여전히 작지만, 낮은 압력 손실이 요구되는 기상 VOC 회수 분야에서는 필수적입니다. Cabot이 비표면적 1,100 m²/g의 목재 펠릿을 출시한 것은 CBAM(탄소 국경 조정 메커니즘)에 대응하는 대체재를 제공하는 동시에 원료의 동향을 보여주고 있습니다. 이러한 제품 구성의 진화는 유럽 활성탄 시장의 깊이를 지원하고 있습니다.
기타 혜택:
- 엑셀 형식의 시장 예측(ME) 시트
- 3개월간의 애널리스트 지원
자주 묻는 질문
목차
제1장 서론
제2장 조사 방법
제3장 개요
제4장 시장 구도
제5장 시장 규모와 성장 예측
제6장 경쟁 구도
제7장 시장 기회와 향후 전망
KSA 26.09.04According to Mordor Intelligence, the Europe activated carbon market size is projected to be USD 1.06 billion in 2025, USD 1.12 billion in 2026, and reach USD 1.46 billion by 2031, growing at a CAGR of 5.39% from 2026 to 2031.
This report is Segmented by Type (Powdered Activated Carbons, Granular Activated Carbons, and Extruded or Pelletized Activated Carbons), Application (Gas Purification, Water Purification, Metal Extraction, Medicine, and Other Industrial Processes), and Geography (Germany, United Kingdom, France, Italy, Spain, and Rest of Europe). The Market Forecasts are Provided in Terms of Value (USD).
Europe Activated Carbon Market Trends and Insights
Surging Demand From Municipal Water Utilities
Utility buyers are front-loading orders to comply with the 2026 Drinking Water Directive, which fixes a binding deadline of January 2029 for PFAS monitoring and removal. Germany's Federal Environment Agency disclosed in December 2025 that 23% of sampled groundwater wells already exceed the 0.10 µg/L ceiling, prompting emergency tenders across Bavaria and Hesse. French operator Veolia committed EUR 85 million to retrofit 14 plants with fresh GAC beds and PAC-dosing skids, explicitly citing the inability of legacy media to meet short-chain PFAS targets. Supply-chain lead times have lengthened into Q3 2026, and product specifications now emphasize mesoporous carbons derived from coconut shell, which show higher uptake for four-carbon PFBA molecules. The ripple effect is a measurable uplift in spot pricing for both PAC and GAC, yet utilities appear willing to pay the premium because regulatory penalties for non-compliance can reach EUR 500,000 per incident. This dynamic injects near-term momentum into the Europe activated carbon market while foregrounding the importance of agile dosing technologies.
Mercury-Emissions Cap in Coal & Biomass Co-Firing
The 2024 BAT conclusions slashed mercury limits for large combustion plants above 300 MW th, compelling operators to double or even triple PAC injection rates. Poland's PGE Energia is now consuming 1,200 t of brominated PAC annually across Belchatow and Turow to hold stack concentrations below 1 µg/Nm3. RWE's Neurath lignite complex followed a similar path, scaling injection equipment and entering multi-year supply contracts with specialty carbon vendors. Bromination raises unit prices by 30%-40%, but life-cycle cost models still favor PAC over catalytic sorbents when carbon-allowance expenses under the EU-ETS are factored in. Smaller biomass co-firing units confront the same threshold; their inherently lower baseline mercury is offset by wide variability in feedstock, forcing continuous PAC dosing as a guardrail. The upshot is sustained, moderately counter-cyclical demand that shores up revenue diversity inside the Europe activated carbon market.
Price Volatility of Coconut-Shell & Coal Feedstocks
Typhoon Mawar and Cyclone Mocha disrupted coconut-shell supply chains in 2025, slashing Sri Lankan charcoal exports by 24% and sending Rotterdam PAC spot prices from EUR 2,100/t in January to EUR 2,480/t by September. Parallel spikes in anthracite followed TTF gas futures upward; when gas touched EUR 45/MWh in December 2025, anthracite climbed 14% month on month. Because coconut and coal markets are uncorrelated and lack hedging instruments, suppliers had little room to offset squeezes, narrowing gross margins across the Europe activated carbon industry. Utilities on fixed-price tenders bore the brunt, occasionally invoking force-majeure clauses to recover costs.
Other drivers and restraints analyzed in the detailed report include:
- Rising PFAS Removal Mandates in Groundwater
- Regenerative Carbon-Reactivation Service Contracts Gaining Traction
- Carbon Border Adjustment Mechanism Cost on Coal-Based Grades
For complete list of drivers and restraints, kindly check the Table Of Contents.
Segment Analysis
Powdered activated carbon controlled 47.65% of revenue in 2025, and its share of the Europe activated carbon market size is projected to increase steadily at a 5.67% CAGR to 2031. Water utilities value the ability to spike PAC directly into clarifiers within hours of detecting river-borne PFAS or geosmin episodes, a flexibility unattainable with fixed-bed GAC systems. Veolia's 2025 tender demanded 48-hour delivery for 3,200 t of PAC, underscoring how supply-chain responsiveness has become a procurement criterion. GAC, although slower growing, remains the backbone for continuous remediation and industrial reuse loops; Netherlands-based Waternet cut annual carbon consumption by 35% after switching a major plant to GAC despite paying EUR 4 million in upfront capex. Extruded and pelletized grades retain a smaller share but are indispensable in gas-phase VOC recovery where low pressure drop matters. Cabot's launch of a wood-based pellet with 1,100 m2/g surface area offered a CBAM-friendly alternative and illustrates feedstock migration trends. This product mix evolution reinforces the depth of the Europe activated carbon market.
Complete Report Scope:
- By Product Type
- Powdered Activated Carbon (PAC)
- Granular Activated Carbon (GAC)
- Extruded / Pelletized Activated Carbon
- By Application
- Water Purification
- Gas Purification
- Metal Purification
- Medicine
- Other Industrial Processes (solvent recovery and energy storage)
- By Geography
- Germany
- United Kingdom
- France
- Italy
- Spain
- Rest of Europe
List of Companies Covered in this Report:
- AdFiS products GmbH
- Albemarle Corporation
- Cabot Corporation
- Calgon Carbon Corporation (Kuraray)
- Carbon Activated Corporation
- CarboTech Group
- Desotec
- Donau Carbon GmbH
- Haycarb PLC
- Ingevity
- JACOBI CARBONS GROUP
- KUREHA CORPORATION
- Norit
- Puragen
Additional Benefits:
- The market estimate (ME) sheet in Excel format
- 3 months of analyst support
TABLE OF CONTENTS
1 Introduction
- 1.1 Study Assumptions & Market Definition
- 1.2 Scope of the Study
2 Research Methodology
3 Executive Summary
4 Market Landscape
- 4.1 Market Overview
- 4.2 Market Drivers
- 4.2.1 Surging demand from municipal water utilities
- 4.2.2 Mercury-emissions cap in coal & biomass co-firing
- 4.2.3 Rising PFAS removal mandates in groundwater
- 4.2.4 Regenerative carbon-reactivation service contracts gaining traction
- 4.2.5 Expansion of European beer & hard-seltzer filtration lines
- 4.3 Market Restraints
- 4.3.1 Price volatility of coconut-shell & coal feedstocks
- 4.3.2 Availability of engineered biochar substitutes
- 4.3.3 Carbon Border Adjustment Mechanism cost on coal-based grades
- 4.4 Value Chain Analysis
- 4.5 Porter's Five Forces
- 4.5.1 Bargaining Power of Suppliers
- 4.5.2 Bargaining Power of Buyers
- 4.5.3 Threat of New Entrants
- 4.5.4 Threat of Substitutes
- 4.5.5 Degree of Rivalry
5 Market Size & Growth Forecasts (Value)
- 5.1 By Product Type
- 5.1.1 Powdered Activated Carbon (PAC)
- 5.1.2 Granular Activated Carbon (GAC)
- 5.1.3 Extruded / Pelletized Activated Carbon
- 5.2 By Application
- 5.2.1 Water Purification
- 5.2.2 Gas Purification
- 5.2.3 Metal Purification
- 5.2.4 Medicine
- 5.2.5 Other Industrial Processes (solvent recovery and energy storage)
- 5.3 By Geography
- 5.3.1 Germany
- 5.3.2 United Kingdom
- 5.3.3 France
- 5.3.4 Italy
- 5.3.5 Spain
- 5.3.6 Rest of Europe
6 Competitive Landscape
- 6.1 Market Concentration
- 6.2 Strategic Moves
- 6.3 Market Share(%)/Ranking Analysis
- 6.4 Company Profiles (includes Global level Overview, Market level overview, Core Segments, Financials as available, Strategic Information, Products & Services, and Recent Developments)
- 6.4.1 AdFiS products GmbH
- 6.4.2 Albemarle Corporation
- 6.4.3 Cabot Corporation
- 6.4.4 Calgon Carbon Corporation (Kuraray)
- 6.4.5 Carbon Activated Corporation
- 6.4.6 CarboTech Group
- 6.4.7 Desotec
- 6.4.8 Donau Carbon GmbH
- 6.4.9 Haycarb PLC
- 6.4.10 Ingevity
- 6.4.11 JACOBI CARBONS GROUP
- 6.4.12 KUREHA CORPORATION
- 6.4.13 Norit
- 6.4.14 Puragen
7 Market Opportunities & Future Outlook
- 7.1 White-Space & Unmet-Need Assessment


