

|
시장보고서
상품코드
2122000
활성탄 : 시장 점유율 분석, 업계 동향과 통계, 성장 예측(2026-2031년)Activated Carbon - Market Share Analysis, Industry Trends & Statistics, Growth Forecasts (2026 - 2031) |
||||||
 Mordor Intelligence
Mordor Intelligence에 따르면 활성탄 시장 규모는 2026년에 41억 6,000만 달러로 추정되고 있으며, 예측 기간(2026-2031년)에 CAGR 5.62%로 추이하며, 2031년까지 54억 7,000만 달러에 달할 것으로 전망되고 있습니다.
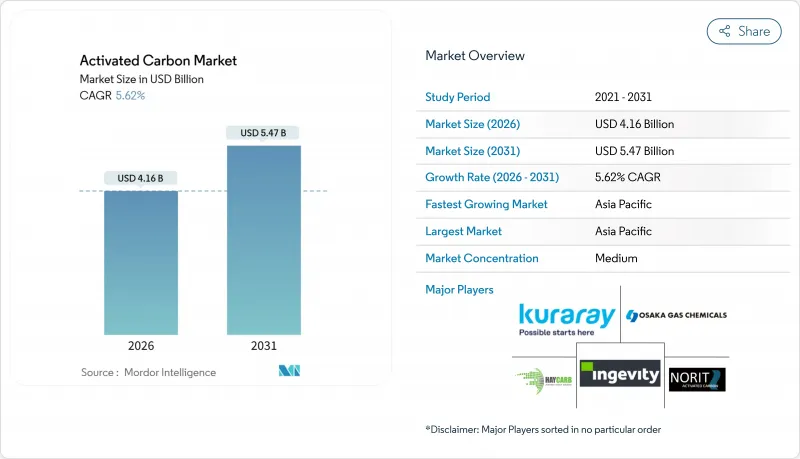
이 보고서는 원료(석탄계, 코코넛 껍질계, 목재계, 기타),형태(분말, 과립, 압출·펠릿화), 용도(탈색, 설탕 제조, 농축, 용매 회수 등), 최종사용자(수처리, 산업 처리 등) 및 지역(아시아태평양, 북미 등)별로 분류되어 있습니다. 시장 예측은 금액(달러)으로 표시되어 있습니다.
전 세계 활성탄 시장의 동향 및 인사이트
수질 정화에 대한 수요 증가
전 세계 규제 당국은 허용되는 오염 물질의 기준치를 지속적으로 낮추고 있으며, 이로 인해 대용량 GAC 필터에 대한 전례 없는 투자가 촉진되고 있습니다. EPA의 PFAS 규제만으로도 미국의 수백개 유틸리티는 American Water가 Calgon Carbon과 체결한 10개 주에 걸친 계약과 같은 다년간의 공급 계약을 체결할 수밖에 없게 되었습니다. 유럽의 공공사업체들도 개정된 음용수 지침에 따라 유사한 압박에 직면해 있는 반면, 인도와 중국의 지자체들은 인구 증가에 따른 수요를 충족하기 위해 처리 능력 확대를 가속화하고 있습니다. 사업자들이 장기적인 폐기물 처리 책임과 높은 초기 투자 비용을 저울질하는 가운데, 선호도는 PAC에서 재생 가능한 GAC 시스템으로 이동하고 있습니다. 유틸리티가 순환형 조달 체계를 우선시하는 가운데, 미사용 제품의 공급과 재활성화 서비스를 모두 보장할 수 있는 공급업체는 경쟁 우위를 누리고 있습니다.
석탄 화력 발전소에 대한 수은 제거 의무
개정된 수은 및 대기 유해 물질 기준에 더해, 중국과 인도에서의 유사한 규제로 인해 배기가스 주입용으로 설계된 분말 및 함침탄에 대한 수요가 증가하고 있습니다. 일부 석탄 화력 발전소는 폐쇄되었지만, 남아 있는 발전 설비는 집진 시스템 업그레이드를 강요받고 있으며, 지역에 따라 편차는 있지만 지속적인 수주 파이프라인이 유지되고 있습니다. 일본에서는 탈탄소화를 위한 광범위한 노력이 진행되는 한편, 엄격한 배출 규제로 인해 안정적인 기본 수요가 유지되고 있습니다. 브롬계 및 할로겐계 등급을 전문으로 하는 공급업체들은 장기간에 걸친 수은 포집의 기술적 복잡성 덕분에 높은 이익률을 확보하고 있습니다.
코코넛 껍질 숯 공급망의 혼란
기상 조건으로 인한 수확량의 급격한 감소에 더해, 수출 규제와 브리켓 등 대체품과의 경쟁이 겹치면서 코코넛 껍질 숯의 공급이 부족해지고 있습니다. 2024년, 인도네시아에서는 수출량과 수출액 모두 감소했습니다. 이러한 감소로 인해 가격은 급등했습니다. 북미와 유럽에서는 특히 PFAS 제거 기준이 코코넛 껍질 유래 등급을 우선시하는 경향이 있었기 때문에 구매자들은 리드타임 장기화와 비용 상승에 직면했습니다. 생산자들은 목재, 이탄, 저품위 석탄 등의 원료로 다각화를 추진하고 있지만, 이러한 대체품들은 미량 오염 물질을 효과적으로 흡착하는 데 필수적인 미세 기공 분포 측면에서 코코넛 껍질에 미치지 못하는 것이 현실입니다. 그 결과, 대규모로 수년간 진행되는 공공사업자의 입찰에서 원료 리스크 관리의 성패가 중요한 차별화 요인으로 부각되고 있습니다.
부문 분석
석탄 유래 제품은 유리한 비용 구조와 중국, 인도, 미국의 광범위한 공급 기반 덕분에 2025년 시점에 활성탄 시장 점유율 43.18%를 유지했습니다. 코코넛 껍질 유래 활성탄은 생산량은 적지만, 규제 당국과 고순도 사용자들로부터 PFAS 및 의약품 제거에 효과적인 초미세 기공 네트워크가 높이 평가받고 있으며, 연평균 성장률(CAGR) 6.78%로 확대될 것으로 예측됩니다. 따라서 코코넛 껍질 유래 활성탄 시장 규모는 2031년까지 다른 모든 원료 카테고리를 능가하는 성장률을 보일 것으로 예상됩니다. 공급업체들이 석탄과 코코넛의 가격 변동 모두에 대한 헤지를 모색함에 따라 이탄 및 갈탄에 대한 시범 시험을 포함한 원료 다각화가 가속화되고 있습니다.
여러 원료를 포트폴리오에 보유한 생산자들은 2024-2025년에 코코넛 껍질 공급 부족 상황에서도 높은 회복력을 보여주었으며, 화학 활성화된 목재나 저등급 석탄으로 혼합 비율을 전환함으로써 계약 물량을 유지했습니다. 2024년에 발표된 기술 논문에서는 일메나이트 및 산화철을 이용한 갈탄 활성화에 성공하여, 고품질 코코넛 껍질 활성탄에 필적하는 요오드수를 얻었음이 밝혀졌습니다. 최종 용도 구매자들은 제품 수명 주기 전반에 걸친 온실가스 배출 프로파일을 평가하는 경향이 강해지고 있으며, 공급업체에 대해 원료 조달, 활성화 에너지, 재활성화 주기에 걸친 배출 강도의 정량화를 요구하고 있습니다. 비용을 중시하는 지자체 입찰에서는 석탄이 계속해서 주류를 이룰 전망이지만, 코코넛 껍질이나 목재 유래 등급은 흡착 성능이 단가를 상회하는 부가가치가 높은 틈새 시장을 확보할 입장에 있습니다.
2025년 활성탄 시장 규모 중 PAC(과립형 활성탄)은 47.86%를 차지했습니다. 이는 빠른 반응 속도와 간편한 투여를 중시하는 대량의 설탕, 음료 및 배치식 수처리 용도에 힘입은 결과입니다. 한편, GAC(덩어리형 활성탄)는 공공사업자들이 총 소유 비용을 절감하기 위해 현장 또는 지역 차원의 재활성화 방식을 채택함에 따라 연평균 성장률(CAGR) 6.30%로 성장할 것으로 예측됩니다. 주요 공급업체들은 스웨덴, 프랑스, 미국 멕시코만 연안 지역에서 신규 소성로 허가를 취득했으며, 이를 통해 운송 거리와 Scope 3 배출량을 줄이는 지역 순환형 경제가 지원되고 있습니다. 활성탄 시장에서는 높은 기계적 강도와 낮은 압력 손실이 필수적인 배기가스 처리 및 자동차 증발 배출 제어 분야에서 압출 성형품과 펠릿형 제품의 점유율이 확대되고 있습니다.
수명주기 경제성 측면에서는 GAC가 유리하며, 이로 인해 더 많은 지자체 입찰자들이 재생 가능한 시스템을 선택하고 있습니다. PAC는 사용 후 매체의 처분이 기존의 슬러지 관리 관행과 부합하는 설탕 탈색 및 간헐적인 배치 처리 용도에서 여전히 확고한 입지를 유지하고 있습니다. 하이브리드 전략도 부상하고 있습니다. 플랜트에서는 기본 유량용 GAC(과립 활성탄) 층을 유지하면서, 갑작스러운 부하 증가 시에는 PAC를 투입함으로써 재생 설비에 대한 과잉 투자를 피하면서도 규제 준수의 유연성을 확보하고 있습니다. 따라서 PAC와 GAC 제품 포트폴리오를 모두 활용하는 공급업체는 고객의 다양한 위험 허용 범위와 현금 흐름 제약에 대응할 수 있습니다.
지역별 분석
아시아태평양은 2025년 매출의 37.72%를 차지하며, 중국의 석탄에서 탄소로 전환, 인도의 급성장하는 지자체 인프라 구축, 그리고 아세안(ASEAN)의 코코넛 껍질 활성탄 수출 확대에 힘입어 2031년까지 연평균 성장률(CAGR) 6.44%를 기록할 것으로 예측됩니다. 2024년, 인도의 수출업체들은 코코넛 껍질 활성탄의 출하량을 확대했으며, 특히 미국, 스리랑카, 벨기에로의 수출이 두드러졌습니다. 한편, 중국의 생산자들은 코크스 오븐의 배기가스를 활용하여 활성화 에너지 비용을 절감하고 있습니다. 탈탄소화 노력이 확산되는 가운데, 일본의 전력 회사는 수은 대책용 활성탄에 대한 강한 수요를 지속적으로 보이고 있습니다.
북미의 활성탄 시장은 PFAS 규제에 대한 대응과 국내 GAC(과립상 활성탄) 생산 능력으로의 결정적인 전환에 의해 형성되고 있습니다. Arq사는 2025년 루이지애나주에서 생산 라인을 가동하며, 해당 지역 최초의 수직 통합형 버진 카본 자산을 구축했습니다. Calgon Carbon사는 2024년에 멕시코만 연안 지역의 재생 능력을 확대하고, 2025년에는 주요 전력 회사에 대한 장기 공급을 확보하기 위해 ‘오퍼레이션 베드록(Operation Bedrock)’을 시작했습니다. 캐나다 및 멕시코의 구매자들은 대륙간 무역 협정으로 인해 납기 단축의 혜택을 누리고 있습니다.
프랑스, 스웨덴, 영국에 신설된 재활성화 허브는 사용 후 활성탄의 운송 거리를 단축하고 있으며, 유럽의 순환형 경제에 대한 노력을 부각시키고 있습니다. 개정된 음용수 지침에 따라 PFAS 군의 기준치가 의무화됨에 따라 미국과 유사한 설비 갱신이 촉진되고 있습니다. 독일, 이탈리아, 스페인 및 북유럽 국가에서는 바이오가스 정제 및 산업용 VOC(휘발성 유기 화합물) 감축으로 인해 수요가 서서히 증가하고 있습니다. 남미에서는 브라질과 아르헨티나가 도시 하수 처리 네트워크를 확충하고 있으며, 낮은 수준에서 수요가 증가하고 있습니다. 한편, 중동 및 아프리카에서는 해수 담수화 및 금 제련 프로젝트와 관련된 도입이 초기 단계에 있지만, 다른 지역에 비하면 그 규모는 여전히 미미합니다.
기타 혜택:
- 엑셀 형식의 시장 예측(ME) 시트
- 3개월간의 애널리스트 지원
자주 묻는 질문
목차
제1장 서론
제2장 조사 방법
제3장 개요
제4장 시장 구도
제5장 시장 규모와 성장 예측
제6장 경쟁 구도
제7장 시장 기회와 향후 전망
KSA 26.09.03According to Mordor Intelligence, the activated carbon market size is estimated at USD 4.16 billion in 2026, and is expected to reach USD 5.47 billion by 2031, at a CAGR of 5.62% during the forecast period (2026-2031).
This report is Segmented by Raw Material (Coal-Based, Coconut-Shell-Based, Wood-Based, and Other), Form (Powdered, Granular, and Extruded/Pelletised), Application (Decolorisation, Sugar Production, Concentration, Solvent Recovery, and More), End-User (Water Treatment, Industrial Processing, and More), and Geography (Asia-Pacific, North America, and More). Market Forecasts are Provided in Terms of Value (USD).
Global Activated Carbon Market Trends and Insights
Growing Demand for Water Purification
Regulators worldwide continue to ratchet down allowable contaminant thresholds, driving unprecedented investment in high-capacity GAC filters. The EPA's PFAS rule alone is forcing hundreds of U.S. utilities to lock in multi-year supply contracts, such as American Water's ten-state deal with Calgon Carbon. European utilities face similar pressure under the updated Drinking Water Directive, while Indian and Chinese municipalities accelerate capacity to meet population-driven demand. The preference is shifting from PAC toward regenerable GAC systems, as operators weigh long-term disposal liabilities against higher up-front capital outlays. Suppliers able to guarantee both virgin supply and reactivation services enjoy a competitive advantage as utilities prioritize circular procurement frameworks.
Mercury-Removal Mandates for Coal-Fired Plants
Revised Mercury and Air Toxics Standards in the United States, coupled with comparable rules in China and India, are reinforcing demand for powdered and impregnated carbons designed for flue-gas injection. Although portions of the coal fleet are retiring, remaining units must upgrade capture systems, sustaining a durable, if regionally uneven, order pipeline. Japan's strict emission controls add a steady baseline demand despite the country's broader decarbonization push. Suppliers specializing in brominated or halogenated grades secure premium margins thanks to the technical complexity of long-duration mercury capture.
Supply-Chain Disruption for Coconut-Shell Charcoal
Weather-related harvest shocks, coupled with export restrictions and competition from alternatives like briquettes, have led to a tightening of coconut-shell charcoal supplies. In 2024, Indonesia saw its exports drop in volume and value. This decline caused prices to surge. In North America and Europe, buyers contended with longer lead times and heightened costs, especially since PFAS removal standards leaned towards coconut-shell grades. While producers are branching out into wood, peat, and low-rank coal precursors, these substitutes fall short in micropore distribution, which is crucial for effective trace-contaminant adsorption. As a result, adept feedstock risk management has emerged as a key differentiator in extensive, multi-year utility tenders.
Other drivers and restraints analyzed in the detailed report include:
- Surge in Low-Sulphur Fuel Regulations Boosting Solvent Recovery
- Increasing Biogas Upgrading and H2S Scrubbing at Small-Scale Plants
- Coal-Price Volatility Squeezing Margins
For complete list of drivers and restraints, kindly check the Table Of Contents.
Segment Analysis
Coal-derived products retained 43.18% of the activated carbon market share in 2025 because of their favorable cost structure and extensive supply footprints in China, India, and the United States. Coconut-shell-based carbons, while smaller in tonnage, are projected to expand at a 6.78% CAGR as regulators and high-purity users favor their ultrafine micropore network for PFAS and pharmaceutical removal. The activated carbon market size for coconut-shell grades is therefore expected to outpace every other raw-material category through 2031. Feedstock diversification, including pilot work on peat and lignite, is accelerating as suppliers hedge against both coal and coconut price swings.
Producers with multi-feedstock portfolios demonstrated greater resilience during the 2024-2025 coconut-shell shortfall, maintaining contractual volumes by switching to chemically activated wood or low-rank coal blends. Technical papers published in 2024 showed successful ilmenite- and iron-oxide-assisted activation of lignite, yielding iodine numbers comparable to premium coconut carbons. End-use buyers increasingly evaluate lifecycle greenhouse-gas profiles, pushing suppliers to quantify emission intensity across precursor sourcing, activation energy, and reactivation cycles. Coal will remain dominant in cost-sensitive municipal tenders, yet coconut-shell and wood grades are positioned to capture value-added niches where adsorption performance outweighs unit price.
PAC represented 47.86% of the activated carbon market size in 2025, anchored in large-volume sugar, beverage, and batch water-treatment applications that value fast kinetics and straightforward dosing. GAC, however, is forecast to grow at a 6.30% CAGR as utilities embrace on-site or regional reactivation to trim the total cost of ownership. Major suppliers secured permits for new furnaces in Sweden, France, and the U.S. Gulf Coast, underpinning a regional circular economy that reduces haul-back distances and Scope 3 emissions. The activated carbon market sees extruded and pelletized shapes gaining share in flue-gas and automotive evaporative-emission control, where high mechanical strength and low pressure drop are essential.
Lifecycle economics favor GAC, tipping more municipal bidders toward regenerable systems. PAC remains entrenched in sugar decolorization and intermittent batch uses where spent media disposal aligns with existing sludge management practices. Hybrid strategies are emerging: plants dose PAC for shock-load events while maintaining base-flow GAC beds, enabling compliance flexibility without overcapitalizing reactivation assets. Suppliers leveraging both PAC and GAC portfolios can therefore align with diverse customer risk appetites and cash-flow constraints.
Complete Report Scope:
- By Raw Material
- Coal-Based
- Coconut-Shell-Based
- Wood-Based
- Other (Peat, Lignite, etc.)
- By Form
- Powdered Activated Carbon (PAC)
- Granular Activated Carbon (GAC)
- Extruded/Pelletised Activated Carbon (EAC)
- By Application
- Decolorisation Treatment
- Sugar Production
- Concentration Treatment
- Solvent Recovery
- PFAS Adsorption Treatment
- Drinking Water Treatment
- Other Applications
- By End-user Industry
- Water Treatment
- Industrial Processing
- Healthcare
- Food and Beverage
- Automotive
- Other End-user Industries
- By Geography
- Asia-Pacifc
- China
- India
- Japan
- South Korea
- ASEAN Countries
- Rest of Asia-Pacific
- North America
- United States
- Canada
- Mexico
- Europe
- Germany
- United Kingdom
- France
- Italy
- Spain
- NORDIC Countries
- Rest of Europe
- South America
- Brazil
- Argentina
- Rest of South America
- Middle-East and Africa
- Saudi Arabia
- South Africa
- Rest of Middle-East and Africa
- Asia-Pacifc
Geography Analysis
Asia-Pacific retained 37.72% of 2025 revenue and is anticipated to post a 6.44% CAGR through 2031, driven by Chinese coal-to-carbon integration, India's burgeoning municipal buildout, and ASEAN's expanding coconut-shell charcoal exports. In 2024, Indian exporters boosted shipments of coconut-shell carbon, with notable exports flowing to the United States, Sri Lanka, and Belgium. Meanwhile, Chinese producers are harnessing coke-oven off-gases to cut down on activation energy costs. Despite wider decarbonization initiatives, Japanese utilities continue to show a strong demand for mercury-control carbons.
North America's activated carbon market is shaped by PFAS compliance and a decisive pivot toward domestic GAC capacity. Arq commissioned a line in Louisiana during 2025, marking the region's first vertically integrated virgin-carbon asset. Calgon Carbon expanded Gulf Coast reactivation capacity in 2024 and launched "Operation Bedrock" in 2025 to secure long-term supply for major utilities. Canadian and Mexican buyers benefit from shorter delivery lead times under continental trade agreements.
New reactivation hubs in France, Sweden, and the United Kingdom are cutting spent-carbon shipping distances, underscoring Europe's commitment to circularity. The revised Drinking Water Directive enforces PFAS group limits, prompting capital upgrades analogous to U.S. programs. Germany, Italy, Spain, and the Nordics add incremental demand from biogas upgrading and industrial VOC abatement. South America grows from a low base as Brazil and Argentina expand municipal networks, while the Middle East and Africa see early-stage adoption tied to desalination and gold-processing projects, though volumes remain modest relative to other regions.
- Albemarle Corporation
- Arq, Inc.
- Carbon Activated Corporation
- CarboTech
- Donau Carbon GmbH
- Haycarb PLC
- Ingevity
- KALPAKA Chemicals
- KURARAY CO., LTD.
- MICBAC India
- Nanping Yuanli Active Carbon Company
- Norit
- Osaka Gas Chemicals Co., Ltd.
- Puragen
- Rotocarb (PTY) Ltd.
- Shanghai Activated Carbon Co.,Ltd
- Silcarbon Aktivkohle GmbH
- Suneeta Carbons
- Xylem
Additional Benefits:
- The market estimate (ME) sheet in Excel format
- 3 months of analyst support
TABLE OF CONTENTS
1 Introduction
- 1.1 Study Assumptions and Market Definition
- 1.2 Scope of the Study
2 Research Methodology
3 Executive Summary
4 Market Landscape
- 4.1 Market Overview
- 4.2 Market Drivers
- 4.2.1 Growing demand for water purification
- 4.2.2 Mercury-removal mandates for coal-fired plants
- 4.2.3 Surge in low-sulphur fuel regulations boosting solvent-recovery activated carbon
- 4.2.4 Increasing Bio-gas upgrading and H2S scrubbing at small-scale plants
- 4.2.5 Growing usage of activated carbon for air purification
- 4.3 Market Restraints
- 4.3.1 Supply-chain disruption for coconut shell charcoal
- 4.3.2 Coal-price volatility squeezing margins
- 4.3.3 High cap-ex for regional reactivation hubs
- 4.4 Value Chain Analysis
- 4.5 Porter's Five Forces
- 4.5.1 Bargaining Power of Suppliers
- 4.5.2 Bargaining Power of Buyers
- 4.5.3 Threat of New Entrants
- 4.5.4 Threat of Substitutes
- 4.5.5 Degree of Competition
5 Market Size and Growth Forecasts (Value and Volume)
- 5.1 By Raw Material
- 5.1.1 Coal-Based
- 5.1.2 Coconut-Shell-Based
- 5.1.3 Wood-Based
- 5.1.4 Other (Peat, Lignite, etc.)
- 5.2 By Form
- 5.2.1 Powdered Activated Carbon (PAC)
- 5.2.2 Granular Activated Carbon (GAC)
- 5.2.3 Extruded/Pelletised Activated Carbon (EAC)
- 5.3 By Application
- 5.3.1 Decolorisation Treatment
- 5.3.2 Sugar Production
- 5.3.3 Concentration Treatment
- 5.3.4 Solvent Recovery
- 5.3.5 PFAS Adsorption Treatment
- 5.3.6 Drinking Water Treatment
- 5.3.7 Other Applications
- 5.4 By End-user Industry
- 5.4.1 Water Treatment
- 5.4.2 Industrial Processing
- 5.4.3 Healthcare
- 5.4.4 Food and Beverage
- 5.4.5 Automotive
- 5.4.6 Other End-user Industries
- 5.5 By Geography
- 5.5.1 Asia-Pacifc
- 5.5.1.1 China
- 5.5.1.2 India
- 5.5.1.3 Japan
- 5.5.1.4 South Korea
- 5.5.1.5 ASEAN Countries
- 5.5.1.6 Rest of Asia-Pacific
- 5.5.2 North America
- 5.5.2.1 United States
- 5.5.2.2 Canada
- 5.5.2.3 Mexico
- 5.5.3 Europe
- 5.5.3.1 Germany
- 5.5.3.2 United Kingdom
- 5.5.3.3 France
- 5.5.3.4 Italy
- 5.5.3.5 Spain
- 5.5.3.6 NORDIC Countries
- 5.5.3.7 Rest of Europe
- 5.5.4 South America
- 5.5.4.1 Brazil
- 5.5.4.2 Argentina
- 5.5.4.3 Rest of South America
- 5.5.5 Middle-East and Africa
- 5.5.5.1 Saudi Arabia
- 5.5.5.2 South Africa
- 5.5.5.3 Rest of Middle-East and Africa
- 5.5.1 Asia-Pacifc
6 Competitive Landscape
- 6.1 Market Concentration
- 6.2 Strategic Moves
- 6.3 Market Share(%)/Ranking Analysis
- 6.4 Company Profiles
- 6.4.1 Albemarle Corporation
- 6.4.2 Arq, Inc.
- 6.4.3 Carbon Activated Corporation
- 6.4.4 CarboTech
- 6.4.5 Donau Carbon GmbH
- 6.4.6 Haycarb PLC
- 6.4.7 Ingevity
- 6.4.8 KALPAKA Chemicals
- 6.4.9 KURARAY CO., LTD.
- 6.4.10 MICBAC India
- 6.4.11 Nanping Yuanli Active Carbon Company
- 6.4.12 Norit
- 6.4.13 Osaka Gas Chemicals Co., Ltd.
- 6.4.14 Puragen
- 6.4.15 Rotocarb (PTY) Ltd.
- 6.4.16 Shanghai Activated Carbon Co.,Ltd
- 6.4.17 Silcarbon Aktivkohle GmbH
- 6.4.18 Suneeta Carbons
- 6.4.19 Xylem
7 Market Opportunities and Future Outlook
- 7.1 White-space and Unmet-Need Assessment
- 7.2 Rising PFAS-remediation spend by utilities


