

|
시장보고서
상품코드
2121889
미국의 음료 포장 시장 : 시장 점유율 분석, 업계 동향 및 통계, 성장 예측(2026-2031년)US Beverage Packaging - Market Share Analysis, Industry Trends & Statistics, Growth Forecasts (2026 - 2031) |
||||||
 Mordor Intelligence
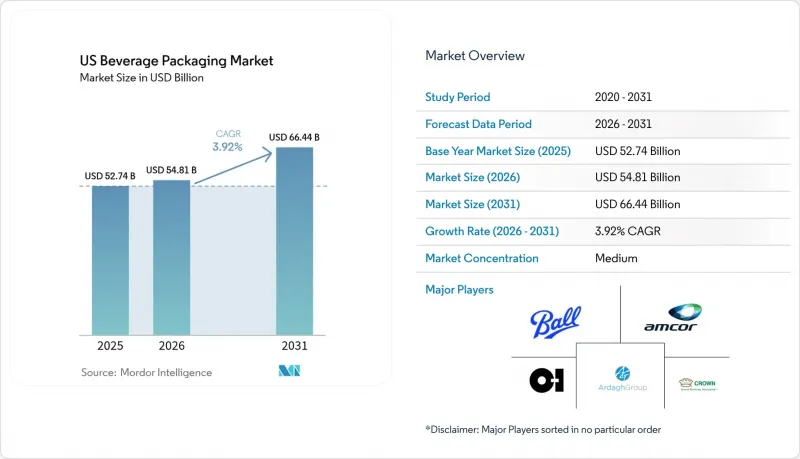
Mordor Intelligence에 의하면, 미국의 음료 포장 시장 규모는 2025년 527억 4,000만 달러로 평가되었고, 2026년에는 548억 1,000만 달러로 추정되고, 2026-2031년 CAGR 3.92%로 성장을 지속할 전망이며, 2031년에는 664억 4,000만 달러에 이를 것으로 예측됩니다.
본 보고서는 소재별(플라스틱, 금속, 유리, 판지), 제품 유형별(병, 캔, 파우치, 카톤,맥주통), 용도별(주류, 우유 및 유제품 대체품, 에너지 음료 및 기능성 음료, 탄산 청량음료 및 물, 기타 음료), 포장 형태별(경질, 연질)로 분류되어 있습니다. 시장 예측은 금액(달러) 기준으로 제시되어 있습니다.
미국의 음료 포장 시장 동향 및 인사이트
지속가능성을 중시한 경량화 및 rPET 의무화
캘리포니아주의 AB 793 법안은 2022년에 PET 음료 용기의 재생재 함유율 하한을 15%로 설정하였고, 2030년까지 50%로 상향 조정하도록 규정하고 있으며, 뉴욕주, 뉴저지주, 매사추세츠주의 입법자들이 적극적으로 검토하고 있는 청사진이 되고 있습니다. 재생 PET는 버진 수지에 비해 15-25%의 추가 비용이 발생하기 때문에 각 브랜드사는 용기 1개당 폴리머 사용량을 8-12% 줄이는 경량화에 투자할 수밖에 없습니다. 펩시코가 일부 생수 제품 라인에서 100% rPET로 전환한 결과, 상품의 진열 상태를 유지하면서도 이산화탄소 배출량을 31% 감축했습니다. 규제 준수를 목적으로 한 생산 라인 개조로 인해 물류 및 가공 비용이 단위당 0.03-0.08달러 증가했으나, 각 브랜드는 저탄소 포장을 전면에 내세움으로써 5-8%의 가격 인상을 실현하고 있습니다.
RTD 커피 및 에너지 드링크 신제품 출시 급증
현재 RTD(즉석 음용) 에너지 드링크는 편의점 RTD 매출의 37%를 차지했으며, 이는 2020년의 28%에서 증가한 수치입니다. 또한 신제품의 거의 전부가 알루미늄 용기를 채택하고 있습니다. 몬스터 베버리지(Monster Beverage)사의 전 세계 판매량의 97%는 알루미늄 용기를 통해 이루어지며, 2025년에는 71억 달러의 순매출을 예상하고 있어, 프리미엄 가격 책정을 통해 원자재 가격 급등을 상쇄하고 있습니다. 알루미늄의 경량성과 산소 차단성은 커피의 향을 유지하고 기능성 성분의 안정성을 확보하는 데 도움이 되며, 냉장 유통 없이도 유통 기한을 연장하여 콜드체인 비용을 최대 30% 절감합니다. 2018-2023년 새로운 RTD 커피 품목 수(SKU)는 73% 증가했으며, 그중 60%는 풍미 유지와 디자인 다양성을 이유로 캔을 채택했습니다.
변동이 심한 버진 수지 가격
모노머 가격 변동(특히 에틸렌 및 파라자일렌)은 걸프 코스트 현물 시장에서 정기적으로 파운드당 25-30센트에 달하며, 생수 및 탄산음료(CSD) 제조업체의 PET 비용 구조를 불안정하게 만들고 있습니다. 선물 헤지 여지가 제한적이기 때문에 소규모 병입 업체들은 분기별 이익률이 압박을 받고 있습니다.
부문 분석
2025년에도 플라스틱은 44.85%라는 가장 큰 점유율을 유지했지만, 금속 포장은 연평균 성장률(CAGR) 5.92%를 기록하며 모든 소재 중 가장 높은 성장률을 보일 것으로 예측됩니다. 미국의 음료 포장 시장에서 금속 용기 시장 규모는 2031년까지 291억 5,000만 달러를 넘어설 것으로 예측되며, 이는 무한히 재활용 가능한 형태에 대한 소비자의 선호도와 사용 후 재활용 소재(PCR) 함유율이 높다는 점에 대한 규제 당국의 긍정적 평가를 반영한 것입니다. 알루미늄의 차단성은 에너지 드링크 및 RTD 커피의 풍미 저하를 방지하고, 단위 비용 상승을 상쇄하는 프리미엄 가격 책정을 뒷받침하고 있습니다.
볼 코퍼레이션은 2030년까지 재활용률 90%, 재생 소재 함유율 85%를 목표로 하고 있으며, 스코프 3 배출량 감축을 지향하는 소매업체들의 공감을 불러일으키는 ‘클로즈드 루프’ 스토리를 구축하고 있습니다. 유리는 용해로 폐쇄와 에너지 집약적인 용해 공정이라는 역풍에 직면한 반면, 판지 카톤은 대량 생산에서 PET와 동등한 비용 경쟁력을 실현한, 97%가 재생 가능 자원에서 유래한 ‘Elopak Pure-Pak’ 구조 덕분에 기세를 더하고 있습니다. 폴리머 함량을 최대 15%까지 줄이는 적극적인 경량화가 진행되고 있음에도 불구하고, 재생 PET공급 부족이 여전히 플라스틱 시장 침투를 억제하고 있습니다.
2025년, 병은 미국 음료 포장 시장에서 27.25%의 점유율을 차지했지만, 휴대성, 냉장 효율 및 맞춤형 인쇄를 강점으로 하는 캔은 연평균 성장률(CAGR) 6.78%로 성장하고 있습니다. 캔은 쌓을 수 있는 형태 덕분에 유리병에 비해 운송 비용을 20-25% 절감할 수 있어, 크래프트 맥주, 향이 첨가된 셀처, 비타민 강화수 제조업체들 사이에서 용기 전환이 진행되고 있습니다.
캔 제조업체 협회 데이터에 따르면, 2025년에 출시될 음료의 70% 이상이 캔에 담겨 있을 것으로 예상되며, 이는 5년 전 45%에서 증가한 수치입니다. 디지털 인쇄 기술 덕분에 리드타임이 몇 주에서 며칠로 단축되어 SKU 증가가 가속화되고 있습니다. 이는 한정판 RTD 커피 콜라보 상품에 있어 매우 중요합니다. 병 분야의 혁신은 가볍고 재사용 가능한 PET 및 유리에 초점이 맞추어져 있는 반면, 파우치와 카톤은 어린이용 음료나 무균 처리된 유제품 대체품과 같은 틈새 시장에서의 활용 사례에서 지지를 얻고 있습니다.
기타 혜택 :
- 엑셀 형식 시장 예측(ME) 시트
- 3개월간의 애널리스트 지원
자주 묻는 질문
목차
제1장 서론
제2장 조사 방법
제3장 주요 요약
제4장 시장 구도
제5장 시장 규모 및 성장 예측
제6장 경쟁 구도
제7장 시장 기회 및 향후 전망
AJY 26.09.09According to Mordor Intelligence, the US beverage packaging market size is expected to grow from USD 52.74 billion in 2025 to USD 54.81 billion in 2026 and is forecast to reach USD 66.44 billion by 2031 at 3.92% CAGR over 2026-2031.
This report is Segmented by Material (Plastic, Metal, Glass, Paperboard), Product Type (Bottles, Cans, Pouches, Cartons, Beer Kegs), Application (Alcoholic Beverages, Milk and Dairy Alternatives, Energy and Functional Drinks, Carbonated Soft Drinks and Water, Other Beverages), Packaging Format (Rigid, Flexible). The Market Forecasts are Provided in Terms of Value (USD).
US Beverage Packaging Market Trends and Insights
Sustainability-driven lightweighting and rPET mandates
California's AB 793 set a 15% recycled-content floor for PET beverage containers in 2022 that rises to 50% by 2030, providing a blueprint that New York, New Jersey, and Massachusetts lawmakers are actively considering. Recycled PET carries 15-25% cost premiums over virgin resin, compelling brands to invest in lightweighting that reduces polymer usage by 8-12% per container. PepsiCo's 100% rPET shift on select water lines trimmed carbon emissions by 31% while retaining shelf integrity. Compliance-driven line retrofits add USD 0.03-0.08 per unit in logistics and processing overhead, yet brands are capturing 5-8% price lifts by marketing lower-carbon packaging.
Surge in RTD coffee and energy drink launches
RTD energy beverages now account for 37% of convenience-store RTD sales, up from 28% in 2020, and nearly every major launch uses aluminum formats. Monster Beverage derives 97% of its global volume from aluminum containers, enabling USD 7.1 billion in 2025 net sales while offsetting commodity inflation through premium pricing. Aluminum's light- and oxygen-barrier attributes help maintain coffee aromatics and functional ingredient stability, extending shelf life without chilled distribution and lowering cold-chain costs by up to 30%. New RTD coffee stock-keeping units (SKUs) rose 73% from 2018-2023, and 60% of those used cans because of flavor preservation and decoration versatility.
Volatile virgin resin prices
Monomer price swings-particularly ethylene and paraxylene-regularly reach 25-30 c/lb in Gulf Coast spot markets, destabilizing PET cost structures for bottled water and carbonated soft drink (CSD) producers. Forward hedging is limited, causing quarterly margin compression for small bottlers.
Other drivers and restraints analyzed in the detailed report include:
- Craft beer's switch to aluminum cans
- E-commerce-tailored "ship-in-own-container" formats
- Glass furnace capacity rationalization
For complete list of drivers and restraints, kindly check the Table Of Contents.
Segment Analysis
Plastic kept the largest share at 44.85% in 2025, yet metal packaging is projected to post a 5.92% CAGR, the fastest among all materials. The US beverage packaging market size for metal containers is forecast to exceed USD 29.15 billion by 2031, reflecting consumer preference for infinitely recyclable formats and regulatory credit for higher post-consumer recycled (PCR) content. Aluminum's barrier properties guard flavor volatility in energy drinks and RTD coffee, supporting premium shelf pricing that offsets higher unit costs.
Ball Corporation targets 90% recycling rates and 85% recycled content by 2030, creating a closed-loop narrative that resonates with retailers pursuing Scope 3 emission cuts. Glass faces headwinds from furnace closures and energy-intensive melting, while paperboard cartons gain momentum through 97% renewable Elopak Pure-Pak structures that reach cost parity with PET at high volume. Recycled PET shortages still restrain plastic penetration despite aggressive lightweighting that cuts polymer content by up to 15%.
Bottles commanded 27.25% of the US beverage packaging market in 2025; however, cans are pacing at a 6.78% CAGR, driven by portability, refrigeration efficiency, and customizable printing. Cans' stackable geometry yields 20-25% freight savings over glass bottles, encouraging conversion among craft beer, flavored seltzer, and vitamin-enriched water producers.
Over 70% of 2025 beverage launches are in cans compared with 45% five years earlier, according to Can Manufacturers Institute data. Digital-print technology accelerates SKU proliferation by shrinking lead times from weeks to days, vital for limited edition RTD coffee collaborations. Bottle innovation centers on lightweight refillable PET and glass, while pouches and cartons appeal to niche use cases such as children's beverages or aseptic dairy alternatives.
Complete Report Scope:
- By Material
- Plastic
- Metal
- Glass
- Paperboard
- By Product Type
- Bottles
- Cans
- Pouches
- Cartons
- Beer Kegs
- By Application
- Alcoholic Beverages
- Milk and Dairy Alternatives
- Energy and Functional Drinks
- Carbonated Soft Drinks and Water
- Other Beverages
- By Packaging Format
- Rigid
- Flexible
List of Companies Covered in this Report:
- Ball Corporation
- Crown Holdings Inc.
- Owens-Illinois Inc.
- Ardagh Group
- Amcor plc
- Berry Global Inc.
- Silgan Holdings Inc.
- WestRock Co.
- Berlin Packaging
- Sonoco Products Co.
- CCL Containers Inc.
- Graphic Packaging Holding
- Tetra Pak Inc.
- SIG Combibloc
- Canpack S.A.
- Plastipak Holdings Inc.
- Novolex
- Printpack Inc.
- ProAmpac LLC
- American Canning
Additional Benefits:
- The market estimate (ME) sheet in Excel format
- 3 months of analyst support
TABLE OF CONTENTS
1 INTRODUCTION
- 1.1 Study Assumptions and Market Definition
- 1.2 Scope of the Study
2 RESEARCH METHODOLOGY
3 EXECUTIVE SUMMARY
4 MARKET LANDSCAPE
- 4.1 Market Overview
- 4.2 Market Drivers
- 4.2.1 Sustainability-driven lightweighting and rPET mandates
- 4.2.2 Surge in RTD coffee/energy drink launches
- 4.2.3 Craft beer's switch to aluminum cans
- 4.2.4 E-commerce-tailored "ship-in-own-container" formats
- 4.2.5 Tethered-cap rule (CFR Title 21 update) spurring redesigns
- 4.2.6 Premiumpositioning through aluminum's recyclability credentials
- 4.3 Market Restraints
- 4.3.1 Volatile virgin resin prices
- 4.3.2 Glass furnace capacity rationalization
- 4.3.3 Deposit-return expansions raising compliance costs
- 4.3.4 Recycled PET feedstock shortages
- 4.4 Supply-Chain Analysis
- 4.5 Regulatory Landscape
- 4.6 Technological Outlook
- 4.7 Porter's Five Forces
- 4.7.1 Threat of New Entrants
- 4.7.2 Bargaining Power of Buyers
- 4.7.3 Bargaining Power of Suppliers
- 4.7.4 Threat of Substitute Products
- 4.7.5 Intensity of Competitive Rivalry
- 4.8 Assesment of macroeconomic Factors on the market
5 MARKET SIZE AND GROWTH FORECASTS (VALUE)
- 5.1 By Material
- 5.1.1 Plastic
- 5.1.2 Metal
- 5.1.3 Glass
- 5.1.4 Paperboard
- 5.2 By Product Type
- 5.2.1 Bottles
- 5.2.2 Cans
- 5.2.3 Pouches
- 5.2.4 Cartons
- 5.2.5 Beer Kegs
- 5.3 By Application
- 5.3.1 Alcoholic Beverages
- 5.3.2 Milk and Dairy Alternatives
- 5.3.3 Energy and Functional Drinks
- 5.3.4 Carbonated Soft Drinks and Water
- 5.3.5 Other Beverages
- 5.4 By Packaging Format
- 5.4.1 Rigid
- 5.4.2 Flexible
6 COMPETITIVE LANDSCAPE
- 6.1 Market Concentration
- 6.2 Strategic Moves
- 6.3 Market Share Analysis
- 6.4 Company Profiles (includes Global level Overview, Market level overview, Core Segments, Financials as available, Strategic Information, Market Rank/Share for key companies, Products and Services, and Recent Developments)
- 6.4.1 Ball Corporation
- 6.4.2 Crown Holdings Inc.
- 6.4.3 Owens-Illinois Inc.
- 6.4.4 Ardagh Group
- 6.4.5 Amcor plc
- 6.4.6 Berry Global Inc.
- 6.4.7 Silgan Holdings Inc.
- 6.4.8 WestRock Co.
- 6.4.9 Berlin Packaging
- 6.4.10 Sonoco Products Co.
- 6.4.11 CCL Containers Inc.
- 6.4.12 Graphic Packaging Holding
- 6.4.13 Tetra Pak Inc.
- 6.4.14 SIG Combibloc
- 6.4.15 Canpack S.A.
- 6.4.16 Plastipak Holdings Inc.
- 6.4.17 Novolex
- 6.4.18 Printpack Inc.
- 6.4.19 ProAmpac LLC
- 6.4.20 American Canning
7 MARKET OPPORTUNITIES AND FUTURE OUTLOOK
- 7.1 White-space and Unmet-Need Assessment


