|
시장보고서
상품코드
2123600
사하라 이남 아프리카 자동차 시장 : 점유율 분석, 업계 동향과 통계, 성장 예측(2026-2031년)Sub-Saharan Africa Automotive - Market Share Analysis, Industry Trends & Statistics, Growth Forecasts (2026 - 2031) |
||||||
 Mordor Intelligence
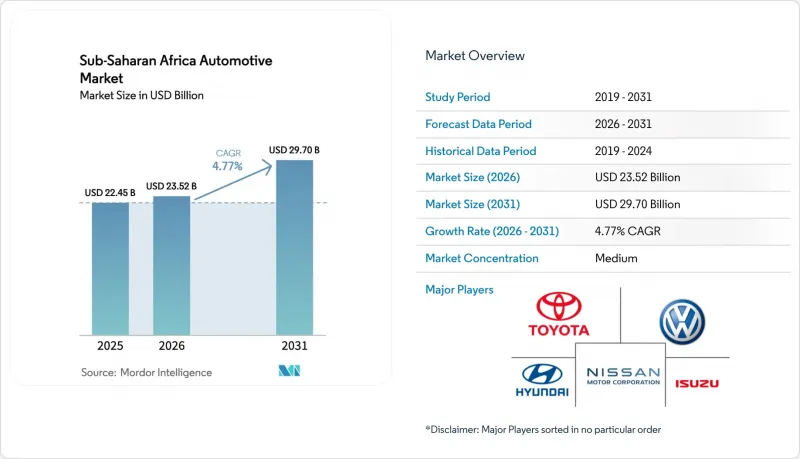
Mordor Intelligence에 의하면, 2026년 사하라 이남 아프리카 자동차 시장 규모는 235억 2,000만 달러로 추정되고 있어 2025년 224억 5,000만 달러에서 확대되고 있습니다.
2031년 예측치는 297억 달러이며, 2026년부터 2031년까지의 연평균 성장률(CAGR)은 4.77%입니다.
본 보고서는 차종(승용차, 소형 상용차 등), 연료 유형(가솔린, 디젤 등), 구동 기술(내연기관(ICE), 하이브리드 전기차(HEV) 등), 판매 채널 및 국가별로 분류되어 있습니다. 시장 예측은 금액(달러) 및 수량(대수) 단위로 제시됩니다.
사하라 이남 아프리카 자동차 시장 동향 및 인사이트
중산층 소득 증가와 도시화
도시 인구가 연평균 4.1% 증가함에 따라, 구매력은 딜러 네트워크, 금융 옵션, 애프터마켓 서비스가 집중된 대도시권으로 이동하고 있습니다. 나이지리아, 케냐, 가나의 중산층 가구는 합리적인 가격의 모델을 선호하는 경향이 있어, 중국 및 인도 자동차 제조업체 간의 경쟁이 격화되고 있습니다. 콤팩트 SUV와 해치백은 교통 체증이 심한 도로에서 뛰어난 기동성으로 인기를 끌고 있지만, 도시 외곽 지역의 소비자들은 도심 지역의 트레이드인 수요 증가에 힘입어 유입되는 중고차에 의존하고 있습니다. 금융 기관들은 고용 집적지를 따라가고 있으며, 그 결과 인구 100만 명 이상의 도시 지역에서는 농촌 지역에 비해 최대 5배에 달하는 자동차 대출 상품이 제공되고 있습니다. 현지 통화의 가치 하락으로 수입차 구매 부담은 커지고 있지만, 자원 채굴 부문과 연동된 임금 상승이 가격 상승 압력을 부분적으로 상쇄하며 수요를 지탱하고 있습니다.
라이드셰어 플랫폼의 급증으로 차량 교체 주기 단축
Moove와 같은 제공업체가 제공하는 체계적인 차량 금융 프로그램을 통해 라이드셰어 운전자는 기존의 신용 심사 장벽을 피할 수 있게 되었으며, 이는 사하라 이남 아프리카 자동차 시장의 다년간에 걸친 기초 수요를 끌어올리고 있습니다. 라이드셰어 차량은 하루 8-12시간 가동되며, 이는 개인 이용 시 가동 시간의 약 4배에 달하기 때문에 차량 교체 주기는 3-4년으로 단축되었습니다. 이러한 예측 가능한 가동 리듬 덕분에 자동차 제조업체는 재고 계획을 플랫폼의 조달 일정에 맞출 수 있어, 소비자의 구매 의욕이 떨어지더라도 판매 대수를 확보할 수 있습니다. 2025년 시점에서 나이지리아, 케냐, 남아프리카공화국 3개국을 합치면 45만 명 이상의 활성 라이드셰어 운전자가 활동 중이며, 지방 도시로의 플랫폼 확장에 따라 잠재적 수요는 더욱 확대되고 있습니다. 정부 기관들도 이러한 차량군을 운송 서비스의 정규화를 촉진하는 촉매제로 점점 더 인식하고 있으며, 에티오피아와 가나에서는 라이드셰어에 도입되는 저공해 차량에 대해 관세 환급 조치를 취하고 있습니다. 그 결과 차량 대수가 증가함에 따라, 많은 시장에서 소매 대출의 접근성이 제한적이라는 위험이 완화되고 있습니다.
중고차 수입의 지배적 지위
아프리카 자동차 제조업체 협회(African Association of Automotive Manufacturers)에 따르면, 2024년 사하라 이남 아프리카 전역의 소형차 등록 대수 중 83%를 중고차가 차지했습니다. 남아프리카공화국 국세청의 관세 데이터에 따르면, 중고차와 신차의 가격 차이가 45-60%에 달하고, 구매자의 선호도를 좌우하고 있습니다. 이 가격 차이는 현지 통화의 가치 하락으로 인해 신차 판매 가격이 상승할 때마다 더욱 확대됩니다. 경제적으로 부유한 국가들에서 내연기관(ICE) 차량의 등록 말소 전망으로 인해, 2030년까지 연간 1,500만 대의 추가 수출 가능 대수가 발생할 가능성이 있습니다. 이로 인해 더 엄격한 수입 품질 기준이 정착되지 않는 한, 해당 지역에서 고배출 가스 차량의 사용이 장기화될 우려가 있습니다. 유엔 유럽 경제 위원회(UNECE)의 차량 적합성 프로토콜은 기준을 충족하지 않는 차량의 유입을 막는 것을 목적으로 하고 있지만, 국경 검문소별 집행 상황에 차이가 있어 그 효과는 여전히 미미합니다.
부문 분석
승용차는 2025년 사하라 이남 아프리카 자동차 시장 총 판매 대수에서 73.80%의 점유율을 유지하고 있으며, 중산층의 확대에 따라 2031년까지 연평균 성장률(CAGR) 5.56%를 나타낼 것으로 예측됩니다. 소형 상용차(LCV)는 전자상거래의 가속화에 힘입어 성장하고 있으며, 특히 나이지리아와 케냐에서는 라스트 마일 배송 사업자들이 인구 밀집 도시 지역의 노선에 최적화된 소형 밴을 리스하고 있습니다. 중형 및 대형 트럭은 남아프리카공화국, 잠비아,앙골라에서의 상품 수출 경기 변동에 연동되어 시장 전체의 성장에 뒤처지고 있습니다. 카셰어링 차량군은 승용차 수요의 안정을 뒷받침하고 있으며, 초기 비용 부담을 경감하는 체계적인 금융 프로그램을 통해 세단 및 해치백 재고를 흡수하고 있습니다.
에티오피아에서는 정책 주도의 전동화가 승용차 구성을 재편하고 있습니다. 신규 등록 차량의 60%를 전기차로할 것이 의무화되어 있으며, 이로 인해 전용 조립 사업과 공공 부문의 조달이 촉진되고 있습니다. 한편, 상용차의 전기화는 적재량과 주행 거리 제약으로 인해 뒤처지고 있지만, 요하네스버그에서는 도시 지역 물류 업무 주기 내에서 배터리식 전기 밴을 시범적으로 도입하는 파일럿 프로그램이 시행되고 있습니다. 승용차 부문의 지속적인 성장세는 사하라 이남 아프리카 자동차 시장 전체의 통화 안정성과 대출 접근성에 관한 진보적인 개혁에 여전히 좌우될 것입니다.
2025년, 사하라 이남 아프리카 자동차 시장에서 디젤 차량 플랫폼은 뛰어난 연비 성능과 광범위한 서비스 인프라에 힘입어 시장 점유율의 54.60%를 차지하고 있으며, 2031년까지 연평균 성장률(CAGR) 6.02%를 나타낼 것으로 예측됩니다. 비용 격차가 줄어들고 배기가스 규제가 강화되는 도시 지역에서는 가솔린 차량의 보급이 진행되고 있습니다. CNG나 LPG와 같은 대체 연료는 택시와 버스의 연료 전환을 장려하는 나이지리아의 압축 천연가스(CNG) 계획에서 볼 수 있듯이, 틈새 시장인 차량 함대 도입 분야에서 점유율을 확보하고 있습니다. 가나와 케냐에서는 현지 원료를 활용한 바이오연료 사업이 싹트고 있지만, 그 확대는 정책의 일관성과 혼합 시설에 대한 투자에 달려 있습니다.
사하라 이남 아프리카의 디젤 파워트레인 자동차 시장 규모는 건설 및 광업용 차량 수요 증가에 따라 성장하고 있습니다. 그러나 전기차(EV)에 대한 인센티브로 인해 신규 수요가 전동화 플랫폼으로 이동함에 따라 그 점유율은 서서히 감소하고 있습니다. 정부의 연료 가격 규제 완화 방식도 도입 곡선에 영향을 미칩니다. 디젤 보조금을 조기에 폐지하는 국가일수록 가솔린차나 하이브리드차의 도입이 가속화될 가능성이 있습니다.
기타 혜택:
- 엑셀 형식 시장 예측(ME) 시트
- 3개월간의 애널리스트 지원
자주 묻는 질문
목차
제1장 서론
제2장 조사 방법
제3장 주요 요약
제4장 시장 구도
제5장 시장 규모와 성장 예측
제6장 경쟁 구도
제7장 시장 기회와 향후 전망
JHS 26.09.07According to Mordor Intelligence, the Sub-Saharan Africa automotive market size in 2026 is estimated at USD 23.52 billion, growing from the 2025 value of USD 22.45 billion, with projections for 2031 showing USD 29.7 billion, representing a 4.77% CAGR over the 2026-2031 period.
This report is Segmented by Vehicle Type (Passenger Cars, Light Commercial Vehicles, and More), Fuel Type (Gasoline, Diesel, and More), Propulsion Technology (Internal Combustion Engine (ICE), Hybrid Electric Vehicle (HEV), and More), Sales Channel, and Country. The Market Forecasts are Provided in Terms of Value (USD) and Volume (Units).
Sub-Saharan Africa Automotive Market Trends and Insights
Rising Middle-Class Income and Urbanization
An annual 4.1% urban-population uptick shifts purchasing power toward metropolitan nodes where dealer networks, financing options, and aftermarket services coalesce. Middle-income households in Nigeria, Kenya, and Ghana gravitate towards affordable models, intensifying competition between Chinese and Indian OEMs. Compact SUVs and hatchbacks hold favor for maneuverability in congested corridors, whereas peri-urban consumers rely on incoming used stock propelled by rising urban trade-in flows. Lenders follow employment clusters, resulting in cities above 1 million inhabitants offering up to five times more car-loan products than rural districts. Although local-currency depreciation erodes import affordability, wage growth linked to extractive sectors partially offsets price pressure, sustaining demand.
Surge of Ride-Hailing Platforms Accelerating Fleet Renewal
Structured fleet-financing programs from providers such as Moove enable ride-hailing drivers to bypass conventional credit hurdles, lifting multi-year baseline demand for the Sub-Saharan Africa automotive market. Ride-hailing vehicles operate 8-12 hours daily, roughly quadrupling private-use utilization, which shortens replacement cycles to 3-4 years. This predictable cadence enables OEMs to align inventory planning with platform procurement schedules, thereby protecting volumes when consumer sentiment declines. Nigeria, Kenya, and South Africa collectively host over 450,000 active ride-hailing drivers as of 2025, and platform expansion into secondary cities deepens the addressable demand. Government agencies increasingly recognize such fleets as catalysts for formalizing transport services, offering duty rebates on low-emission vehicles deployed for ride-hailing in Ethiopia and Ghana. Resultant fleet growth moderates the risk of limited retail financing reach in many markets.
Dominance of Used-Car Imports
Used vehicles represented 83% of all light-duty vehicle registrations across Sub-Saharan Africa in 2024, according to the African Association of Automotive Manufacturers . South African Revenue Service customs data show that price gaps of 45-60% between used and new models tilt buyer preference. This disparity is magnified whenever local-currency depreciation inflates showroom prices. Projected deregistrations of ICE cars in wealthier economies could add 15 million exportable units annually by 2030, prolonging the region's high-emission fleet unless stricter import-quality rules take hold. UNECE roadworthiness protocols aim to stem sub-standard flows, but uneven enforcement across border posts still dilutes effectiveness.
Other drivers and restraints analyzed in the detailed report include:
- Government CKD/SKD Assembly Incentives
- Infrastructure Upgrades Improving Road Connectivity
- Limited Consumer Credit Access and High Interest Rates
For complete list of drivers and restraints, kindly check the Table Of Contents.
Segment Analysis
Passenger cars preserved a 73.80% share of the Sub-Saharan Africa automotive market volume in 2025 and are forecast to grow at a 5.56% CAGR through 2031, as middle-income cohorts expand. Light commercial vehicles (LCVs) benefit from e-commerce acceleration, especially in Nigeria and Kenya, where last-mile delivery providers lease small vans optimized for dense urban routes. Medium- and heavy-duty trucks trail the overall market growth, tied to commodity-export cycles in South Africa, Zambia, and Angola. Ride-hailing fleets underpin steady passenger-car demand, absorbing sedan and hatchback stock through structured financing programs that lower upfront cost burdens.
Policy-driven electrification in Ethiopia reshapes the passenger-car mix: 60% of newly registered cars must be EVs, catalyzing dedicated assembly ventures and public-sector procurement. Conversely, commercial-vehicle electrification lags due to payload-range constraints, although pilot programs in Johannesburg are testing battery-electric vans under urban logistics duty cycles. Sustained momentum within the passenger-car segment remains contingent on currency stability and progressive credit-access reforms across the Sub-Saharan Africa automotive market.
Diesel platforms held a 54.60% share of the Sub-Saharan Africa automotive market volume in 2025, buoyed by superior fuel economy and extensive service infrastructure, and they are projected to post a 6.02% CAGR through 2031. Gasoline penetration increases in urban centers where cost gaps narrow, and emissions policies become stricter. Alternative fuels, such as CNG and LPG, capture niche fleet deployments, as highlighted by Nigeria's compressed natural gas scheme, which incentivizes taxi and bus conversions. Biofuel initiatives are germinating in Ghana and Kenya, utilizing local feedstocks, but scaling up hinges on policy consistency and investment in blending facilities.
The Sub-Saharan African automotive market size for diesel powertrains expands alongside demand for construction and mining vehicles. Yet, its share gradually erodes as EV incentives redirect incremental demand toward electrified platforms. Government fuel-price deregulation trajectories also influence adoption curves; countries that phase out diesel subsidies sooner may prompt faster adoption of gasoline or hybrids.
Complete Report Scope:
- By Vehicle Type
- Passenger Cars
- Light Commercial Vehicles
- Medium and Heavy Commercial Vehicles
- By Fuel Type
- Gasoline
- Diesel
- Alternative Fuels (CNG, LPG, Bio-fuel)
- By Propulsion Technology
- Internal Combustion Engine (ICE)
- Hybrid Electric Vehicle (HEV)
- Battery Electric Vehicle (BEV)
- Plug-in Hybrid Electric Vehicle (PHEV)
- By Sales Channel
- Original Equipment Manufacturer (OEM)-Authorized Dealer
- Grey Import / Parallel
- By Country
- South Africa
- Nigeria
- Kenya
- Ethiopia
- Ghana
- Tanzania
- Angola
- Zambia
List of Companies Covered in this Report:
- Toyota Motor Corporation
- Volkswagen AG
- Hyundai Motor Company
- Nissan Motor Corporation
- Isuzu Motors Ltd.
- Ford Motor Company
- Groupe Renault
- Honda Motor Corporation
- Suzuki Motor Corporation
- Subaru Corporation
- Stellantis N.V.
- Daimler AG (Mercedes-Benz)
- BYD Co.
- Geely Auto Group
- Changan Auto
- JAC Motors
- BAIC Group
- Tata Motors
- Mahindra & Mahindra
- Innoson Vehicle Manufacturing (Nigeria)
Additional Benefits:
- The market estimate (ME) sheet in Excel format
- 3 months of analyst support
TABLE OF CONTENTS
1 Introduction
- 1.1 Study Assumptions & Market Definition
- 1.2 Scope of the Study
2 Research Methodology
3 Executive Summary
4 Market Landscape
- 4.1 Market Overview
- 4.2 Market Drivers
- 4.2.1 Rising Middle-Class Income and Urbanization
- 4.2.2 Surge of Ride-Hailing Platforms Accelerating Fleet Renewal
- 4.2.3 Government CKD/SKD Assembly Incentives
- 4.2.4 Infrastructure Upgrades Improving Road Connectivity
- 4.2.5 AfCFTA Tariff Reductions Expanding Intra-Regional Trade
- 4.2.6 Growth of Chinese Micro-EV Imports Filling Ultra-Low-Cost Niche
- 4.3 Market Restraints
- 4.3.1 Dominance of Used-Car Imports
- 4.3.2 Limited Consumer Credit Access and High Interest Rates
- 4.3.3 Local-Currency Volatility Inflating Import Costs
- 4.3.4 Fragmented Homologation Standards Across SSA
- 4.4 Value / Supply-Chain Analysis
- 4.5 Regulatory Landscape
- 4.6 Technological Outlook
- 4.7 Porter's Five Forces
- 4.7.1 Threat of New Entrants
- 4.7.2 Bargaining Power of Buyers/Consumers
- 4.7.3 Bargaining Power of Suppliers
- 4.7.4 Threat of Substitute Products
- 4.7.5 Intensity of Competitive Rivalry
5 Market Size & Growth Forecasts (Value (USD) and Volume (Units))
- 5.1 By Vehicle Type
- 5.1.1 Passenger Cars
- 5.1.2 Light Commercial Vehicles
- 5.1.3 Medium and Heavy Commercial Vehicles
- 5.2 By Fuel Type
- 5.2.1 Gasoline
- 5.2.2 Diesel
- 5.2.3 Alternative Fuels (CNG, LPG, Bio-fuel)
- 5.3 By Propulsion Technology
- 5.3.1 Internal Combustion Engine (ICE)
- 5.3.2 Hybrid Electric Vehicle (HEV)
- 5.3.3 Battery Electric Vehicle (BEV)
- 5.3.4 Plug-in Hybrid Electric Vehicle (PHEV)
- 5.4 By Sales Channel
- 5.4.1 Original Equipment Manufacturer (OEM)-Authorized Dealer
- 5.4.2 Grey Import / Parallel
- 5.5 By Country
- 5.5.1 South Africa
- 5.5.2 Nigeria
- 5.5.3 Kenya
- 5.5.4 Ethiopia
- 5.5.5 Ghana
- 5.5.6 Tanzania
- 5.5.7 Angola
- 5.5.8 Zambia
6 Competitive Landscape
- 6.1 Market Concentration
- 6.2 Strategic Moves
- 6.3 Market Share Analysis
- 6.4 Company Profiles (Includes Global Level Overview, Market Level Overview, Core Segments, Financials as Available, Strategic Information, Market Rank/Share for Key Companies, Products and Services, SWOT Analysis, and Recent Developments)
- 6.4.1 Toyota Motor Corporation
- 6.4.2 Volkswagen AG
- 6.4.3 Hyundai Motor Company
- 6.4.4 Nissan Motor Corporation
- 6.4.5 Isuzu Motors Ltd.
- 6.4.6 Ford Motor Company
- 6.4.7 Groupe Renault
- 6.4.8 Honda Motor Corporation
- 6.4.9 Suzuki Motor Corporation
- 6.4.10 Subaru Corporation
- 6.4.11 Stellantis N.V.
- 6.4.12 Daimler AG (Mercedes-Benz)
- 6.4.13 BYD Co.
- 6.4.14 Geely Auto Group
- 6.4.15 Changan Auto
- 6.4.16 JAC Motors
- 6.4.17 BAIC Group
- 6.4.18 Tata Motors
- 6.4.19 Mahindra & Mahindra
- 6.4.20 Innoson Vehicle Manufacturing (Nigeria)
7 Market Opportunities & Future Outlook
- 7.1 White-space & Unmet-need Assessment