

|
시장보고서
상품코드
2123749
전문용 AV 시스템 : 시장 점유율 분석, 업계 동향 및 통계, 성장 예측(2026-2031년)Professional Audio Visual Systems - Market Share Analysis, Industry Trends & Statistics, Growth Forecasts (2026 - 2031) |
||||||
 Mordor Intelligence
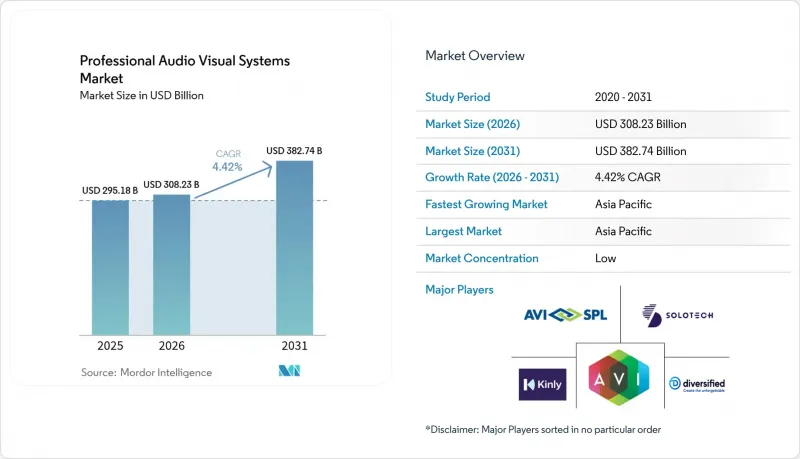
전문용 AV 시스템 시장 규모는 2025년에 2,951억 8,000만 달러로 평가되었습니다. 2026년 3,082억 3,000만 달러에서 2031년까지 3,827억 4,000만 달러에 이를 것으로 예상되며, 예측 기간(2026-2031년) CAGR은 4.42%를 나타낼 전망입니다.
본 보고서는 유형별(촬영·제작 장비, 비디오 프로젝션 등), 구성 요소별(오디오 장비, 디스플레이·프로젝션 시스템, 제어·처리 등), 최종 사용자 산업별(기업, 행사장·이벤트, 소매 등), 지역별(북미, 남미, 유럽,아시아태평양 등)으로 분류되어 있습니다. 시장 예측은 금액(달러) 기준으로 제시되어 있습니다.
세계의 전문용 AV 시스템 시장 동향 및 인사이트
하이브리드 근무 및 하이브리드 학습의 급증
기업의 지출은 개별 회의실 업그레이드에서 온사이트 및 원격 근무 직원 모두에게 공평한 경험을 제공하는 전사적 생태계로 전환되었습니다. 투자 대상은 주요 협업 플랫폼과 통합되는 공간 오디오 어레이, 멀티 카메라 트래킹, 자동 컨텐츠 프레이밍 등으로 확대되고 있습니다. 교육 분야에서도 혼합형 수업을 지원하는 강의 녹화, 캠퍼스 내 스트리밍, 기기 관리와 같은 수요가 유사한 추세를 보이고 있습니다. 기업들은 기존 IT 정책에 통합할 수 있는 인증된 완전 관리형 솔루션을 선호하기 때문에 전문 AV 시스템 시장은 그 혜택을 누리고 있습니다. 직원 경험에 대한 벤치마크가 빠른 업데이트 주기를 촉진하고 있으며, 그 결과 수년에 걸친 조달 로드맵이 수립되고 있습니다. 그 결과, 플랫폼 간 상호 운용성과 클라우드 대시보드가 벤더 간의 중요한 차별화 요인으로 부상하고 있습니다.
체험형 소매 및 공공시설에서의 LED 도입
각 소매 체인 기업들은 매장을 몰입형 미디어 공간으로 탈바꿈시키고 있으며, 파인 피치 LED 디스플레이를 통해 브랜드 스토리 전개, 안내 표시, 실시간 프로모션을 실현하고 있습니다. Scheels사가 실시한 1,100만 달러 규모의 전국적인 사이니지 도입은 그 자본 집약도와 규모를 여실히 보여주고 있습니다. 공공시설이나 교통 허브에서도 승객 흐름 관리 및 안전 정보 전달을 목적으로 유사한 디스플레이가 도입되고 있습니다. 통합된 컨텐츠 관리를 통해 운영자는 지역을 넘나들며 캠페인을 동기화하는 동시에 현지 언어와 제안에 맞추어 맞춤 설정할 수 있습니다. 디스플레이 하드웨어에 소매업체의 CRM 도구에 데이터를 제공하는 분석 기능이 탑재됨에 따라, 전문가용 AV 시스템 시장이 활기를 띠고 있습니다. 매장 방문객 수 증가에 대한 기대감이 높아짐에 따라, 소매 지출이 주기적인 변동을 보이는 상황에서도 LED에 대한 수요는 높은 수준을 유지하고 있습니다.
높은 TCO 및 규정 준수 비용
접근성, 사이버 보안 및 에너지 관련 규제로 인해 조달 비용 산정 방식이 완전히 바뀌었습니다. 2027년 1월에 시행될 FCC 규정에 따르면, 화상 회의 플랫폼에서 자막, 수화 지원 및 접근성이 보장된 사용자 인터페이스가 의무화됩니다. 이와 병행하여 적용되는 에너지 기준에 따라 제조업체는 더 고효율인 부품을 사용하여 본체와 전원 장치를 재설계해야 합니다. 규정 준수를 위해서는 시험, 인증 및 빈번한 소프트웨어 업데이트가 필요하며, 복잡한 도입 프로젝트의 라이프사이클 비용은 두 배로 급증하고 있습니다. 조직들은 지속적인 교육, 모니터링 및 감사 문서 작성의 부담을 과소평가하고 있으며, 그 결과 예산 초과가 발생하여 기업용 AV 시스템 시장의 단기 발주를 억제하는 요인이 되고 있습니다.
부문별 분석
전문용 AV 시스템 시장에서는 2025년에 ‘촬영·제작 장비’가 30.25%라는 최고 점유율을 기록하며, 고품질 소스 컨텐츠가 중시되고 있음이 부각되었습니다. 기업 및 교육 기관의 스튜디오가 방송 워크플로우를 재현함에 따라 카메라 시스템,PTZ 컨트롤러, 제작 스위처는 저가 시장으로 확대되고 있습니다. 하드웨어, 소프트웨어, 원격 지원을 패키지화한 구독 모델 덕분에 벤더의 연간 경상 수익이 증가하고 있습니다. 연평균 성장률(CAGR) 5.33%로 가장 빠르게 성장하고 있는 ‘스트리밍 미디어,저장, 전송’ 분야는 확장 가능한 클라우드 인코더 및 온디맨드 컨텐츠 라이브러리에 대한 수요를 반영하고 있습니다. 엣지 캐싱은 전 세계에 분산된 시청자의 지연 시간을 줄여주며, 미디어 서버를 전문 AV 시스템 시장 규모에 대한 논의에서 전략적 핵심 요소로 만들고 있습니다.
기존의 비디오 프로젝션은 강당이나 예배당에서 여전히 중요성을 유지하고 있지만, 고휘도 환경에서는 직접 뷰형 LED에 시장 점유율을 빼앗기고 있습니다. 설계, 모니터링, 고장 수리 계약 등의 서비스는 고객이 라이프사이클 관리를 외부에 위탁함에 따라 증가하고 있습니다. 홀로그래픽 디스플레이나 공간 컴퓨팅과 같은 신기술은 여전히 틈새 분야에 머물러 있지만, 고급 시설을 위한 혁신 예산을 확보하고 있습니다. 모든 하위 부문에서 가치 창출이 고립된 하드웨어에서 분석 및 컨텐츠 워크플로우를 수익화하는 통합 생태계로 전환되고 있는 것으로 나타났습니다.
지역별 분석
아시아태평양은 교통, 호텔·관광, 스마트 시티 분야의 메가 프로젝트에 힘입어 29.55%라는 최대 점유율과 5.78%라는 업계 최고 수준의 연평균 성장률(CAGR)을 유지하고 있습니다. 각국의 디지털화 정책에 따라 중국, 인도, 인도네시아에서는 캠퍼스 네트워크와 몰입형 교실에 자금이 투입되고 있습니다. 현지 제조 클러스터를 통해 리드타임과 비용 구조가 단축되어 차세대 LED 및 AI 처리 기술의 신속한 도입이 가능해졌습니다. 일본과 한국은 마이크로 LED 패키징 및 음성 AI 분야의 연구개발(R&D) 돌파구를 통해 생산량을 보완하며 수출 경쟁력을 높이고 있습니다. 성숙한 통합 업체들은 지역별 조달 및 언어의 다양성에 대응하기 위해 합작 회사를 설립하고 있으며, 이러한 전략이 전문가용 AV 시스템 시장 점유율 확대로 이어지고 있습니다.
북미에서는 접근성 관련 규제와 하이브리드 근무 방식의 정착을 원동력으로 삼아 꾸준한 업그레이드가 진행되고 있습니다. FCC의 자막 표시 규정에 따라 AI 텍스트 변환 엔진과 적응형 UI 요소에 대한 수요가 급증하고 있습니다. 기업들은 사무실 내와 원격 근무 환경 간의 균형을 유지하기 위해 3-5년 주기의 장비 교체 주기를 재검토하고 있습니다. 캐나다에서는 광활한 영토 전역에 걸친 방송 스튜디오 및 원격 교육 인프라에 대한 투자를 통해 시장의 성장세를 높이고 있습니다. 멕시코의 마키라도라(수출가공구)에서는 국경을 넘는 공급망을 조정하기 위해 AV-over-IP가 채택되고 있으며, 이 지역은 전문용 오디오비주얼 시스템 시장에서 여전히 필수적인 위치를 차지하고 있습니다.
유럽에서는 에너지 소비량 감축 및 순환형 경제 설계를 의무화하는 지속가능성 관련 법규를 배경으로 시장이 확대되고 있습니다. 독일과 프랑스에서는 패시브 냉각 방식의 케이스와 저전력 모드를 예약하는 펌웨어가 우선적으로 채택되고 있습니다. 영국에서는 교통 허브의 승객 밀도 관리를 위해 AI 분석 기술 도입이 가속화되고 있습니다. 동유럽 국가들에서는 재건 자금을 시민 극장이나 지방 대학의 시설 갱신에 투입하고 있습니다. 범유럽 데이터 개인정보 보호법에 따라, 공급업체 간 경쟁 우위 요소로서 안전한 클라우드 관리가 중요시되면서, 전문용 오디오비주얼 시스템 시장 전체의 조달 방침을 형성하고 있습니다.
기타 혜택 :
- 엑셀 형식 시장 예측(ME) 시트
- 3개월간의 애널리스트 지원
자주 묻는 질문
목차
제1장 서론
제2장 조사 방법
제3장 주요 요약
제4장 시장 구도
제5장 시장 규모 및 성장 예측
제6장 경쟁 구도
제7장 시장 기회 및 향후 전망
KTH 26.09.16According to Mordor Intelligence, the professional audio visual system market size was valued at USD 295.18 billion in 2025 and estimated to grow from USD 308.23 billion in 2026 to reach USD 382.74 billion by 2031, at a CAGR of 4.42% during the forecast period (2026-2031).
This report is Segmented by Type (Capture and Production Equipment, Video Projection, and More), Component (Audio Equipment, Display and Projection Systems, Control and Processing, and More), End-User Vertical (Corporate, Venues and Events, Retail, and More), and Geography (North America, South America, Europe, Asia-Pacific, and More). The Market Forecasts are Provided in Terms of Value (USD).
Global Professional Audio Visual Systems Market Trends and Insights
Hybrid Work and Learning Surge
Corporate spending shifted from isolated conference-room upgrades to enterprise-wide ecosystems that deliver equitable experiences for on-site and remote staff. Investments span spatial audio arrays, multi-camera tracking, and automated content framing that integrate with leading collaboration platforms. Education is mirroring this demand with lecture capture, campus streaming, and device management that support blended classrooms. The professional audio visual system market benefits because enterprises prefer certified, fully managed solutions that plug into existing IT policies. Rapid refresh cycles are fueled by employee experience benchmarks, leading to multiyear procurement roadmaps. As a result, platform interoperability and cloud dashboards have emerged as critical vendor differentiators.
Experiential Retail and Public-Venue LED Rollouts
Retail chains are turning stores into immersive media venues where fine-pitch LEDs deliver branded storytelling, wayfinding, and real-time promotions. Scheels' USD 11 million national signage rollout underscores capital intensity and scale. Public buildings and transport hubs are installing similar displays to manage passenger flow and safety messaging. Central content management lets operators synchronize campaigns across regions while tailoring local language and offers. The professional audio visual system market is bolstered because display hardware now ships with embedded analytics that feed retailers' CRM tools. Rising foot-traffic expectations keep LED demand elevated despite cyclical retail spending.
High TCO and Compliance Costs
Accessibility, cybersecurity, and energy mandates have transformed procurement math. The FCC rules, effective January 2027, require captioning, sign-language support, and accessible user interfaces within video-conferencing platforms. Parallel energy standards push manufacturers to redesign enclosures and power supplies with higher-efficiency components. Compliance adds testing, certification, and frequent software updates, doubling lifecycle spending for complex deployments. Organizations underestimate ongoing training, monitoring, and audit documentation, leading to budget overruns that temper near-term orders in the professional audio visual system market.
Other drivers and restraints analyzed in the detailed report include:
- Live and Hybrid Events Rebound Post-Pandemic
- Migration to AV-over-IP Architectures
- Skilled-Labor Shortages and Wage Inflation
For complete list of drivers and restraints, kindly check the Table Of Contents.
Segment Analysis
The professional audio visual system market recorded Capture and Production Equipment at a leading 30.25% share in 2025, underscoring the premium placed on high-quality source content. Camera systems, PTZ controllers, and production switchers move down-market as corporate and educational studios replicate broadcast workflows. Bundled subscription models that wrap hardware, software, and remote support increase annual recurring revenue for vendors. Streaming Media, Storage, and Distribution, the fastest-growing slice at a 5.33% CAGR, reflects demand for scalable cloud encoders and on-demand content libraries. Edge caching reduces latency for globally dispersed viewers, turning media servers into strategic nodes in the professional audio visual system market size discussions.
Traditional Video Projection retains relevance for auditoriums and houses of worship but yields share to direct-view LED in high-brightness settings. Services, including design, monitoring, and break-fix contracts, climb as customers outsource lifecycle management. Emerging types such as holographic displays and spatial computing remain niche yet capture innovation budgets for premium venues. Every sub-segment illustrates a shift where value creation migrates from isolated hardware to integrated ecosystems that monetize analytics and content workflows.
Complete Report Scope:
- By Type
- Capture and Production Equipment
- Video Projection
- Streaming Media, Storage and Distribution
- Services
- Other Types
- By Component
- Audio Equipment (mics, mixers, amps)
- Display and Projection Systems
- Control and Processing
- Storage and Distribution Hardware
- By End-user Vertical
- Corporate
- Venues and Events
- Retail
- Media and Entertainment
- Education
- Government
- Healthcare
- Other End-user Verticals
- By Geography
- North America
- United States
- Canada
- Mexico
- South America
- Brazil
- Argentina
- Rest of South America
- Europe
- Germany
- United Kingdom
- France
- Rest of Europe
- Asia-Pacific
- China
- Japan
- India
- South Korea
- South-East Asia
- Rest of Asia-Pacific
- Middle East and Africa
- Middle East
- Saudi Arabia
- United Arab Emirates
- Rest of Middle East
- Africa
- South Africa
- Egypt
- Rest of Africa
- Middle East
- North America
Geography Analysis
Asia-Pacific holds the largest 29.55% share and a leading 5.78% CAGR, propelled by mega-projects in transportation, hospitality, and smart cities. National digitization policies funnel funds into campus networks and immersive classrooms in China, India, and Indonesia. Local manufacturing clusters compress lead times and cost structures, allowing rapid adoption of next-generation LED and AI processing. Japan and South Korea supplement volume with research and development breakthroughs in micro-LED packaging and voice AI, enhancing export competitiveness. Mature integrators forge joint ventures to navigate regional procurement and language diversity, a tactic that expands the professional audio visual system market footprint.
North America posts steady upgrades anchored by accessibility mandates and hybrid work normalization. The FCC captioning rule multiplies demand for AI transcription engines and adaptive UI elements. Enterprises revisit refresh cycles every three to five years to maintain parity between in-office and remote experiences. Canada boosts market momentum through investments in broadcast studios and distance-learning infrastructure across dispersed territories. Mexico's maquiladora centers adopt AV-over-IP to coordinate cross-border supply chains, keeping the region integral to the professional audio visual system market.
Europe advances on the back of sustainability legislation requiring lower energy consumption and circular-economy design. Germany and France prioritize passive cooling enclosures and firmware that schedules low-power modes. The United Kingdom accelerates the adoption of AI analytics in transport hubs to manage passenger density. Eastern European countries allocate recovery funds to upgrade civic theatres and regional universities. Pan-European data-privacy laws elevate secure cloud control as a competitive edge among vendors, shaping procurement policies across the professional audio visual system market.
- AVI-SPL Inc.
- Diversified
- AVI Systems Inc.
- Ford Audio-Video LLC
- CCS Presentation Systems Inc.
- Solutionz Inc.
- Electrosonic Group
- Solotech Inc.
- Conference Technologies Inc.
- Vistacom Inc.
- Kinly BV
- Vega Global
- IDNS Ltd.
- Ricoh USA Inc.
- Midwich Group plc
- Wesco Anixter Inc.
- Audinate Group Ltd.
- NMK Electronics Enterprises
- Qvest Group
- ACTLD SA
- Almo Professional A/V (Exertis Almo)
- ClearOne Inc.
- Kramer Electronics Ltd.
Additional Benefits:
- The market estimate (ME) sheet in Excel format
- 3 months of analyst support
TABLE OF CONTENTS
1 INTRODUCTION
- 1.1 Study Assumptions and Market Definition
- 1.2 Scope of the Study
2 RESEARCH METHODOLOGY
3 EXECUTIVE SUMMARY
4 MARKET LANDSCAPE
- 4.1 Market Overview
- 4.2 Impact of Macroeconomic Factors
- 4.3 Market Drivers
- 4.3.1 Hybrid work and learning surge
- 4.3.2 Experiential retail and public-venue LED roll-outs
- 4.3.3 Live and hybrid events rebound post-pandemic
- 4.3.4 Migration to AV-over-IP architectures
- 4.3.5 AI-driven real-time accessibility solutions
- 4.3.6 Decarbonization mandates for energy-efficient AV
- 4.4 Market Restraints
- 4.4.1 High TCO and compliance costs
- 4.4.2 Semiconductor and display supply-chain volatility
- 4.4.3 Cyber-insurance premiums on networked AV
- 4.4.4 Skilled-labor shortages and wage inflation
- 4.5 Industry Supply Chain Analysis
- 4.6 Regulatory Landscape
- 4.7 Technological Outlook
- 4.8 Impact of Macroeconomic Factors on the Market
- 4.9 Porter's Five Forces Analysis
- 4.9.1 Bargaining Power of Suppliers
- 4.9.2 Bargaining Power of Consumers
- 4.9.3 Threat of New Entrants
- 4.9.4 Intensity of Competitive Rivalry
- 4.9.5 Threat of Substitute Products
5 MARKET SIZE AND GROWTH FORECASTS (VALUE)
- 5.1 By Type
- 5.1.1 Capture and Production Equipment
- 5.1.2 Video Projection
- 5.1.3 Streaming Media, Storage and Distribution
- 5.1.4 Services
- 5.1.5 Other Types
- 5.2 By Component
- 5.2.1 Audio Equipment (mics, mixers, amps)
- 5.2.2 Display and Projection Systems
- 5.2.3 Control and Processing
- 5.2.4 Storage and Distribution Hardware
- 5.3 By End-user Vertical
- 5.3.1 Corporate
- 5.3.2 Venues and Events
- 5.3.3 Retail
- 5.3.4 Media and Entertainment
- 5.3.5 Education
- 5.3.6 Government
- 5.3.7 Healthcare
- 5.3.8 Other End-user Verticals
- 5.4 By Geography
- 5.4.1 North America
- 5.4.1.1 United States
- 5.4.1.2 Canada
- 5.4.1.3 Mexico
- 5.4.2 South America
- 5.4.2.1 Brazil
- 5.4.2.2 Argentina
- 5.4.2.3 Rest of South America
- 5.4.3 Europe
- 5.4.3.1 Germany
- 5.4.3.2 United Kingdom
- 5.4.3.3 France
- 5.4.3.4 Rest of Europe
- 5.4.4 Asia-Pacific
- 5.4.4.1 China
- 5.4.4.2 Japan
- 5.4.4.3 India
- 5.4.4.4 South Korea
- 5.4.4.5 South-East Asia
- 5.4.4.6 Rest of Asia-Pacific
- 5.4.5 Middle East and Africa
- 5.4.5.1 Middle East
- 5.4.5.1.1 Saudi Arabia
- 5.4.5.1.2 United Arab Emirates
- 5.4.5.1.3 Rest of Middle East
- 5.4.5.2 Africa
- 5.4.5.2.1 South Africa
- 5.4.5.2.2 Egypt
- 5.4.5.2.3 Rest of Africa
- 5.4.5.1 Middle East
- 5.4.1 North America
6 COMPETITIVE LANDSCAPE
- 6.1 Market Concentration
- 6.2 Strategic Moves
- 6.3 Market Share Analysis
- 6.4 Company Profiles (includes Global level Overview, Market level overview, Core Segments, Financials as available, Strategic Information, Market Rank/Share for key companies, Products and Services, and Recent Developments)
- 6.4.1 AVI-SPL Inc.
- 6.4.2 Diversified
- 6.4.3 AVI Systems Inc.
- 6.4.4 Ford Audio-Video LLC
- 6.4.5 CCS Presentation Systems Inc.
- 6.4.6 Solutionz Inc.
- 6.4.7 Electrosonic Group
- 6.4.8 Solotech Inc.
- 6.4.9 Conference Technologies Inc.
- 6.4.10 Vistacom Inc.
- 6.4.11 Kinly BV
- 6.4.12 Vega Global
- 6.4.13 IDNS Ltd.
- 6.4.14 Ricoh USA Inc.
- 6.4.15 Midwich Group plc
- 6.4.16 Wesco Anixter Inc.
- 6.4.17 Audinate Group Ltd.
- 6.4.18 NMK Electronics Enterprises
- 6.4.19 Qvest Group
- 6.4.20 ACTLD SA
- 6.4.21 Almo Professional A/V (Exertis Almo)
- 6.4.22 ClearOne Inc.
- 6.4.23 Kramer Electronics Ltd.
7 MARKET OPPORTUNITIES AND FUTURE OUTLOOK
- 7.1 White-space and Unmet-Need Assessment


