|
시장보고서
상품코드
2124126
실리카 시장 : 점유율 분석, 업계 동향과 통계, 성장 예측(2026-2031년)Silica - Market Share Analysis, Industry Trends & Statistics, Growth Forecasts (2026 - 2031) |
||||||
 Mordor Intelligence
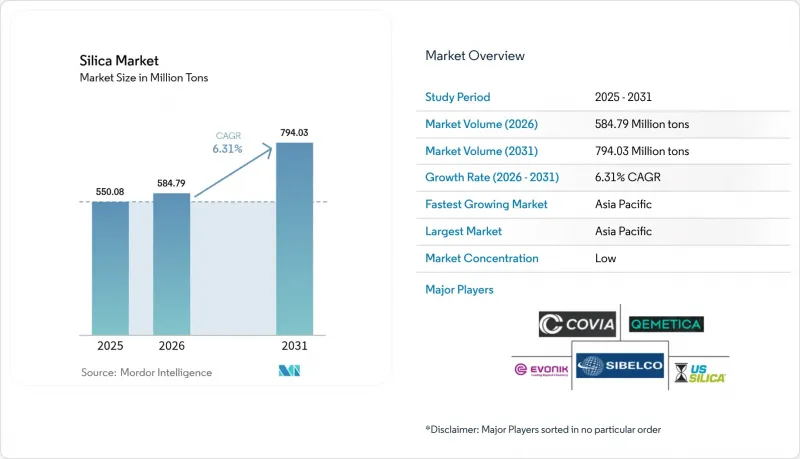
Mordor Intelligence에 의하면, 실리카 시장 규모는 2025년 5억 5,008만 톤에서 2026년에는 5억 8,479만 톤으로 확대되어 2026년부터 2031년까지 CAGR 6.31%로 성장을 지속하여, 2031년에는 7억 9,403만 톤에 이를 것으로 예측됩니다.
본 보고서는 유형별(비정질(흄드/파이로제닉 및 수화물), 결정질(석영, 트라이다마이트 및 크리스토발라이트)), 최종 사용자 산업별(건축 및 건설, 셰일 오일·가스, 유리 제조, 수처리, 기타),지역별(아시아태평양, 북미, 유럽, 남미, 중동 및 아프리카)로 분류되어 있습니다. 시장 예측은 수량(톤) 기준으로 제시되어 있습니다.
세계 실리카 시장 동향 및 인사이트
에너지 절약형 친환경 타이어에서 침전 실리카에 대한 견조한 수요
저회전저항 타이어는 연비를 3-7% 향상시키며, 타이어 효율 표시를 의무화하는 유럽의 규제로 인해 트레드 컴파운드에 함유되는 실리카 양 증가가 촉진되고 있습니다. 현재 프리미엄 승용차용 타이어에는 최대 90 phr의 침전 실리카가 배합되어 있으며, 이는 2020년 일반 수준의 2배에 해당합니다. 상용차 차량군도 디젤 연료비를 절감하기 위해 유사한 배합을 채택하고 있는 반면, 전기차 제조업체들은 주행 거리를 연장하기 위해 이러한 추세를 더욱 강화하고 있습니다.
태양광 발전용 유리 생산 능력의 지속적인 확충
태양광 발전 설비 1기가와트당 철분 함량이 120 ppm 미만인 초투명 실리카계 유리가 15,000-2만 톤 필요합니다. 중국은 전 세계 태양광 발전용 유리 생산 능력의 85% 이상을 차지하고 있으며, 원료의 품질을 보장하기 위해 새로운 플로트 유리 생산 라인과 자사 소유의 실리카 선광 공장을 결합하고 있습니다. 더 얇은 양면 수광형 패널용 유리의 경우 순도 규격이 더욱 엄격해지기 때문에 첨단 선광 기술에 대한 투자가 진행되고 있습니다.
알루미노규산염 및 칼슘규산염 충전재에 의한 경쟁적 위협
소성 점토 및 메타카올린 제품은 콘크리트나 폴리머 복합재료에서 실리카와 동등한 보강 효과를 발휘하면서도, 범용 등급 실리카보다 최대 25% 저렴합니다. 각 공급업체들은 기존에 존재하던 성능 격차를 줄이기 위한 입자 표면 처리 기술에 투자하고 있으며, 비용 효율을 중시하는 건설용 혼합물 시장에서 미세 분말 알루미노실리케이트의 점유율이 확대되고 있습니다.
부문 분석
2025년에는 결정성 등급이 실리카 시장의 99.15%를 차지하며, 2031년까지 연평균 성장률(CAGR) 6.22%로 성장할 전망입니다. 석영은 열적 안정성과 확립된 공급망 덕분에 콘크리트, 유리,주조용 주형 분야에서 여전히 필수적인 존재입니다. 트리디마이트 및 크리스토발라이트는 소규모 고온 세라믹 분야의 틈새 시장을 차지하고 있으나, 복잡한 상전이 처리 공정이 규모 확대를 저해하고 있습니다. 비결정질 등급은 취급량 측면에서는 소수이지만, 그린 타이어 컴파운드, 고고형분 배터리 슬러리, 반도체 CMP 슬러리 분야에서 고가대로 거래되고 있습니다. 전문 공급업체들은 친수성 및 소수성 표면 처리 기술을 활용하여 단순한 취급량을 넘어선 부가가치를 창출하고 있습니다.
환경 규제가 강화됨에 따라, 광산에서 채굴된 결정질 원료에서 흡입성 분진 위험이 낮은 인공 비정질 형태로의 전환이 진행되고 있습니다. 바이오의 벼 껍질 유래 실리카는 이러한 요건을 충족할 뿐만 아니라, 수명 주기 전반에 걸친 탄소 배출량 감축 및 아시아 타이어 제조 거점과의 지리적 근접성이라는 이점도 제공합니다. 진공 플래시 반응 장치 및 저알칼리 정제 라인에 대한 투자는 범용 제품의 대량 생산을 추구하기보다는 소규모이지만 수익성이 높은 분야를 목표로 하는 전략을 뒷받침하고 있습니다. 그 결과, 실리카 시장은 고순도·용도 특화 등급과 건설용 벌크 모래로 양극화가 진행되고 있으며, 2030년까지 가격 격차가 더욱 확대될 것으로 예측됩니다.
지역별 분석
아시아태평양은 2025년에 41.00%의 점유율을 차지하고, 2031년까지 연평균 성장률(CAGR)이 8.10%에 달하며 실리카 시장을 주도하고 있습니다. 중국에서는 전략적 비축과 통합된 선광 허브에 힘입어 건설, 태양광 발전용 유리, 화학 유도체 등의 분야에서 연간 2억 톤 이상이 소비되고 있습니다. 인도에서는 고속도로 확장 및 스마트 시티 계획이 국내 수요를 끌어올리고 있는 한편, 정부의 보조금에 힘입어 벼 껍질 유래 실리카 사업이 가속화되어 현지 타이어 공장과 수출 시장 모두에 공급되고 있습니다.
북미는 셰일가스용 프로판트 공급에서 매우 중요한 위치를 차지하고 있으며, 위스콘신주, 텍사스주, 앨버타주의 광상은 엄격한 파쇄 강도 규격을 충족하고 있습니다. 이 지역의 가공 공장은 멕시코만 연안의 유리 용광로로 가는 공급망을 단축하고 있으며, 캐나다 생산자들은 LNG 건설 및 그린 수소 인프라로부터 수요를 확보하고 있습니다. 규제적 요인, 특히 OSHA(미국 산업안전보건청)의 흡입성 실리카 허용 농도 기준에 따라 광산 운영업체들은 습식 처리 및 밀폐형 취급 시스템으로의 전환을 강요받고 있으며, 이로 인해 설비 투자는 증가하지만 보험상 책임은 경감됩니다.
유럽에서는 독일, 프랑스, 영국을 중심으로 안정적이고 부가가치가 높은 수요가 나타나고 있습니다. 자동차 및 화학 업계의 사용자들은 고순도 등급을 지정하고 있으며, EU의 순환 경제 지침은 재활용 원료 및 바이오 원료의 사용을 촉진하고 있습니다. Qemetica사의 폴란드 거점 확장을 필두로 한 동유럽 공급업체들은 서유럽의 OEM 제조업체와 급성장하는 튀르키예 및 북아프리카 건설 시장 모두와 지리적으로 가까운 이점을 누리고 있습니다. 에너지 효율이 높은 소성로 기술 및 부지 내 태양광 발전 설비에 대한 투자는 EU의 탈탄소화 규정에 부합하며, 이 지역의 장기적인 경쟁력을 공고히 하고 있습니다.
기타 혜택:
- 엑셀 형식 시장 예측(ME) 시트
- 3개월간의 애널리스트 지원
자주 묻는 질문
목차
제1장 서론
제2장 조사 방법
제3장 주요 요약
제4장 시장 구도
제5장 시장 규모와 성장 예측
제6장 경쟁 구도
제7장 시장 기회와 향후 전망
JHS 26.09.11According to Mordor Intelligence, the silica market size is expected to grow from 550.08 Million tons in 2025 to 584.79 Million tons in 2026 and is forecast to reach 794.03 Million tons by 2031 at 6.31% CAGR over 2026-2031.
This report is Segmented by Type (Amorphous (Fumed/Pyrogenic, and Hydrated), Crystalline (Quartz, Tridymite, and Cristobalite)), End-User Industry (Building and Construction, Shale Oil and Gas, Glass Manufacturing, Water Treatment, and Others), and Geography (Asia-Pacific, North America, Europe, South America, and Middle-East and Africa). The Market Forecasts are Provided in Terms of Volume (Tons).
Global Silica Market Trends and Insights
Robust Demand for Precipitated Silica in Energy-Efficient Green Tires
Low-rolling-resistance tires improve fuel economy by 3-7%, and European regulations that mandate tire-efficiency labeling spur higher silica loadings in tread compounds. Premium passenger-car tires now contain up to 90 phr of precipitated silica, double typical 2020 levels. Commercial fleets adopt similar formulations to lower diesel costs, while electric-vehicle makers intensify the trend to extend driving range.
Ongoing Build-Out of Photovoltaic Glass Manufacturing Capacity
Each gigawatt of solar deployment requires 15,000-20,000 tons of ultra-clear silica-based glass with iron content below 120 ppm. China commands over 85% of global PV-glass capacity and is pairing new float-glass lines with captive silica-beneficiation plants to guarantee feedstock quality. Thinner bifacial-panel glass further tightens purity specifications, driving investment in advanced beneficiation.
Competitive Threat from Aluminosilicate and Calcium-Silicate Fillers
Calcined-clay and metakaolin products undercut commodity-grade silica by up to 25% while offering comparable reinforcement in concrete and polymer composites. Suppliers invest in particle-surface treatments that narrow historical performance gaps, with micronized aluminosilicates gaining share in cost-sensitive construction mixes.
Other drivers and restraints analyzed in the detailed report include:
- Rising Adoption of High-Purity Silica in Advanced Semiconductor Nodes
- Shift Toward Bio-Based Rice-Husk Silica in Asia to Cut Carbon Footprint
- Volatility in Freight Cost for Bulk Silica Sand
For complete list of drivers and restraints, kindly check the Table Of Contents.
Segment Analysis
Crystalline grades account for 99.15% of the silica market in 2025 and are expanding at a 6.22% CAGR through 2031. Quartz remains indispensable in concrete, glass, and foundry molds thanks to thermal stability and a well-established supply chain. Tridymite and cristobalite fill smaller high-temperature ceramics niches, but their complex phase-conversion processing limits scale. Amorphous grades, while minor by tonnage, command premium pricing in green-tire compounds, high-solids battery slurries, and semiconductor CMP slurries. Specialty suppliers leverage hydrophilic and hydrophobic surface treatments that capture value beyond bulk tonnage.
Elevated environmental scrutiny encourages migration from mined crystalline inputs toward engineered amorphous forms with lower respirable-dust risk. Bio-based rice-husk silica meets this requirement while offering life-cycle carbon savings and proximity to Asian tire-manufacturing centers. Investment in vacuum flash reactors and low-alkali purification lines underscores the strategy of targeting smaller, higher-margin parcels rather than chasing commodity volume. As a result, the silica market continues bifurcating into high-purity, application-specific grades and bulk construction sand, with pricing divergence expected to widen through 2030.
Complete Report Scope:
- By Type
- Amorphous
- Fumed/Pyrogenic
- Hydrated
- Crystalline
- Quartz
- Tridymite
- Cristobalite
- Amorphous
- By End-user Industry
- Building and Construction
- Shale Oil and Gas
- Glass Manufacturing
- Water Treatment
- Others
- By Geography
- Asia-Pacific
- China
- India
- Japan
- South Korea
- Malaysia
- Thailand
- Indonesia
- Vietnam
- Rest of Asia-Pacific
- North America
- United States
- Canada
- Mexico
- Europe
- Germany
- United Kingdom
- France
- Italy
- Spain
- Russia
- Nordic Countries
- Turkey
- Rest of Europe
- South America
- Brazil
- Argentina
- Colombia
- Rest of South America
- Middle-East and Africa
- Saudi Arabia
- South Africa
- Nigeria
- Qatar
- United Arab Emirates
- Egypt
- Rest of Middle-East and Africa
- Asia-Pacific
Geography Analysis
Asia-Pacific dominates the silica market with 41.00% share in 2025 and an 8.10% CAGR to 2031. China consumes over 200 million tons annually across construction, photovoltaic glass, and chemical derivatives, underpinned by strategic reserves and integrated beneficiation hubs. India's highway expansion and smart-city programs lift domestic demand, while government subsidies accelerate rice-husk silica ventures that feed both local tire plants and export outlets.
North America holds a pivotal position in shale proppant supply, with Wisconsin, Texas, and Alberta deposits meeting stringent crush-strength specifications. Regional processing plants shorten supply chains for Gulf Coast glass furnaces, while Canadian producers capture demand from LNG construction and green-hydrogen infrastructure. Regulatory drivers, notably OSHA respirable-silica limits, push miners toward wet-processing and enclosed-handling systems that boost capex but lower insurance liabilities.
Europe presents stable, value-added demand centered on Germany, France, and the United Kingdom. Automotive and chemical users specify high-purity grades, and EU circular-economy directives promote recycled and bio-based inputs. Eastern European suppliers, led by Qemetica's expanded Polish site, benefit from proximity to both Western OEMs and growing Turkish and North African construction markets. Investments in energy-efficient kiln technology and on-site solar arrays align with EU decarbonization rules, anchoring long-term regional competitiveness.
- AGSCO Corp
- AMS Applied Material Solutions
- Cabot Corporation
- China-Henan Huamei Chemical Co. Ltd
- Covia Holdings LLC
- Denka Company Limited
- Evonik Industries AG
- Heraeus Holding
- Kemitura Group
- Madhu Silica Pvt. Ltd
- Merck KGaA
- Mitsubishi Chemical Group Corporation
- Nouryon
- OCI Company Ltd
- QEMETICA
- Sibelco
- Tokuyama Corporation
- U.S. Silica (Apollo Funds)
- W.R. Grace and Co.
- Wacker Chemie AG
Additional Benefits:
- The market estimate (ME) sheet in Excel format
- 3 months of analyst support
TABLE OF CONTENTS
1 Introduction
- 1.1 Study Assumptions
- 1.2 Scope of the Study
2 Research Methodology
3 Executive Summary
4 Market Landscape
- 4.1 Market Overview
- 4.2 Market Drivers
- 4.2.1 Robust demand for precipitated silica in energy-efficient "green" tires
- 4.2.2 Ongoing build-out of photovoltaic glass manufacturing capacity
- 4.2.3 Rising adoption of high-purity silica in advanced semiconductor nodes
- 4.2.4 Shift toward bio-based rice-husk silica in Asia to cut carbon footprint
- 4.2.5 Rapid uptake of fumed silica in high-solids battery slurries
- 4.3 Market Restraints
- 4.3.1 Competitive threat from aluminosilicate and calcium-silicate fillers
- 4.3.2 Volatility in freight cost for bulk silica sand
- 4.3.3 Tightening respirable-crystalline-silica exposure limits (OSHA, EU)
- 4.4 Value Chain Analysis
- 4.5 Porter's Five Forces
- 4.5.1 Bargaining Power of Suppliers
- 4.5.2 Bargaining Power of Buyers
- 4.5.3 Threat of New Entrants
- 4.5.4 Threat of Substitutes
- 4.5.5 Degree of Competition
5 Market Size and Growth Forecasts (Value and Volume)
- 5.1 By Type
- 5.1.1 Amorphous
- 5.1.1.1 Fumed/Pyrogenic
- 5.1.1.2 Hydrated
- 5.1.2 Crystalline
- 5.1.2.1 Quartz
- 5.1.2.2 Tridymite
- 5.1.2.3 Cristobalite
- 5.1.1 Amorphous
- 5.2 By End-user Industry
- 5.2.1 Building and Construction
- 5.2.2 Shale Oil and Gas
- 5.2.3 Glass Manufacturing
- 5.2.4 Water Treatment
- 5.2.5 Others
- 5.3 By Geography
- 5.3.1 Asia-Pacific
- 5.3.1.1 China
- 5.3.1.2 India
- 5.3.1.3 Japan
- 5.3.1.4 South Korea
- 5.3.1.5 Malaysia
- 5.3.1.6 Thailand
- 5.3.1.7 Indonesia
- 5.3.1.8 Vietnam
- 5.3.1.9 Rest of Asia-Pacific
- 5.3.2 North America
- 5.3.2.1 United States
- 5.3.2.2 Canada
- 5.3.2.3 Mexico
- 5.3.3 Europe
- 5.3.3.1 Germany
- 5.3.3.2 United Kingdom
- 5.3.3.3 France
- 5.3.3.4 Italy
- 5.3.3.5 Spain
- 5.3.3.6 Russia
- 5.3.3.7 Nordic Countries
- 5.3.3.8 Turkey
- 5.3.3.9 Rest of Europe
- 5.3.4 South America
- 5.3.4.1 Brazil
- 5.3.4.2 Argentina
- 5.3.4.3 Colombia
- 5.3.4.4 Rest of South America
- 5.3.5 Middle-East and Africa
- 5.3.5.1 Saudi Arabia
- 5.3.5.2 South Africa
- 5.3.5.3 Nigeria
- 5.3.5.4 Qatar
- 5.3.5.5 United Arab Emirates
- 5.3.5.6 Egypt
- 5.3.5.7 Rest of Middle-East and Africa
- 5.3.1 Asia-Pacific
6 Competitive Landscape
- 6.1 Market Concentration
- 6.2 Strategic Moves
- 6.3 Market Share (%)/Ranking Analysis
- 6.4 Company Profiles (includes Global-level Overview, Market-level Overview, Core Segments, Financials, Strategic Information, Market Rank/Share, Products and Services, Recent Developments)
- 6.4.1 AGSCO Corp
- 6.4.2 AMS Applied Material Solutions
- 6.4.3 Cabot Corporation
- 6.4.4 China-Henan Huamei Chemical Co. Ltd
- 6.4.5 Covia Holdings LLC
- 6.4.6 Denka Company Limited
- 6.4.7 Evonik Industries AG
- 6.4.8 Heraeus Holding
- 6.4.9 Kemitura Group
- 6.4.10 Madhu Silica Pvt. Ltd
- 6.4.11 Merck KGaA
- 6.4.12 Mitsubishi Chemical Group Corporation
- 6.4.13 Nouryon
- 6.4.14 OCI Company Ltd
- 6.4.15 QEMETICA
- 6.4.16 Sibelco
- 6.4.17 Tokuyama Corporation
- 6.4.18 U.S. Silica (Apollo Funds)
- 6.4.19 W.R. Grace and Co.
- 6.4.20 Wacker Chemie AG
7 Market Opportunities and Future Outlook
- 7.1 White-space and Unmet-Need Assessment