|
시장보고서
상품코드
2124128
북미의 풍력발전 시장 : 시장 점유율 분석, 업계 동향 및 통계, 성장 예측(2026-2031년)North America Wind Power - Market Share Analysis, Industry Trends & Statistics, Growth Forecasts (2026 - 2031) |
||||||
 Mordor Intelligence
Mordor Intelligence에 의하면, 북미의 풍력발전 시장 규모는 2025년 188.75기가와트로 평가되었고, 2026년에는 198.17기가와트로 추정되고, 2026-2031년 CAGR 4.99%로 성장을 지속할 전망이며, 2031년에는 252.83기가와트에 이를 것으로 예측됩니다.
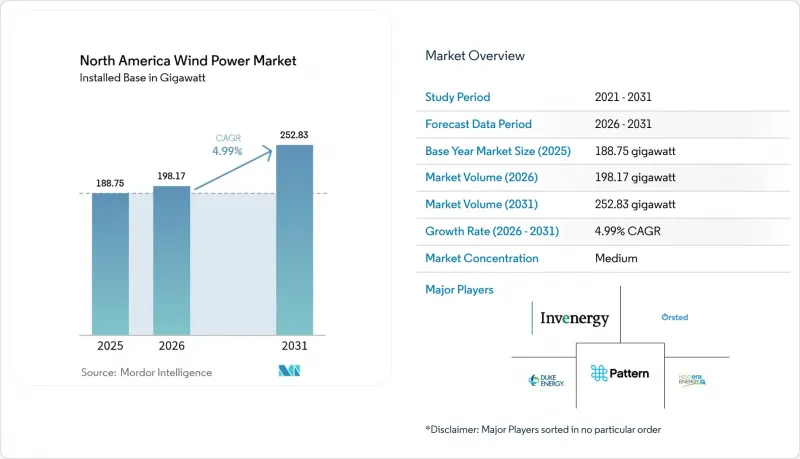
본 보고서는 설치 장소별(육상 및 해상), 터빈 출력별(3MW 이하, 3-6MW, 6MW 초과), 용도별(유틸리티 규모, 상업 및 산업용, 커뮤니티 프로젝트), 지역별(미국, 캐나다, 멕시코)로 분류되어 있습니다. 시장 규모 및 전망은 설치 용량(GW) 단위로 표시되어 있습니다.
북미의 풍력발전 시장 동향 및 인사이트
IRA(인플레이션 억제법)의 국내 조달 보너스 및 제조 거점 확충
하이퍼스케일 클라우드 제공업체들은 현재 연중무휴 24시간 탄소 제로 에너지 공급이라는 공약을 이행하기 위해 기가와트 규모의 재생에너지를 조달하고 있습니다. 마이크로소프트와 브룩필드 리뉴어블이 체결한 10.5GW 규모의 세계 프레임워크는 개발업체에 수익 전망을 보장하는 가상 PPA(전력 구매 계약)의 청사진이 되고 있습니다. 텍사스주, 버지니아주, 퀘벡주의 데이터센터 클러스터에서는 에너지 저장 설비와 결합하여 풍력발전 출력을 안정적인 부하 프로파일에 맞추고, 북미 풍력발전 시장에서 프로젝트의 자금 조달 가능성을 높이고 있습니다. 15-20년 계약 체결에 대한 의지가 투자 적격 등급의 자금 조달을 뒷받침하고 있으며, 이러한 추세는 반도체 팹 및 청정 수소 생산 업체로도 확산되고 있습니다.
AI·데이터센터의 전력 수요 급증, 장기 PPA 견인
하이퍼스케일 클라우드 제공업체들은 현재 24시간 365일 탄소 제로 에너지 공급이라는 공약을 이행하기 위해 기가와트 규모의 재생에너지를 조달하고 있습니다. 마이크로소프트가 브룩필드 리뉴어블과 체결한 10.5GW 규모의 세계 프레임워크는 개발업체들에게 수익 전망이 보장되는 가상 PPA의 청사진이 되고 있습니다. 텍사스주, 버지니아주, 퀘벡주의 데이터센터 클러스터에서는 에너지 저장 설비와 결합하여 풍력발전 출력을 안정적인 부하 프로파일에 맞추고, 북미 풍력발전 시장에서 프로젝트의 자금 조달 가능성을 높이고 있습니다. 15년에서 20년에 걸친 계약을 체결하려는 의지가 투자 적격 등급의 자금 조달을 뒷받침하고 있으며, 이러한 추세는 반도체 제조 공장 및 청정 수소 생산 사업자로도 확대되고 있습니다.
송전망 대기열로 인한 병목 현상과 출력 억제 위험
2,000 GW가 넘는 재생에너지가 송전망 조사를 대기 중이며, MISO 및 SPP에서는 2024년에 6%를 초과하는 출력 억제율이 예상됩니다. FERC 명령 제1920호는 20년의 계획 기간을 의무화하고 있지만, 개혁을 통해 용량 병목 현상이 해소되는 것은 2020년대 후반이 될 전망입니다. 개발 사업자는 심사 과정의 초기 단계에서 더 많은 보증금을 납부해야 하므로 소규모 사업자에게는 부담이 되겠지만, 투기적인 신청은 감소할 전망입니다. 클러스터 심사를 통해 승인 절차가 신속해질 가능성은 있지만, 북미 풍력발전 시장에서는 여전히 혼잡 위험이 남아 있습니다.
부문 분석
2025년에는 육상 프로젝트가 설치 용량의 99.88%를 차지했습니다. 이는 그레이트 플레인스와 텍사스주 전역에서 수십 년에 걸쳐 허가 절차가 간소화되고, 비용이 최적화된 공급망이 구축되어 온 것을 반영합니다. 이러한 압도적인 우위에도 불구하고, 해상 풍력발전 용량은 급속히 확대되고 있으며, 대서양의 고정식 해상 풍력발전소가 상업 운전을 시작함에 따라 2031년까지 연평균 성장률(CAGR) 47.69%를 달성할 전망입니다. Vineyard Wind사와 South Fork Wind사는 40% 이상의 높은 설비 가동률을 보이며, 육상 발전 자산과의 비용 격차를 좁히고 있습니다. 뉴욕주와 뉴저지주의 주 차원의 조달 의무는 30GW 규모의 파이프라인을 뒷받침하며, 선박 소유주와 부품 공급업체에 확실한 전망을 제공합니다. 캘리포니아주와 노바스코샤주에서 진행 중인 부유식 풍력발전 시범 사업은 수심이 더 깊은 해역을 대상으로 하고 있으며, 2030년 이후에도 북미 풍력발전 시장이 추가적인 성장 단계를 맞이할 수 있는 기반을 마련하고 있습니다.
기타 혜택 :
- 엑셀 형식 시장 예측(ME) 시트
- 3개월간의 애널리스트 지원
자주 묻는 질문
목차
제1장 서론
제2장 조사 방법
제3장 주요 요약
제4장 시장 구도
제5장 시장 규모 및 성장 예측
제6장 경쟁 구도
제7장 시장 기회 및 향후 전망
AJY 26.09.09According to Mordor Intelligence, the North America wind power market size is expected to grow from 188.75 gigawatt in 2025 to 198.17 gigawatt in 2026 and is forecast to reach 252.83 gigawatt by 2031 at 4.99% CAGR over 2026-2031.
This report is Segmented by Location (Onshore and Offshore), Turbine Capacity (Up To 3 MW, 3 To 6 MW, and Above 6 MW), Application (Utility-Scale, Commercial and Industrial, and Community Projects), and Geography (United States, Canada, and Mexico). The Market Size and Forecasts are Provided in Terms of Installed Capacity (GW).
North America Wind Power Market Trends and Insights
IRA Domestic-Content Bonus & Manufacturing Build-Out
Hyperscale cloud providers now procure gigawatt-scale renewables to satisfy 24/7 carbon-free energy commitments. Microsoft's 10.5 GW global framework with Brookfield Renewable sets a blueprint for virtual PPAs that guarantee revenue visibility for developers. Data-center clusters in Texas, Virginia, and Quebec align wind output with consistent load profiles when paired with storage, improving project bankability within the North America wind power market. Willingness to sign 15- to 20-year contracts supports investment-grade financing, and the trend is spreading to semiconductor fabs and green-hydrogen producers.
Surging AI/Data-Center Power Demand Driving Long-Term PPAs
Hyperscale cloud providers now procure gigawatt-scale renewables to satisfy 24/7 carbon-free energy commitments. Microsoft's 10.5 GW global framework with Brookfield Renewable sets a blueprint for virtual PPAs that guarantee revenue visibility for developers. Data-center clusters in Texas, Virginia, and Quebec align wind output with consistent load profiles when paired with storage, improving project bankability within the North America wind power market. Willingness to sign 15- to 20-year contracts supports investment-grade financing, and the trend is spreading to semiconductor fabs and green-hydrogen producers.
Transmission Queue Bottlenecks & Curtailment Risk
More than 2,000 GW of renewables await grid studies, with MISO and SPP experiencing curtailment rates above 6% in 2024. FERC Order 1920 mandates 20-year planning horizons, yet reforms will not unblock capacity until the late 2020s. Developers must commit higher deposits earlier in the study process, straining small operators but reducing speculative filings. Cluster studies may expedite approvals, though congestion risks persist for the North America wind power market.
Other drivers and restraints analyzed in the detailed report include:
- Corporate Renewable-Energy Procurement Mandates
- Declining Levelized Cost of Electricity (LCOE)
- DoD Radar & Whale-Migration Litigation Delaying Projects
For complete list of drivers and restraints, kindly check the Table Of Contents.
Segment Analysis
Onshore projects controlled 99.88% of installations in 2025, reflecting decades of streamlined permitting and cost-optimized supply chains across the Great Plains and Texas. Despite this dominance, offshore capacity is scaling rapidly, delivering a 47.69% CAGR to 2031 as Atlantic fixed-bottom farms reach commercial operations. Vineyard Wind and South Fork Wind showcased reliable 40%-plus capacity factors, narrowing cost gaps with onshore assets. State procurement mandates in New York and New Jersey support a 30 GW pipeline, providing visibility for vessel owners and component suppliers. Floating wind pilots in California and Nova Scotia target deeper-water zones, positioning the North America wind power market for another phase of growth beyond 2030.
Complete Report Scope:
- By Location
- Onshore
- Offshore
- By Turbine Capacity
- Up to 3 MW
- 3 to 6 MW
- Above 6 MW
- By Application
- Utility-scale
- Commercial and Industrial
- Community Projects
- By Geography
- United States
- Canada
- Mexico
- By Component (Qualitative Analysis)
- Nacelle/Turbine
- Blade
- Tower
- Generator and Gearbox
- Balance-of-System
List of Companies Covered in this Report:
- NextEra Energy Inc.
- Orsted A/S
- Invenergy LLC
- Pattern Energy Group LP
- Duke Energy Corp.
- Acciona Energia, S.A.
- Avangrid Inc. (Iberdrola)
- EDF Renewables North America
- EnBW Energie Baden-Wurttemberg AG
- E.ON SE
- BP plc (bp Wind Energy)
- Shell New Energies
- Brookfield Renewable Partners
- Algonquin Power & Utilities
- TransAlta Renewables
- Trident Winds Inc.
- Copenhagen Infrastructure Partners (CIP)
- Siemens Gamesa Renewable Energy
- General Electric Co.
- Vestas Wind Systems A/S
- Nordex SE
- Envision Energy
- Goldwind Americas
Additional Benefits:
- The market estimate (ME) sheet in Excel format
- 3 months of analyst support
TABLE OF CONTENTS
1 Introduction
- 1.1 Study Assumptions & Market Definition
- 1.2 Scope of Study
2 Research Methodology
3 Executive Summary
4 Market Landscape
- 4.1 Market Overview
- 4.2 Market Drivers
- 4.2.1 Supportive government incentives & tax credits
- 4.2.2 Declining levelised cost of electricity (LCOE)
- 4.2.3 Corporate renewable-energy procurement mandates
- 4.2.4 IRA domestic-content bonus & manufacturing build-out
- 4.2.5 Surging AI/data-centre power demand driving long-term PPAs
- 4.3 Market Restraints
- 4.3.1 Transmission queue bottlenecks & curtailment risk
- 4.3.2 Commodity & rare-earth supply-chain constraints
- 4.3.3 DoD radar & whale-migration litigation delaying projects
- 4.4 Supply-Chain Analysis
- 4.5 Regulatory Landscape
- 4.6 Technological Outlook
- 4.7 Porter's Five Forces
- 4.7.1 Bargaining Power of Suppliers
- 4.7.2 Bargaining Power of Buyers
- 4.7.3 Threat of New Entrants
- 4.7.4 Threat of Substitutes
- 4.7.5 Competitive Rivalry
- 4.8 Investment Analysis
5 Market Size & Growth Forecasts
- 5.1 By Location
- 5.1.1 Onshore
- 5.1.2 Offshore
- 5.2 By Turbine Capacity
- 5.2.1 Up to 3 MW
- 5.2.2 3 to 6 MW
- 5.2.3 Above 6 MW
- 5.3 By Application
- 5.3.1 Utility-scale
- 5.3.2 Commercial and Industrial
- 5.3.3 Community Projects
- 5.4 By Geography
- 5.4.1 United States
- 5.4.2 Canada
- 5.4.3 Mexico
- 5.5 By Component (Qualitative Analysis)
- 5.5.1 Nacelle/Turbine
- 5.5.2 Blade
- 5.5.3 Tower
- 5.5.4 Generator and Gearbox
- 5.5.5 Balance-of-System
6 Competitive Landscape
- 6.1 Market Concentration
- 6.2 Strategic Moves (M&A, Partnerships, PPAs)
- 6.3 Market Share Analysis (Market Rank/Share for key companies)
- 6.4 Company Profiles (includes Global level Overview, Market level overview, Core Segments, Financials as available, Strategic Information, Products & Services, and Recent Developments)
- 6.4.1 NextEra Energy Inc.
- 6.4.2 Orsted A/S
- 6.4.3 Invenergy LLC
- 6.4.4 Pattern Energy Group LP
- 6.4.5 Duke Energy Corp.
- 6.4.6 Acciona Energia, S.A.
- 6.4.7 Avangrid Inc. (Iberdrola)
- 6.4.8 EDF Renewables North America
- 6.4.9 EnBW Energie Baden-Wurttemberg AG
- 6.4.10 E.ON SE
- 6.4.11 BP plc (bp Wind Energy)
- 6.4.12 Shell New Energies
- 6.4.13 Brookfield Renewable Partners
- 6.4.14 Algonquin Power & Utilities
- 6.4.15 TransAlta Renewables
- 6.4.16 Trident Winds Inc.
- 6.4.17 Copenhagen Infrastructure Partners (CIP)
- 6.4.18 Siemens Gamesa Renewable Energy
- 6.4.19 General Electric Co.
- 6.4.20 Vestas Wind Systems A/S
- 6.4.21 Nordex SE
- 6.4.22 Envision Energy
- 6.4.23 Goldwind Americas
7 Market Opportunities & Future Outlook
- 7.1 White-space & Unmet-need Assessment