
|
시장보고서
상품코드
2124695
말레이시아의 핀테크 : 시장 점유율 분석, 업계 동향과 통계, 성장 예측(2026-2031년)Malaysia Fintech - Market Share Analysis, Industry Trends & Statistics, Growth Forecasts (2026 - 2031) |
||||||
 Mordor Intelligence
Mordor Intelligence에 의하면, 말레이시아의 핀테크 시장 규모는 2025년에 104억 달러로 평가되었고, 2026년 120억 7,000만 달러에서 2031년까지 254억 1,000만 달러에 이를 것으로 예측되며, 예측 기간(2026-2031년) CAGR은 16.05%를 기록할 전망입니다.
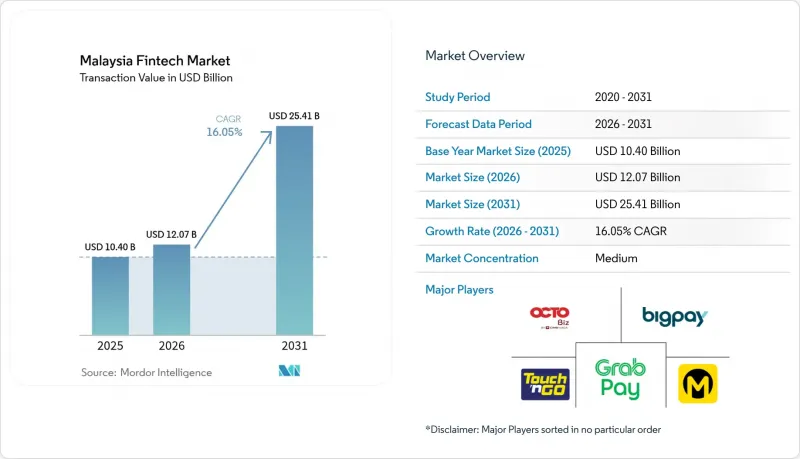
본 보고서는 서비스 유형(디지털 결제, 디지털 대출·자금 조달, 디지털 투자, 인슈어테크, 네오뱅킹), 최종 사용자(개인, 기업), 사용자 인터페이스(모바일 앱, 웹/브라우저,POS/IoT 기기), 지역(클란 밸리, 북부 지역, 남부 지역, 동해안, 동말레이시아)별로 분류되어 있습니다. 시장 예측은 금액(달러) 기준으로 제시되어 있습니다.
말레이시아의 핀테크 시장 동향 및 인사이트
스마트폰 및 인터넷 보급률의 높은 수준이 대상 시장의 확장을 견인
말레이시아의 스마트폰 보급률은 85%를 넘고, 인터넷 접속률은 주민의 90%에 달하여 핀테크 서비스를 이용할 수 있는 디지털 친화적 고객층이 확대되고 있습니다. Touch 'n Go Digital사는 전략적 투자자로부터 7,500만 달러를 조달함에 따라 2025년에 첫 연간 흑자 전환을 예상하고 있으며, 이러한 높은 모바일 보급률이 이를 가능하게 했습니다. 전자 지갑 이용률은 이미 40%에 달하고,, 기존 은행 서비스 이용률을 웃돌고 있습니다. 2024년 Google Pay가 ShopeePay 및 TNG eWallet과 제휴한 사례는 인프라의 성숙도가 생태계 내 파트너십을 가속화하고, 지갑에 대한 정착도를 높이고 있음을 보여줍니다. 이 서비스의 채택은 젊은 층이 주도하고 있으며, 40세 이하 사용자가 전체의 90%를 차지해 향후 출시될 제품의 주요 타겟이 되고 있습니다.
정부의 ‘MyDigital’ 및 금융 부문 청사진 이니셔티브가 생태계 발전을 촉진
‘MyDigital’로드맵은 2025년 말까지 디지털 경제가 GDP의 25.5%를 차지하는 것을 목표로 하고 있으며, 2024년에 승인된 1,636억 링깃(343억 6,000만 달러) 규모의 디지털 투자(전년 대비 250% 증가)에 의해 뒷받침되고 있습니다. 지적 재산(IP) 소득에 대해 10년간 0%의 세율을 적용하는 세제 혜택에 힘입어, 현재 전국에서 3,891개 이상의 ‘말레이시아 디지털’ 인증 기업이 사업을 전개하고 있습니다. ‘금융 부문 청사진’이 제시한 무현금 거래 비율 75%라는 목표에 따라, 결제 단말기 및 데이터 보호 체계 강화를 위한 보조금이 지급되고 있습니다. 디지털부가 페낭에 북부 사무소를 개설하고, 클랑 밸리 이외의 지역으로도 우대 조치와 기술적 지도를 확대하고 있는 점으로 미루어 볼 때, 지역적 확장이 진행되고 있음을 알 수 있습니다.
사이버 사기에 대한 우려가 사용자의 신뢰를 훼손하고, 규정 준수 비용을 증가시키고 있습니다.
사이버 보안 위협과 디지털 사기 사건 증가는 핀테크 도입에 큰 걸림돌이 되고 있으며, 업계 전체의 규정 준수 비용은 전년 대비 25% 증가했습니다. 말레이시아 중앙은행(BNM)과 태국 중앙은행은 2025년 4월, 사이버 보안 및 디지털 사기 대책에 관한 협력 양해각서(MOU)에 서명하며, 이러한 위협이 국경을 초월한 것임을 부각시켰습니다. 이에 대응해 말레이시아의 각 은행은 모바일 애플리케이션에 악성코드 방지 기능을 추가했으며, 한편 말레이시아 중앙은행(BNM)이 개설한 ‘전국 사기 포털’을 통해 사기 추적 시간이 75% 단축되었습니다. 이는 문제의 심각성과 기관 차원의 대응을 모두 보여줍니다. GXBank가 ‘Cyber Fraud Protect’ 보험 상품을 도입한 것은 핀테크 기업이 보안 우려를 수익화하면서도 고객의 위험 회피 성향에도 대응하고 있음을 반영합니다.
부문 분석
2025년, 말레이시아의 핀테크 시장 점유율의 50.72%를 디지털 결제가 차지했습니다. 이는 Touch 'n Go Digital을 통한 다중 모드 교통 기관 및 소매업과의 제휴가 원동력이 되었습니다. 정부의 무현금화 장려 정책과 지역 간 QR 코드 상호운용성 추진으로 인해 이러한 우위는 계속해서 확대되고 있습니다. 디지털 대출은 21.03%로 2위를 차지했으며, Funding Societies의 2,700만 달러 자금 조달을 통해 샤리아 준수를 준수하는 중소기업 대출 한도가 확대된 것이 이를 뒷받침했습니다. 인슈어테크는 15.05%를 차지하고 있으며, PolicyStreet의 1,540만 달러 규모 시리즈 B 자금 조달과 500만 명에 달하는 사용자 기반이 그 실적을 뒷받침하고 있습니다.
네오뱅킹은 2025년에는 7.35%에 그치겠지만, 연평균 성장률(CAGR) 26.12%를 나타낼 것으로 예측되며, 수수료 없는 계좌 및 신속한 계좌 개설을 통해 기존 금융기관과의 격차를 좁혀갈 것으로 전망됩니다. 디지털 투자는 5.85%를 차지하고 있으며, StashAway가 샤리아 준수 포트폴리오에 더해 비트코인 및 이더리움 ETF를 출시함에 따라 수익 다각화가 진행되고 있습니다. 증권위원회의 디지털 혁신 펀드는 15건의 시범 사업에 공동 투자하고 있으며, 이는 향후 서비스 구성의 변화를 시사합니다.
기타 혜택:
- 엑셀 형식 시장 예측(ME) 시트
- 3개월간의 애널리스트 지원
자주 묻는 질문
목차
제1장 서론
제2장 조사 방법
제3장 주요 요약
제4장 시장 구도
제5장 시장 규모와 성장 예측
제6장 경쟁 구도
제7장 시장 기회와 향후 전망
LSH 26.09.14According to Mordor Intelligence, the Malaysia fintech market size was valued at USD 10.40 billion in 2025 and estimated to grow from USD 12.07 billion in 2026 to reach USD 25.41 billion by 2031, at a CAGR of 16.05% during the forecast period (2026-2031).
This report is Segmented by Service Proposition (Digital Payments, Digital Lending & Financing, Digital Investments, Insurtech, Neobanking), End-User (Retail, Businesses), User Interface (Mobile Applications, Web/Browser, POS/IoT Devices), and Geography (Klang Valley, Northern Region, Southern Region, East Coast, East Malaysia). The Market Forecasts are Provided in Terms of Value (USD).
Malaysia Fintech Market Trends and Insights
High Smartphone & Internet Penetration Drives Addressable Market Expansion
Malaysia's smartphone penetration surpasses 85% and internet connectivity reaches 90% of residents, growing the digital-ready customer pool for fintech services. Touch 'n Go Digital expects its first full-year profitability in 2025 after securing USD 75 million from strategic investors, a milestone enabled by this mobile reach. E-wallet usage already touches 40%, outpacing traditional banking access. Google Pay's 2024 tie-up with ShopeePay and TNG eWallet illustrates how infrastructure maturity accelerates ecosystem partnerships that deepen wallet stickiness. Younger cohorts dominate adoption, with 90% of users aged 40 and below forming the core target for upcoming product launches.
Government MyDigital & Financial Sector Blueprint Initiatives Catalyze Ecosystem Development
The MyDigital roadmap aims for the digital economy to contribute 25.5% of GDP by end-2025, supported by MYR 163.6 billion (USD 34.36 billion) in approved digital investments in 2024, a 250% jump year-on-year. More than 3,891 Malaysia Digital-status firms now operate nationwide, buoyed by tax incentives granting 0% on IP income for a decade. The Financial Sector Blueprint's 75% cashless-transaction goal releases subsidies for payment terminals and data-protection upgrades. Regional expansion is evident as the Digital Ministry opened its northern office in Penang to funnel incentives and technical mentorship beyond Klang Valley.
Cyber-fraud Concerns Erode User Trust and Increase Compliance Costs
Rising cybersecurity threats and digital fraud incidents create significant headwinds for fintech adoption, with compliance costs increasing 25% year-on-year across the industry. Bank Negara Malaysia and Bank of Thailand signed a memorandum of understanding in April 2025 for cybersecurity and digital fraud cooperation, highlighting the cross-border nature of these threats. Malaysian banks responded by adding malware shielding to mobile applications, while BNM's National Fraud Portal launch reduced fraud tracing time by 75%, demonstrating both the severity of the problem and institutional responses. GXBank's introduction of Cyber Fraud Protect insurance products reflects how fintech companies are monetizing security concerns while addressing customer risk aversion.
Other drivers and restraints analyzed in the detailed report include:
- E-commerce Boom Amplifies Payment Volume Growth
- Favourable Sandbox & Digital Bank Licences Lower Entry Barriers
- Reliance on Incumbent Banking Rails Limits Fintech Uptime Guarantees
For complete list of drivers and restraints, kindly check the Table Of Contents.
Segment Analysis
Digital payments captured 50.72% of Malaysia fintech market share in 2025, anchored by Touch 'n Go Digital's multi-modal transport and retail integrations. Government cashless incentives and regional QR interoperability continue to widen this moat. Digital lending ranks second at 21.03%, boosted by Funding Societies' USD 27 million raise that broadened Shariah-compliant SME lines. Insurtech holds 15.05%, validated by PolicyStreet's USD 15.4 million Series B and a 5 million-strong user base.
Neobanking, though only 7.35% in 2025, is projected to grow at a 26.12% CAGR, narrowing gaps with incumbents through fee-free accounts and rapid onboarding. Digital investments stand at 5.85%, where StashAway's launch of Bitcoin and Ethereum ETFs alongside Shariah portfolios diversifies revenue. The Securities Commission's Digital Innovation Fund has co-financed 15 pilots, signalling future service-mix shifts.
Complete Report Scope:
- By Service Proposition
- Digital Payments
- Digital Lending & Financing
- Digital Investments
- Insurtech
- Neobanking
- By End-User
- Retail
- Businesses
- By User Interface
- Mobile Applications
- Web / Browser
- POS / IoT Devices
- By Geography
- Klang Valley
- Northern Region
- Southern Region
- East Coast
- East Malaysia
List of Companies Covered in this Report:
- Maybank
- CIMB
- Touch 'n Go Digital
- Boost
- BigPay
- GrabPay
- Razer Fintech
- Axiata Digital (Aspirasi)
- Funding Societies
- CapBay
- MoneyMatch
- Jirnexu (RinggitPlus)
- iMoney
- StashAway
- Wahed Invest
- Bursa Digital Exchange
- PolicyStreet
- Tune Protect
- Oyen
- Etiqa Digital
- Prudential Pulse
- GHL Systems
- MyPOSPay
- Soft Space
- FavePay
Additional Benefits:
- The market estimate (ME) sheet in Excel format
- 3 months of analyst support
TABLE OF CONTENTS
1 Introduction
- 1.1 Study Assumptions & Market Definition
- 1.2 Scope of the Study
2 Research Methodology
3 Executive Summary
4 Market Landscape
- 4.1 Market Overview
- 4.2 Market Drivers
- 4.2.1 High smartphone & internet penetration
- 4.2.2 Government's MyDigital & FSB initiatives
- 4.2.3 E-commerce boom
- 4.2.4 Favourable sandbox & digital bank licences
- 4.2.5 Rising demand for Islamic fintech
- 4.2.6 ASEAN cross-border QR-code integration
- 4.3 Market Restraints
- 4.3.1 Cyber-fraud concerns
- 4.3.2 Reliance on incumbent banking rails
- 4.3.3 Shortage of deep-tech fintech talent
- 4.3.4 Regional digital tax complexity
- 4.4 Value / Supply-Chain Analysis
- 4.5 Regulatory Landscape
- 4.6 Technological Outlook
- 4.7 Porter's Five Forces
- 4.7.1 Threat of New Entrants
- 4.7.2 Bargaining Power of Suppliers
- 4.7.3 Bargaining Power of Buyers
- 4.7.4 Threat of Substitutes
- 4.7.5 Competitive Rivalry
5 Market Size & Growth Forecasts
- 5.1 By Service Proposition
- 5.1.1 Digital Payments
- 5.1.2 Digital Lending & Financing
- 5.1.3 Digital Investments
- 5.1.4 Insurtech
- 5.1.5 Neobanking
- 5.2 By End-User
- 5.2.1 Retail
- 5.2.2 Businesses
- 5.3 By User Interface
- 5.3.1 Mobile Applications
- 5.3.2 Web / Browser
- 5.3.3 POS / IoT Devices
- 5.4 By Geography
- 5.4.1 Klang Valley
- 5.4.2 Northern Region
- 5.4.3 Southern Region
- 5.4.4 East Coast
- 5.4.5 East Malaysia
6 Competitive Landscape
- 6.1 Market Concentration
- 6.2 Strategic Moves
- 6.3 Market Share Analysis
- 6.4 Company Profiles (includes Global level Overview, Market level overview, Core Segments, Financials as available, Strategic Information, Market Rank/Share for key companies, Products & Services, and Recent Developments)
- 6.4.1 Maybank
- 6.4.2 CIMB
- 6.4.3 Touch 'n Go Digital
- 6.4.4 Boost
- 6.4.5 BigPay
- 6.4.6 GrabPay
- 6.4.7 Razer Fintech
- 6.4.8 Axiata Digital (Aspirasi)
- 6.4.9 Funding Societies
- 6.4.10 CapBay
- 6.4.11 MoneyMatch
- 6.4.12 Jirnexu (RinggitPlus)
- 6.4.13 iMoney
- 6.4.14 StashAway
- 6.4.15 Wahed Invest
- 6.4.16 Bursa Digital Exchange
- 6.4.17 PolicyStreet
- 6.4.18 Tune Protect
- 6.4.19 Oyen
- 6.4.20 Etiqa Digital
- 6.4.21 Prudential Pulse
- 6.4.22 GHL Systems
- 6.4.23 MyPOSPay
- 6.4.24 Soft Space
- 6.4.25 FavePay
7 Market Opportunities & Future Outlook
- 7.1 Embedded finance for SMEs via POS/IoT
- 7.2 Digital wealth for aging affluent segment