
|
시장보고서
상품코드
2124698
인도의 산업용 센서 및 트랜스미터 시장 : 시장 점유율 분석, 업계 동향 및 통계, 성장 예측(2026-2031년)India Industrial Sensors And Transmitters - Market Share Analysis, Industry Trends & Statistics, Growth Forecasts (2026 - 2031) |
||||||
 Mordor Intelligence
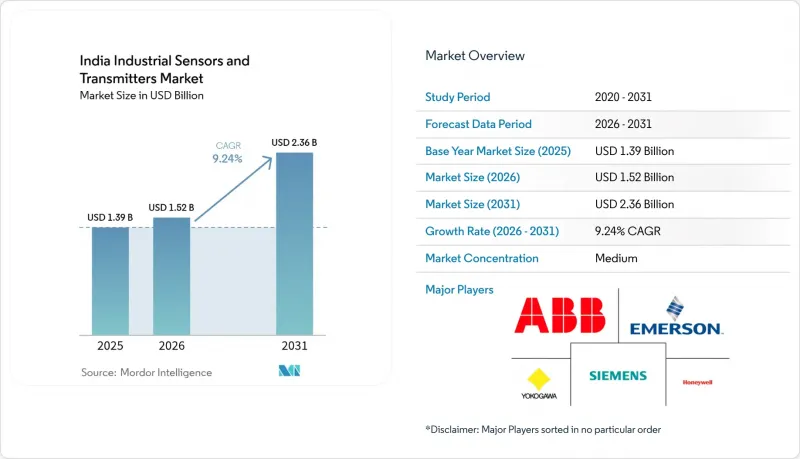
Mordor Intelligence에 의하면, 인도의 산업용 센서 및 트랜스미터 시장 규모는 2025년 13억 9,000만 달러로 평가되었고, 2026년에는 15억 2,000만 달러로 추정되고, 2026-2031년 CAGR 9.24%로 성장을 지속할 전망이며, 2031년까지 23억 6,000만 달러에 이를 것으로 예측됩니다.
본 보고서는 센서 유형별(유량, 온도, 압력, 레벨 등), 최종 사용자 산업별(발전·유틸리티, 석유 및 가스 등), 폼 팩터 및 설치 방식별(접촉식/인라인식 및 비접촉식/클램프온식/원격식), 통신 기술별(유선, 산업용 이더넷, 무선) 및 지역별로 분류되어 있습니다. 시장 예측은 금액(달러) 기준으로 제시되어 있습니다.
인도의 산업용 센서 및 트랜스미터 시장 동향과 인사이트
정부의 ‘메이크 인 인디아’ 및 PLI(생산 연계 인센티브) 제도가 스마트 팩토리를 촉진
76,000 카롤 루피(91억 달러) 상당의 실적 연계형 인센티브는 지속적인 설비 투자와 생산량 증가를 보이는 제조업체에 보상을 제공하며, 조달 결정을 국산 센서 부품 쪽으로 기울게 하고 있습니다. 다국적 기업들은 이에 대응하여 물류 비용 절감, 리드타임 단축, 그리고 인도의 운영 조건에 맞춘 제품 라인 조정을 실현하는 수직 통합형 공장을 건설하고 있습니다. 또한, 국내 조달 비율 증가는 인도의 산업용 센서 및 트랜스미터 시장 구매자들을 환율 변동으로부터 보호하는 역할도 하고 있습니다. 중기적으로는 현지 공급업체 생태계가 더욱 확충됨에 따라, 첨단 스마트 센서의 가격 프리미엄이 축소되고 중견 제조업체들의 도입이 더욱 가속화될 전망입니다.
개별 제조업 분야의 인더스트리 4.0 도입 확대
전기차로의 전환을 추진하는 자동차 제조업체, 라인 전환을 최적화하는 전자기기 조립 제조업체, 예측 분석을 도입하는 자본재 제조업체는 모두 실시간 상태 데이터에 대한 공통된 요구를 가지고 있습니다. 공장 책임자에 따르면, 생산 설비에 진동, 온도, 전력 품질 센서를 통합한 결과 가동 중단 시간이 최대 30% 감소했으며, 이로 인해 1제곱피트당 처리량이 현저히 향상되었다고 합니다. 하이데라바드에 위치한 다이후쿠사의 센서를 대거 도입한 자재관리 공장과 같은 성공 사례는 OEM으로부터의 평가를 유지하고자 하는 2차 공급업체들 사이에서 유사한 프로젝트를 촉진하고 있습니다. 따라서 인도의 산업용 센서 및 트랜스미터 시장은 이러한 선순환의 혜택을 누리게 될 것입니다. 즉, 성능 향상으로 인해 센서에 대한 예산 확대가 정당화되고, 도입 규모 확대가 더 많은 데이터를 생성하며, 이는 다시 고부가가치 분석 서비스로 이어지는 것입니다.
첨단 스마트 센서를 활용한 개조에는 막대한 설비 투자가 필요
진단 기능이나 무선 모듈이 내장된 스마트 유닛은 기존 제품에 비해 가격이 3배나 되는 경우가 많으며, 시설 전체의 전면적인 개조에는 200만-500만 달러의 신규 지출이 필요할 수 있습니다. 이익률이 낮은 중소기업들은 5년이라는 회수 기간 동안 자본을 묶어두는 것을 주저하고 있어, 본래라면 인도의 산업용 센서 및 트랜스미터 시장을 견인해야 할 대규모 발주가 지연되고 있습니다. 정부의 저금리 대출 및 가속 상각 제도를 통해 고액의 초기 비용으로 인한 충격은 일부 상쇄되고 있지만, Tier 1 산업단지 외의 지역에서는 이러한 제도에 대한 인지도가 여전히 부족한 실정입니다.
부문 분석
압력 측정 기기는 2025년 출하 대수의 27.12%를 차지했으며, 탄화수소 처리, 화학 합성, 발전용 보일러 운전에서 안전하고 효율적인 운영을 위한 기반적인 역할이 부각되고 있습니다. 고압 파이프라인에 대해 규제 당국이 더욱 엄격한 안전 여유를 의무화하는 가운데, 압력 측정과 관련된 인도의 산업용 센서 및 트랜스미터 시장 규모는 꾸준한 속도로 확대될 것으로 예측됩니다. 각 제조업체는 인도 정유시설에서 나타나는 다양한 점도 및 부식성 특성에 적합한 방폭형 및 차압형 등의 설계를 도입하여 제품 라인업을 지속적으로 확충하고 있습니다. 한편, 진동 및 상태 모니터링용 센서는 자동차, 시멘트, 철강 플랜트에서 예기치 않은 가동 중단 시간을 대폭 줄이는 것을 목표로 하는 유지보수 업무의 디지털화 프로그램에 힘입어 2031년까지 연평균 성장률(CAGR) 10.95%를 기록할 전망입니다. 센서와 예측 분석 대시보드를 세트로 제공하는 공급업체는 정기적인 서비스 수익원을 확보하여 인도 산업용 센서 및 트랜스미터 시장에서 전반적인 가치 확보를 강화하고 있습니다.
상위 2개 카테고리 외에도, 온도 프로브는 정밀한 온도 제어를 통해 배치의 열화를 방지하는 제약 업계의 멸균 루프 및 유제품 저온 살균 라인에서 꾸준한 수요를 유지하고 있습니다. 유량 센서는 지방자치단체의 스마트 워터 계획에 의해 자금이 지원되는 폐수 처리 및 해수 담수화 프로젝트에서 보급률이 높아지고 있습니다. 레벨 센서는 개별 사일로 모니터링에서 통합 재고 관리 시스템으로 전환되고 있으며, ERP와 연동된 원자재 가시화를 실현하고 있습니다. 가스 및 습도 센서는 클린룸에서 차세대 데이터센터로 적용 범위를 확대하고 있으며, 안정적인 공기 품질이 서버의 수명을 연장하고 있습니다. 모든 카테고리에서 OEM 기업들은 여러 감지 방식을 단일 하우징에 통합한 다중 파라미터 플랫폼을 점점 더 적극적으로 추진하고 있으며, 이를 통해 설치 작업의 수고를 줄이는 동시에 인도의 산업용 센서 및 트랜스미터 시장의 평균 판매 가격을 끌어올리고 있습니다.
탄화수소 밸류체인에 참여하는 기업들은 인도 석유 공사(Indian Oil Corporation)의 24,000 카롤 인디안 루피(28억 8,000만 달러) 규모의 석유화학 사업 확장 등 자본 프로젝트를 중심으로 2025년 매출의 26.15%를 차지했습니다. SIL 인증 압력 트랜스미터부터 가연성 가스 감지기에 이르는 안전 계장 장비가 석유 및 가스 분야의 지출 대부분을 차지하고 있으며, 환경 당국에 의한 배출량 지속적 모니터링 의무화가 인도의 산업용 센서 및 트랜스미터 시장을 더욱 확대시키고 있습니다. 그러나 예측 기간 동안 제약 및 생명공학 시설이 연평균 성장률(CAGR) 11.02%를 나타낼 것으로 예측되며, 백신 및 바이오의약품 공장이 콜드체인 저장, 동결건조실, 지정 클린룸에 걸친 GMP 준수 센서 네트워크를 확대함에 따라 시장 점유율 격차는 줄어들 것으로 전망됩니다.
유틸리티 분야에서는 스마트 계량 및 변전소 자동화가 도입되면서 변압기의 전력 품질용 트랜스듀서 및 광섬유식 온도 루프 채택이 촉진되고 있습니다. 석유화학, 화학, 비료 업계에서는 가교 반응 매개변수를 모니터링하는 다변수 센서를 활용하여 처리 능력 최적화를 추구하고 있습니다. 식품 및 음료 가공 업계에서는 HACCP 체크리스트에 그치지 않고, 블렌딩부터 포장까지의 실시간 추적성을 실현하기 위해 클라우드 연동형 센서를 도입하고 있습니다. 상하수도 유틸리티자는 연결 공사 중 서비스 중단을 해소하는 클램프온식 초음파 유량계를 채택하고 있습니다. 금속 및 광업 기업은 컨베이어나 볼 밀의 구동계 마모를 예측하기 위해 내환경성이 뛰어난 진동 프로브를 도입하고 있습니다. 이러한 각 업계가 어우러져 인도의 산업용 센서 및 트랜스미터 시장을 다각화시키고, 특정 상품 주기에 대한 과도한 의존을 줄이고 있습니다.
기타 혜택 :
- 엑셀 형식 시장 예측(ME) 시트
- 3개월간 애널리스트 지원
자주 묻는 질문
목차
제1장 서론
제2장 조사 방법
제3장 주요 요약
제4장 시장 구도
제5장 시장 규모 및 성장 예측
제6장 경쟁 구도
제7장 시장 기회 및 향후 전망
AJY 26.09.15According to Mordor Intelligence, the India industrial sensors and transmitters market size is expected to grow from USD 1.39 billion in 2025 to USD 1.52 billion in 2026 and is forecast to reach USD 2.36 billion by 2031 at 9.24% CAGR over 2026-2031.
This report is Segmented by Sensor Type (Flow, Temperature, Pressure, Level, and More), End-User Industry (Power Generation and Utilities, Oil and Gas, and More), Form Factor/Installation (Contact/In-line and Non-contact/Clamp-on/Remote), Communication Technology (Wired, Industrial Ethernet, and Wireless), and Region. The Market Forecasts are Provided in Terms of Value (USD).
India Industrial Sensors And Transmitters Market Trends and Insights
Government "Make-in-India" and PLI Schemes Catalyzing Smart Factories
Performance-linked incentives worth INR 76,000 crore (USD 9.1 billion) reward manufacturers that demonstrate sustained capital expenditure and output growth, tilting sourcing decisions toward domestically produced sensor components. Multinationals have responded by building vertically integrated plants that reduce logistics costs, compress lead times, and adapt product lines to Indian operating conditions. Larger domestic content also shields buyers in the India industrial sensors and transmitters market from exchange rate volatility. Over the medium term, a denser local vendor ecosystem is likely to compress price premiums for advanced smart sensors, further accelerating adoption across mid-tier manufacturers.
Rising Industry 4.0 Adoption Across Discrete Manufacturing
Automakers transitioning to electric vehicles, electronics assemblers optimizing line changeovers, and capital-goods makers deploying predictive analytics share a common need for real-time condition data. Factory leaders report up to 30% downtime reduction after embedding vibration, thermal, and power-quality sensors into production assets, which translates to notably higher throughput per square foot. Success stories such as Daifuku's sensor-rich material-handling plant in Hyderabad catalyze copy-cat projects among Tier-2 suppliers keen to preserve OEM rankings. The India industrial sensors and transmitters market will therefore benefit from a virtuous loop: performance gains justify larger sensor budgets, and larger installations yield more data, which in turn feeds higher-value analytics services.
High CAPEX of Advanced Smart-Sensor Retrofits
Smart units with built-in diagnostics and wireless modules often cost triple the price of legacy counterparts, and comprehensive facility conversions can require USD 2-5 million in fresh outlays. SMEs with slim margins hesitate to lock capital into five-year payback horizons, delaying sizable orders that would otherwise lift the India industrial sensors and transmitters market. Government low-interest loans and accelerated depreciation allowances partially offset sticker shock, yet awareness of such schemes remains patchy outside tier-one industrial parks.
Other drivers and restraints analyzed in the detailed report include:
- Quality-Centric Regulations in Pharma and Food and Beverage sectors
- Energy-Efficiency Mandates for Utilities and Process Industries
- Interoperability and Legacy System Integration Issues
For complete list of drivers and restraints, kindly check the Table Of Contents.
Segment Analysis
Pressure devices accounted for 27.12% of 2025 shipments, underscoring their foundational role in safe and efficient hydrocarbon processing, chemical synthesis, and power-generation boiler operations. The India industrial sensors and transmitters market size tied to pressure measurement is expected to compound at a steady clip as regulatory bodies enforce tighter safety margins in high-pressure pipelines. Manufacturers continue to widen portfolios with explosion-proof and differential configurations suited to the diverse viscosity and corrosiveness profiles seen in Indian refineries. Meanwhile, vibration and condition-monitoring sensors are set to post an 10.95% CAGR through 2031, propelled by maintenance digitization programs that aim to slash unplanned downtimes across automotive, cement, and steel plants. Suppliers that bundle sensors with predictive analytics dashboards secure annuity-style service revenue streams, strengthening overall value capture within the India industrial sensors and transmitters market.
Beyond the top two categories, temperature probes retain durable demand in pharma sterilization loops and dairy pasteurization lines where precise thermal control guards against batch spoilage. Flow sensors enjoy rising penetration in effluent treatment and desalination projects funded by municipal smart-water schemes. Level sensors migrate from discrete silo monitoring toward integrated inventory-management suites, providing ERP-ready feedstock visibility. Gas and humidity sensing extend from cleanrooms into next-generation data centers, where consistent air quality boosts server lifespan. Across all classes, OEMs increasingly push multi-parameter platforms that condense several sensing modalities into a single housing, lowering installation labor while expanding the India industrial sensors and transmitters market's average selling price.
Hydrocarbon value-chain participants commanded 26.15% of 2025 revenue, anchored by capital projects such as Indian Oil Corporation's INR 24,000 crore (USD 2.88 billion) petrochemical expansion. Safety instrumentation ranging from SIL-rated pressure transmitters to combustible-gas detectors forms the bulk of oil-and-gas outlays, with environmental authorities mandating continuous emissions monitoring that further enlarges the India industrial sensors and transmitters market. Over the forecast period, however, pharma and biotech facilities are poised for an 11.02% CAGR, narrowing the share gap as vaccine and biologics plants scale GMP-compliant sensor grids spanning cold-chain storage, lyophilization chambers, and classified cleanrooms.
Utilities deploy smart metering and sub-station automation, driving uptake of power-quality transducers and fiber-optic temperature loops in transformers. Petrochemicals, chemicals, and fertilizers chase throughput optimization via multivariable sensors that monitor cross-linked reaction parameters. Food and beverage processors move beyond HACCP checklists, integrating cloud-linked sensors for real-time traceability from blending to packaging. Water and wastewater operators embrace clamp-on ultrasonic flow meters that eliminate service disruptions during tie-ins. Metals and mining companies adopt ruggedized vibration probes to anticipate drivetrain wear in conveyors and ball mills. Collectively, these verticals diversify the India industrial sensors and transmitters market, reducing over-reliance on any single commodity cycle.
Complete Report Scope:
- By Sensor Type
- Flow
- Temperature
- Pressure
- Level
- Vibration/Condition-Monitoring
- Gas and Humidity
- Other Sensor Types
- By End-user Industry
- Power Generation and Utilities
- Oil and Gas
- Petrochemicals, Chemicals and Fertilizers
- Food and Beverage
- Life Sciences (Pharma, Biotech and Medical Devices)
- Water and Waste-water
- Metals and Mining
- Other Manufacturing (Textile, Pulp and Paper, Auto, etc.)
- By Form Factor/Installation
- Contact/In-line
- Non-contact/Clamp-on/Remote
- By Communication Technology
- Wired (HART, MODBUS, PROFIBUS, etc.)
- Industrial Ethernet (PROFINET, EtherNet/IP, etc.)
- Wireless (ISA100, WirelessHART, Wi-SUN, LPWAN)
- By Region
- North India
- West India
- South India
- East and North-East India
- Central India
List of Companies Covered in this Report:
- ABB India Limited
- Honeywell Automation India Limited
- Siemens Limited
- Yokogawa India Ltd.
- Emerson Process Management (India) Pvt. Ltd.
- Schneider Electric Systems India Pvt. Ltd.
- Endress+Hauser (India) Automation Instruments Pvt. Ltd.
- WIKA Instruments India Pvt. Ltd.
- Pepperl+Fuchs (India) Pvt. Ltd.
- Turck India Automation Pvt. Ltd.
- Omron Automation Private Limited
- Bosch Rexroth (India) Pvt. Ltd.
- Vega India Level and Pressure Measurement Pvt. Ltd.
- Baumer Technologies India Pvt. Ltd.
- Phoenix Contact (India) Pvt. Ltd.
- ifm electronic India Pvt. Ltd.
- Rockwell Automation India Pvt. Ltd.
- SICK India Pvt. Ltd.
- Vishay Components India Private Ltd.
- EXA Thermometrics India Pvt. Ltd.
- SRI Electronics
- Sensorex, Inc.
Additional Benefits:
- The market estimate (ME) sheet in Excel format
- 3 months of analyst support
TABLE OF CONTENTS
1 INTRODUCTION
- 1.1 Study Assumptions and Market Definition
- 1.2 Scope of the Study
2 RESEARCH METHODOLOGY
3 EXECUTIVE SUMMARY
4 Market Landscape
- 4.1 Market Overview
- 4.2 Market Drivers
- 4.2.1 Government "Make-in-India" and PLI schemes catalyzing smart factories
- 4.2.2 Rising Industry 4.0 adoption across discrete manufacturing
- 4.2.3 Quality-centric regulations in pharma and Food and Beverage sectors
- 4.2.4 Energy-efficiency mandates for utilities and process industries
- 4.2.5 Data-center boom demanding precision HVAC sensors
- 4.2.6 Localization of sensor component supply chains
- 4.3 Market Restraints
- 4.3.1 High CAPEX of advanced smart-sensor retrofits
- 4.3.2 Interoperability and legacy system integration issues
- 4.3.3 Shortage of skilled instrumentation technicians
- 4.3.4 Semiconductor import dependence causing supply bottlenecks
- 4.4 Industry Value Chain Analysis
- 4.5 Regulatory Landscape
- 4.6 Technological Outlook
- 4.7 Porter's Five Forces Analysis
- 4.7.1 Threat of New Entrants
- 4.7.2 Bargaining Power of Buyers
- 4.7.3 Bargaining Power of Suppliers
- 4.7.4 Threat of Substitutes
- 4.7.5 Intensity of Competitive Rivalry
- 4.8 Impact of Macroeconomic Trends on the Market
5 MARKET SIZE AND GROWTH FORECASTS (VALUES)
- 5.1 By Sensor Type
- 5.1.1 Flow
- 5.1.2 Temperature
- 5.1.3 Pressure
- 5.1.4 Level
- 5.1.5 Vibration/Condition-Monitoring
- 5.1.6 Gas and Humidity
- 5.1.7 Other Sensor Types
- 5.2 By End-user Industry
- 5.2.1 Power Generation and Utilities
- 5.2.2 Oil and Gas
- 5.2.3 Petrochemicals, Chemicals and Fertilizers
- 5.2.4 Food and Beverage
- 5.2.5 Life Sciences (Pharma, Biotech and Medical Devices)
- 5.2.6 Water and Waste-water
- 5.2.7 Metals and Mining
- 5.2.8 Other Manufacturing (Textile, Pulp and Paper, Auto, etc.)
- 5.3 By Form Factor/Installation
- 5.3.1 Contact/In-line
- 5.3.2 Non-contact/Clamp-on/Remote
- 5.4 By Communication Technology
- 5.4.1 Wired (HART, MODBUS, PROFIBUS, etc.)
- 5.4.2 Industrial Ethernet (PROFINET, EtherNet/IP, etc.)
- 5.4.3 Wireless (ISA100, WirelessHART, Wi-SUN, LPWAN)
- 5.5 By Region
- 5.5.1 North India
- 5.5.2 West India
- 5.5.3 South India
- 5.5.4 East and North-East India
- 5.5.5 Central India
6 COMPETITIVE LANDSCAPE
- 6.1 Market Concentration
- 6.2 Strategic Moves
- 6.3 Market Share Analysis
- 6.4 Company Profiles (includes Global level Overview, Market level overview, Core Segments, Financials as available, Strategic Information, Market Rank/Share for key companies, Products and Services, and Recent Developments)
- 6.4.1 ABB India Limited
- 6.4.2 Honeywell Automation India Limited
- 6.4.3 Siemens Limited
- 6.4.4 Yokogawa India Ltd.
- 6.4.5 Emerson Process Management (India) Pvt. Ltd.
- 6.4.6 Schneider Electric Systems India Pvt. Ltd.
- 6.4.7 Endress+Hauser (India) Automation Instruments Pvt. Ltd.
- 6.4.8 WIKA Instruments India Pvt. Ltd.
- 6.4.9 Pepperl+Fuchs (India) Pvt. Ltd.
- 6.4.10 Turck India Automation Pvt. Ltd.
- 6.4.11 Omron Automation Private Limited
- 6.4.12 Bosch Rexroth (India) Pvt. Ltd.
- 6.4.13 Vega India Level and Pressure Measurement Pvt. Ltd.
- 6.4.14 Baumer Technologies India Pvt. Ltd.
- 6.4.15 Phoenix Contact (India) Pvt. Ltd.
- 6.4.16 ifm electronic India Pvt. Ltd.
- 6.4.17 Rockwell Automation India Pvt. Ltd.
- 6.4.18 SICK India Pvt. Ltd.
- 6.4.19 Vishay Components India Private Ltd.
- 6.4.20 EXA Thermometrics India Pvt. Ltd.
- 6.4.21 SRI Electronics
- 6.4.22 Sensorex, Inc.
7 MARKET OPPORTUNITIES AND FUTURE OUTLOOK
- 7.1 White-space and Unmet-Need Assessment