

|
시장보고서
상품코드
2124961
아시아태평양의 산업용 센서 : 시장 점유율 분석, 업계 동향과 통계, 성장 예측(2026-2031년)Asia-Pacific Industrial Sensors - Market Share Analysis, Industry Trends & Statistics, Growth Forecasts (2026 - 2031) |
||||||
 Mordor Intelligence
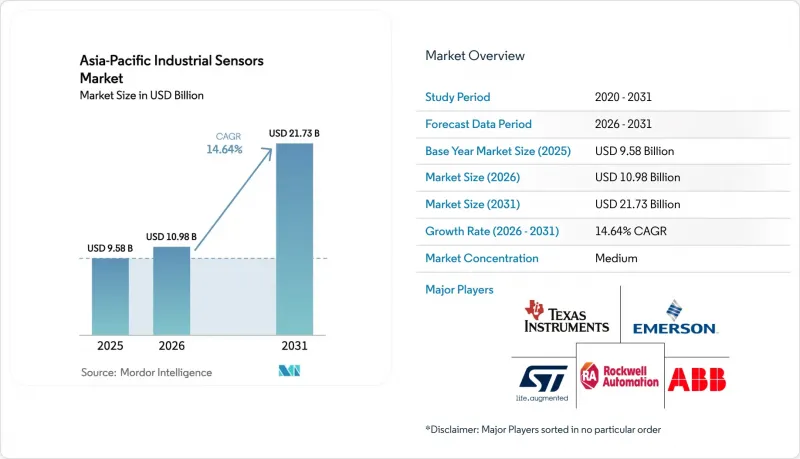
Mordor Intelligence에 의하면, 아시아태평양의 산업용 센서 시장 규모는 2025년 95억 8,000만 달러에서 2026년에는 109억 8,000만 달러에 이르고, 2026-2031년 CAGR 14.64%로 성장을 지속하여 2031년에는 217억 3,000만 달러에 달할 것으로 예측됩니다.
본 보고서는 제품 유형(압력, 온도, 레벨, 유량 등), 최종 사용자 산업(자동차, 일렉트로믹스 및 반도체 등), 센서 연결 방식(유선, 무선, IO-Link, 엣지 통합형 스마트 센서), 센싱 기술(MEMS 기반, CMOS 기반, 피에조 저항식 등) 및 지역별로 분류되어 있습니다. 시장 예측은 금액(달러) 기준으로 제시되어 있습니다.
아시아태평양의 산업용 센서 시장 동향 및 인사이트력
IIoT 및 인더스트리 4.0의 보급
각 제조업체는 포인트 수준의 자동화에서 모든 자산이 시계열 데이터를 On-Premise 또는 클라우드 분석 플랫폼으로 스트리밍하는 완전히 연결된 운영으로 전환하고 있습니다. 2024년 중국에서 산업용 AI 도입률이 94%에 달한 것은 이러한 변화의 규모를 뒷받침하며, 센서는 반도체 팹의 수율 최적화 및 화학 플랜트의 에너지 관리 루틴의 기반이 되고 있습니다. 일본의 ‘Society 5.0’ 구상은 노동력 고령화가 진행되는 상황에서 도입을 가속화하고 있습니다. 협동 로봇은 작업자의 안전을 확보하기 위해 힘 센서나 근접 센서에 의존하고 있기 때문입니다. 한국은 2025년까지 3만 곳의 스마트 팩토리 설립을 목표로 하고 있으며, 이에 따라 센서는 단순한 선택적 하드웨어에서 규정 준수를 위한 필수 요건으로 그 위상이 변화하고 있습니다. 구매자들이 상호 운용성을 요구함에 따라 오픈 프로토콜 지원 장치가 보급되고 있으며, 브랜드 충성도는 약화되고 있지만 하드웨어의 총 수는 증가하고 있습니다. 주요 벤더들은 현재 하드웨어에 분석 서비스 구독을 묶어 판매함으로써, 일회성 센서 판매를 지속적인 수익원으로 전환하고 있습니다.
아시아태평양 제조업의 급속한 자동화
인건비 급등과 공급망의 국내 회귀로 인해 제조업체들은 모든 반복 작업의 자동화를 서둘러야 하는 상황에 처해 있습니다. 인도의 PLI(생산 연계형 인센티브) 제도는 2024년까지 1,308억 달러 규모의 추가 공장 생산액을 창출하여, 새로 건설되는 전자기기 및 자동차 공장에서 온도, 압력, 광학 센서에 대한 신규 수주를 촉진할 것으로 예측됩니다. 베트남의 1,000억 달러 규모 전자기기 생산은 표면 실장 정밀도를 확보하기 위해 광학 센서에 의존하고 있으며, 부품의 소형화에 따라 공차가 엄격해짐에 따라 3-5년마다 센서를 교체하고 있습니다. 태국의 하이브리드 자동차 생산 라인 개조에서는 더 높은 정밀도의 압력·유량 측정 장치가 요구되고 있는 반면, 인도네시아의 식품 가공업체에서는 수작업 검사에서 머신 비전을 활용한 품질 관리로 전환이 진행되고 있습니다. 처리량 목표가 높아짐에 따라 센서의 교체 주기가 단축되고, 연간 교체 수익이 증가하고 있습니다.
높은 초기 비용과 ROI의 불확실성
중소기업은 예측 유지보수의 시범 도입에 일반적인 12-18개월의 회수 기간을 감당할 만한 충분한 운전 자금을 확보하지 못하는 경우가 많습니다. 연간 매출이 1,000만 달러 미만인 인도의 가족 경영 공장에서는 간접적인 이익을 가져다주는 센서보다 즉시 생산량을 향상시키는 기계를 선호하는 경향이 있습니다. 동남아시아의 자동차 부품 공장은 이익률이 낮기 때문에 24개월 이내에 ROI를 달성해야 하지만, 통합 및 학습 곡선을 고려하면 무선 도입에 최대 36개월이 소요될 수 있습니다. 지불을 분산할 수 있는 리스 모델은 여전히 적어 투자 장벽이 높아지고 있습니다. 그 결과, 자금력이 풍부한 대기업과 자원이 제한된 공급업체 간의 디지털 격차가 확대되고 있습니다.
부문 분석
2025년, 압력 센서는 아시아태평양의 산업용 센서 시장에서 34.28%의 점유율을 차지하며, 공정 제어, 유압 시스템 및 차량 안전 시스템에서 필수적인 존재임을 보여주고 있습니다. 예측에 따르면, 2031년까지 연평균 성장률(CAGR) 14.95%라는 강력한 성장이 예상되며, 그 원동력은 압축기 최적화 및 증기 분배 루프의 지연 문제를 해결할 수 있는 프라이빗 5G의 능력입니다. 온도 센서는 여전히 두 번째로 큰 카테고리를 차지하고 있으며, 이는 반도체 팹에서 0.1°C 미만의 안정성을 추구하는 것과 바이오 의약품 분야에서 8°C 이하의 콜드체인 유지 요건에 힘입은 결과입니다. 액체 수위 측정의 성장은 부식된 기계식 플로트를 고형분 함량이 높은 폐수에서도 효과적으로 작동하는 레이더식 장치로 교체하는 도시 상수도 설비 갱신에 의해 주도되고 있습니다. 유량 센서는 사용량 기반 과금 거래에서 질량 유량 기술로 전환되고 있습니다. 이 분야에서는 기존에 부피의 편차가 과다 청구 및 분쟁의 원인이 되곤 했습니다.
포트폴리오의 다른 분야에서는 가스 센서가 무균 공간의 실내 공기 모니터링 분야로 확대되고 있으며, 진동 센서는 예측 유지보수 키트의 표준 장비로 자리 잡고 있고, 광학 센서는 분당 300개 이상의 라벨 부착 정확도에 필수적입니다. 자기장 센서는 전기차(EV) 파워트레인의 정렬 조정 및 전류 감지에서 틈새 역할을 수행하고 있습니다. 생산의 단계적 업그레이드에 따라 구매자들은 압력, 온도, 광학 센싱을 결합한 하이브리드 스택을 중시하며 다차원적인 가시성을 확보하고자 하고 있으며, 이로 인해 다제품 공급업체의 교차 판매 기회가 확대되고 있습니다.
2025년 아시아태평양의 산업용 센서 시장 규모 중 자동차 분야가 26.15%를 차지했습니다. 이는 전기차 배터리 팩에 대당 100개 이상의 온도·전압 측정 노드가 내장되어 있으며, ADAS(첨단 운전자 보조 시스템) 제품군에 레이더, 라이더,초음파 장치가 통합되어 있는 점 등이 요인으로 작용하고 있습니다. 반면, 제약·생명과학 분야는 규제 당국이 무균 구역 내 지속적인 환경 모니터링에 대한 요건을 강화하고 있어, 2031년까지 연평균 성장률(CAGR) 14.72%로 성장할 전망입니다. 전자기기 제조는 3위를 차지하고 있으며, 반도체 제조 공장에서는 나노미터급 공정 안정성을 유지하기 위해 1개 거점당 5만 개 이상의 센서가 설치되는 것이 일반적입니다. 화학제품 및 석유화학제품 복합 시설에서는 폭주 반응을 방지하기 위해 압력 및 유량 감지에 의존하고 있는 반면, 전력 생산 사업자는 풍력 터빈의 기어박스나 태양광 발전용 인버터 스트링의 가동 시간을 극대화하기 위해 진동 모니터링을 활용하고 있습니다.
석유 및 가스 사업자는 케이블 설치 비용이 1미터당 1,000달러를 초과하는 해양 플랫폼에서 무선 방식을 선호하여 채택하고 있습니다. 식품 가공업체는 고압 세척을 견딜 수 있는 스테인리스 재질의 IP69K 등급 센서를 요구하고 있으며, 그 결과 교체 주기는 3년에서 5년으로 정해져 있습니다. 상수도 유틸리티자는 점점 더 엄격해지는 배수 기준을 준수하기 위해 레이더식 레벨 게이지와 pH 프로브를 채택하는 한편, 광산 현장에서는 막대한 비용이 드는 대피를 방지하기 위해 근접 센서와 가스 센서에 의존하고 있습니다. 항공우주 및 방위 분야는 여전히 특수한 틈새 시장으로, 내방사선성이며 넓은 온도 범위를 지원하는 장치가 요구되고 있으며, 이러한 제품들은 고가 대에서 거래되고 있습니다.
기타 혜택:
- 엑셀 형식 시장 예측(ME) 시트
- 3개월간의 애널리스트 지원
자주 묻는 질문
목차
제1장 서론
제2장 조사 방법
제3장 주요 요약
제4장 시장 구도
제5장 시장 규모와 성장 예측
제6장 경쟁 구도
제7장 시장 기회와 향후 전망
LSH 26.09.14According to Mordor Intelligence, the Asia-Pacific industrial sensors market size is expected to grow from USD 9.58 billion in 2025 to USD 10.98 billion in 2026 and is forecast to reach USD 21.73 billion by 2031 at 14.64% CAGR over 2026-2031.
This report is Segmented by Product Type (Pressure, Temperature, Level, Flow, and More), End-User Industry (Automotive, Electronics and Semiconductor, and More), Sensor Connectivity (Wired, Wireless, IO-Link, and Edge-Integrated Smart Sensors), Sensing Technology (MEMS-Based, CMOS-Based, Piezoresistive, and More), and Geography. The Market Forecasts are Provided in Terms of Value (USD).
Asia-Pacific Industrial Sensors Market Trends and Insights
IIoT And Industry 4.0 Penetration
Manufacturers are migrating from point-level automation to fully connected operations where every asset streams time-series data to on-premise or cloud analytics platforms. China's 94% industrial-AI adoption in 2024 validates the scale of this shift, with sensors underpinning yield optimization in semiconductor fabs and energy management routines in chemical plants. Japan's Society 5.0 program accelerates adoption in aging-workforce scenarios, as collaborative robots rely on force and proximity sensors to ensure operator safety. South Korea aims to establish 30,000 smart factories by 2025, effectively repositioning sensors from optional hardware to a compliance necessity. Open-protocol devices are proliferating as buyers seek interoperability, fragmenting brand loyalty but enlarging the total hardware pool. Premium vendors now bundle analytics subscriptions with hardware, transforming one-off sensor sales into recurring revenue.
Rapid Automation Across Asia-Pacific Manufacturing
Rising labor costs and the reshoring of supply chains push producers to automate every repetitive task. India's PLI scheme is expected to generate USD 130.8 billion in additional factory output by 2024 and spur new orders for temperature, pressure, and optical sensors in greenfield electronics and automotive plants. Vietnam's USD 100 billion electronics output relies on optical sensors for surface-mount accuracy, replacing them every three to five years as component miniaturization tightens tolerances. Thailand's retrofit of hybrid-vehicle lines demands higher-precision pressure and flow devices, while Indonesia's food processors are shifting from manual checks to machine-vision quality control. As throughput targets climb, sensor refresh cycles shorten, lifting annual replacement revenue.
High Upfront Cost And ROI Uncertainty
SMEs often lack the working capital to absorb 12- to 18-month payback periods typical of predictive-maintenance pilots. Indian family-owned mills with annual revenue below USD 10 million prefer machinery that lifts output immediately over sensors offering indirect gains. Slim margins at Southeast Asian auto-component plants demand ROI in under 24 months, whereas wireless deployments may take up to 36 months when integration and learning curves are counted. Leasing models that could spread payments remain scarce, prolonging the investment hurdle. The result is a widening digital gap between cash-rich corporations and resource-constrained suppliers.
Other drivers and restraints analyzed in the detailed report include:
- Government Incentives For Smart Factories
- Demand For Predictive Maintenance Solutions
- Legacy-System Integration Complexity
For complete list of drivers and restraints, kindly check the Table Of Contents.
Segment Analysis
Pressure sensors commanded 34.28% Asia-Pacific industrial sensors market share in 2025, reflecting their indispensability in process control, hydraulics, and vehicle safety systems. Projections show a strong 14.95% CAGR growth through 2031, driven by private 5G's ability to eliminate latency issues in compressor optimization and steam-distribution loops. Temperature sensors remain the next-largest category, underpinned by semiconductor fabs' pursuit of sub-0.1 °C stability and biologics' requirement for cold-chain integrity below 8 °C. Level-measurement growth is driven by municipal water upgrades replacing corroding mechanical floats with radar units that perform effectively in high-solids effluent. Flow sensors are shifting toward mass-flow technology in custody-transfer transactions, where volumetric variance previously led to inflated billing disputes.
Across the remainder of the portfolio, gas sensors are expanding into indoor-air monitoring for sterile spaces, vibration devices are standard equipment in predictive-maintenance kits, and optical sensors are crucial for label placement accuracy exceeding 300 units per minute. Magnetic-field sensors fulfill niche roles in EV powertrain alignment and current sensing. With each incremental production upgrade, buyers accent hybrid stacks, combining pressure, temperature, and optical sensing, to gain multidimensional visibility, intensifying cross-selling opportunities for multi-product vendors.
Automotive lines accounted for 26.15% of the Asia-Pacific industrial sensors market size in 2025, driven by the embedding of over 100 temperature and voltage nodes per unit in EV battery packs and the integration of radar, lidar, and ultrasonic devices in ADAS suites. In contrast, the pharmaceutical and life sciences segment is on track for a 14.72% CAGR through 2031, as regulators tighten mandates for continuous environmental monitoring within sterile zones. Electronics manufacturing ranks third, as chipfabs often exceed 50,000 installed sensors per site to sustain nanometer-class process stability. Chemical and petrochemical complexes rely on pressure and flow sensing to prevent runaway reactions, while power producers utilize vibration monitoring to maximize the uptime of wind turbine gearboxes and solar inverter strings.
Oil-and-gas operators favor wireless builds on offshore platforms where cabling exceeds USD 1,000 per meter. Food processors are pushing for stainless-steel IP69K sensors that can withstand high-pressure washdowns, resulting in three- to five-year replacement cycles. Water utilities adopt radar level gauges and pH probes to comply with increasingly stringent discharge limits, whereas mining sites rely on proximity and gas sensors to prevent costly evacuations. Aerospace and defense remain specialty niches demanding radiation-hardened, wide-temperature-range devices that command premium pricing.
Complete Report Scope:
- By Product Type
- Pressure
- Temperature
- Level
- Flow
- Magnetic Field
- Acceleration and Yaw Rate
- Gas
- Vibration
- Proximity
- Optical / Photo-electric
- By End-user Industry
- Automotive
- Electronics and Semiconductor
- Chemical and Petrochemical
- Power Generation
- Oil and Gas
- Food and Beverage
- Water and Wastewater
- Pharmaceuticals and Life Sciences
- Metals and Mining
- Aerospace and Defense
- By Sensor Connectivity
- Wired Sensors
- Wireless Sensors
- IO-Link Sensors
- Edge-integrated Smart Sensors
- By Sensing Technology
- MEMS-based
- CMOS-based
- Piezoresistive
- Capacitive
- Optical
- Electromagnetic
- By Geography
- China
- Japan
- South Korea
- India
- Southeast Asia
- Australia and New Zealand
- Rest of Asia-Pacific
List of Companies Covered in this Report:
- ABB Ltd.
- Emerson Electric Co.
- Honeywell International Inc.
- Siemens AG
- Rockwell Automation Inc.
- Texas Instruments Incorporated
- STMicroelectronics N.V.
- Yokogawa Electric Corporation
- Endress+Hauser AG
- Schneider Electric SE
- Mitsubishi Electric Corporation
- Omron Corporation
- Keyence Corporation
- SICK AG
- Pepperl+Fuchs SE
- Balluff GmbH
- ifm electronic gmbh
- Hans Turck GmbH and Co. KG
- TE Connectivity Ltd.
- Analog Devices Inc.
- Infineon Technologies AG
- Sensata Technologies Holding plc
- Panasonic Holdings Corp.
- First Sensor AG
- Amphenol Advanced Sensors
- Ericco International Ltd.
- Others (fully profiled >=20)
Additional Benefits:
- The market estimate (ME) sheet in Excel format
- 3 months of analyst support
TABLE OF CONTENTS
1 INTRODUCTION
- 1.1 Study Assumptions and Market Definition
- 1.2 Scope of the Study
2 RESEARCH METHODOLOGY
3 EXECUTIVE SUMMARY
4 MARKET LANDSCAPE
- 4.1 Market Overview
- 4.2 Market Drivers
- 4.2.1 IIoT And Industry 4.0 Penetration
- 4.2.2 Rapid Automation Across Asia-Pacific Manufacturing
- 4.2.3 Government Incentives For Smart Factories
- 4.2.4 Demand For Predictive Maintenance Solutions
- 4.2.5 IO-Link And Edge-Configurable Sensors Adoption
- 4.2.6 Private 5G Industrial Campus Roll-Outs
- 4.3 Market Restraints
- 4.3.1 High Upfront Cost And ROI Uncertainty
- 4.3.2 Legacy-System Integration Complexity
- 4.3.3 Chip-Supply Volatility For MEMS Devices
- 4.3.4 Spectrum Regulations Limiting Industrial Wireless
- 4.4 Industry Value Chain Analysis
- 4.5 Regulatory Landscape
- 4.6 Technological Outlook
- 4.7 Porter's Five Forces Analysis
- 4.7.1 Threat of New Entrants
- 4.7.2 Bargaining Power of Buyers
- 4.7.3 Bargaining Power of Suppliers
- 4.7.4 Threat of Substitutes
- 4.7.5 Intensity of Competitive Rivalry
5 MARKET SIZE AND GROWTH FORECASTS (VALUE)
- 5.1 By Product Type
- 5.1.1 Pressure
- 5.1.2 Temperature
- 5.1.3 Level
- 5.1.4 Flow
- 5.1.5 Magnetic Field
- 5.1.6 Acceleration and Yaw Rate
- 5.1.7 Gas
- 5.1.8 Vibration
- 5.1.9 Proximity
- 5.1.10 Optical / Photo-electric
- 5.2 By End-user Industry
- 5.2.1 Automotive
- 5.2.2 Electronics and Semiconductor
- 5.2.3 Chemical and Petrochemical
- 5.2.4 Power Generation
- 5.2.5 Oil and Gas
- 5.2.6 Food and Beverage
- 5.2.7 Water and Wastewater
- 5.2.8 Pharmaceuticals and Life Sciences
- 5.2.9 Metals and Mining
- 5.2.10 Aerospace and Defense
- 5.3 By Sensor Connectivity
- 5.3.1 Wired Sensors
- 5.3.2 Wireless Sensors
- 5.3.3 IO-Link Sensors
- 5.3.4 Edge-integrated Smart Sensors
- 5.4 By Sensing Technology
- 5.4.1 MEMS-based
- 5.4.2 CMOS-based
- 5.4.3 Piezoresistive
- 5.4.4 Capacitive
- 5.4.5 Optical
- 5.4.6 Electromagnetic
- 5.5 By Geography
- 5.5.1 China
- 5.5.2 Japan
- 5.5.3 South Korea
- 5.5.4 India
- 5.5.5 Southeast Asia
- 5.5.6 Australia and New Zealand
- 5.5.7 Rest of Asia-Pacific
6 COMPETITIVE LANDSCAPE
- 6.1 Market Concentration
- 6.2 Strategic Moves
- 6.3 Market Share Analysis
- 6.4 Company Profiles (includes Global level Overview, Market level overview, Core Segments, Financials as available, Strategic Information, Market Rank/Share for key companies, Products and Services, and Recent Developments)
- 6.4.1 ABB Ltd.
- 6.4.2 Emerson Electric Co.
- 6.4.3 Honeywell International Inc.
- 6.4.4 Siemens AG
- 6.4.5 Rockwell Automation Inc.
- 6.4.6 Texas Instruments Incorporated
- 6.4.7 STMicroelectronics N.V.
- 6.4.8 Yokogawa Electric Corporation
- 6.4.9 Endress+Hauser AG
- 6.4.10 Schneider Electric SE
- 6.4.11 Mitsubishi Electric Corporation
- 6.4.12 Omron Corporation
- 6.4.13 Keyence Corporation
- 6.4.14 SICK AG
- 6.4.15 Pepperl+Fuchs SE
- 6.4.16 Balluff GmbH
- 6.4.17 ifm electronic gmbh
- 6.4.18 Hans Turck GmbH and Co. KG
- 6.4.19 TE Connectivity Ltd.
- 6.4.20 Analog Devices Inc.
- 6.4.21 Infineon Technologies AG
- 6.4.22 Sensata Technologies Holding plc
- 6.4.23 Panasonic Holdings Corp.
- 6.4.24 First Sensor AG
- 6.4.25 Amphenol Advanced Sensors
- 6.4.26 Ericco International Ltd.
- 6.4.27 Others (fully profiled >=20)
7 MARKET OPPORTUNITIES AND FUTURE OUTLOOK
- 7.1 White-space and Unmet-need Assessment


