|
시장보고서
상품코드
2124934
북미 및 유럽의 자동판매기 : 시장 점유율 분석, 업계 동향 및 통계, 성장 예측(2026-2031년)North America And Europe Vending Machine - Market Share Analysis, Industry Trends & Statistics, Growth Forecasts (2026 - 2031) |
||||||
 Mordor Intelligence
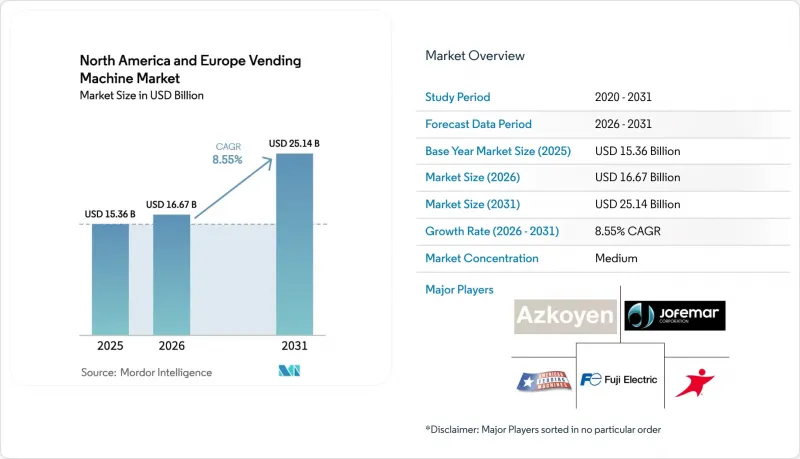
Mordor Intelligence에 의하면, 북미 및 유럽의 자동판매기 시장 규모는 2025년 153억 6,000만 달러로 평가되었습니다. 2026년에는 166억 7,000만 달러로 확대되어 2026-2031년에 걸쳐 CAGR 8.55%로 성장을 지속하여, 2031년에는 251억 4,000만 달러에 이를 것으로 예측됩니다.
본 보고서는 유형(음료, 식품·스낵, 기타), 위치(공공시설, 교통, 기타), 결제 수단(현금, 무현금-카드, 기타), 기술(비스마트(스탠드얼론), 기타), 최종 이용 산업(기업 업무 공간, 교육, 헬스케어, 기타), 지역별로 분류되어 있습니다. 시장 예측은 금액(달러) 기준으로 제시되어 있습니다.
북미 및 유럽의 자동판매기 시장 동향 및 인사이트
무현금 소액 결제 통합을 통한 단위 경제성 가속화
비접촉식 리더기 및 모바일 지갑 결제 기능을 도입한 자동판매기 사업자는 2024년에 무현금 결제 점유율을 77%로 높임으로써 동전 처리 비용을 절감한 한편, 동적 가격 책정 도입을 통해 평균 구매 금액을 최대 18%까지 끌어올렸습니다. 독일의 사례가 그 경제적 효과를 여실히 보여주고 있습니다. SECO와 BDTA는 20만 대의 담배 자동판매기에 지로카드 단말기를 사후 설치하기 시작했으며, 기존에 운영 비용의 25%를 차지하던 현금 회수 경로를 폐지했습니다.
비접촉식 소매 경험에 대한 수요 증가
팬데믹 기간 동안 도입된 비접촉식 인터페이스는 현재 혼잡한 시설에서 표준이 되었습니다. QR 코드를 통한 주문이나 음성 조작 모듈은 표면 접촉에 대한 불만을 줄여주며, 의료 및 외식 산업의 위생 프로토콜에도 부합합니다.
심화되는 사이버 보안 및 데이터 개인정보 보호 위협
EU의 사이버 복원력 법에 따르면, 자동판매기 사업자는 14일 이내에 취약점을 수정해야 할 의무가 있으며, 이를 준수하지 않을 경우 전 세계 매출액의 최대 2.5%에 해당하는 벌금이 부과됩니다. 이로 인해 구형 단말기 1대당 800-1,200달러의 규정 준수 관련 비용이 증가하고 있습니다.
부문별 분석
음료 자동판매기 매출은 여전히 북미 및 유럽 자동판매기 시장을 지탱하고 있으며, 2025년에는 매출 점유율의 45.78%를 차지했습니다. 그러나 셰프가 조리한 식사의 높은 매출 총이익률을 반영하여, 식품 및 스낵 자동판매기는 연평균 9.02%의 성장률을 보일 것으로 예측됩니다. 시카고 오헤어 공항에 설치된 1대의 ‘파머스 프리지(Farmers Fridge)’는 2024년에 12만 달러의 매출을 올렸으며, 이는 일반적인 스낵 자동판매기의 3배에 달할 전망입니다. 따라서 FDA의 온도 기록 의무와 에너지 효율이 뛰어난 프로판 시스템을 권장하는 EU의 냉매 규제에 힘입어 콜드체인에 대한 투자가 증가하고 있습니다.
천연 냉매 압축기는 설비 비용을 30-40% 상승시키지만, 전력 사용량을 20% 절감하므로 신선 식품 SKU에 대해 가격 프리미엄을 책정할 수 있게 됩니다. 음료 자동판매기는 공급업체가 자금을 지원하는 설치와 허용 온도 범위가 넓다는 점에서 계속해서 혜택을 받고 있으며, 기존 사업자들은 독점 공급권과 프로모션 가격을 통해 시장 점유율을 지키고 있습니다. 퍼스널케어 상품의 판매 비율은 여전히 5% 미만이지만, 병원이나 기숙사에서는 성장세가 두드러지고 있으며, 위생용품을 24시간 이용할 수 있게 됨에 따라 긴급 구매의 필요성이 사라졌습니다.
사무실 시장은 2025년 설치 대수의 36.72%를 차지했으나, 하이브리드 근무의 보급으로 평일 방문객 수가 감소하여 대당 매출에 압박이 가해졌습니다. 대조적으로, 공항과 지하철역은 지자체 차원의 운임 외 수입원 다각화 노력에 힘입어 연평균 8.31%의 성장이 예상됩니다. 마드리드 지하철이 145대의 티켓 스낵 복합기를 도입하는 770만 유로 규모의 계약을 체결한 것은 이러한 상업적 잠재력을 뒷받침합니다. 각 기기는 불과 4제곱피트의 공간만을 차지하며, 연간 3만 5,000달러의 수익이 예상되며, 이 수익은 교통국과 균등하게 분배됩니다.
학교나 병원 등의 공공시설은 안정적인 수요를 가져오지만, 영양 및 위생에 관한 규제가 있어 상품 라인업의 갱신 주기가 길어집니다. 레저 시설은 이벤트별 매출액은 높지만, 이용객 수가 변동하기 쉬우므로 사업자는 자동판매기 설치 밀도와 노선 효율의 균형을 맞추어야 합니다. 폐쇄형 캠퍼스 시스템은 결제를 간소화하지만, 사업자는 독점 계약에 묶여 있기 때문에 취급 상품의 시험 도입이 제한됩니다.
기타 혜택
- 엑셀 형식 시장 예측(ME) 시트
- 3개월간의 애널리스트 지원
자주 묻는 질문
목차
제1장 서론
제2장 조사 방법
제3장 주요 요약
제4장 시장 구도
제5장 시장 규모 및 성장 예측
제6장 경쟁 구도
제7장 시장 기회 및 향후 전망
KTH 26.09.14According to Mordor Intelligence, the North America and Europe vending machine market size is expected to grow from USD 15.36 billion in 2025 to USD 16.67 billion in 2026 and is forecast to reach USD 25.14 billion by 2031 at 8.55% CAGR over 2026-2031.
This report is Segmented by Type (Beverage, Food and Snacks, and More), Location (Institutional Settings, Transportation Facilities, and More), Payment Mode (Cash, Cashless - Card, and More), Technology (Non-Smart Standalone, and More), End-Use Industry (Corporate Workspaces, Education, Healthcare, and More), and Geography. The Market Forecasts are Provided in Terms of Value (USD).
North America And Europe Vending Machine Market Trends and Insights
Cashless Micro-Payments Integration Accelerating Unit Economics
Vending operators that fitted contactless readers and mobile-wallet acceptance achieved a 77% cashless share in 2024, reducing coin-handling costs and enabling dynamic pricing that lifted average ticket values by up to 18%. Germany illustrates the economics: SECO and BDTA began retrofitting 200,000 tobacco units with girocard terminals, eliminating cash-collection routes that previously absorbed 25% of operating costs.
Rising Demand for Contact-Free Retail Experiences
Touchless interfaces introduced during the pandemic are now standard in busy venues. QR-code ordering and voice-activated modules reduce surface-contact complaints and align with hygiene protocols in healthcare and food-service settings.
Escalating Cyber-Security and Data-Privacy Threats
The EU Cyber Resilience Act obliges vending operators to patch vulnerabilities within 14 days or face fines up to 2.5% of global revenue, raising compliance outlays by USD 800-1,200 per legacy unit.
Other drivers and restraints analyzed in the detailed report include:
- Expansion of Fresh-Food Vending in Transport Hubs
- AI-Powered Planogram Optimisation and Dynamic Pricing
- High Capital Cost of Retrofit for Connectivity
For complete list of drivers and restraints, kindly check the Table Of Contents.
Segment Analysis
Sales of beverage machines still anchor the North America and Europe vending machine market, holding 45.78% revenue share in 2025. However, food and snack machines are forecast to grow 9.02% annually, reflecting the superior gross margins of chef-prepared meals. A single Farmer's Fridge unit at Chicago O'Hare generated USD 120,000 in 2024 triple the take of a standard snack vendor. Cold-chain investments are therefore rising, spurred by FDA temperature-logging mandates and EU refrigerant rules that favor energy-efficient propane systems.
Natural-refrigerant compressors add 30-40% to equipment cost yet reduce electricity use by 20%, enabling price premiums on perishable SKUs. Beverage vending continues to benefit from supplier-funded placements and tolerant temperature bands, enabling incumbents to defend share through exclusive pour rights and promotional pricing. Personal-care merchandising remains below 5% but is gaining traction in hospitals and dormitories, where round-the-clock access to hygiene items offsets emergency-supply trips.
Offices delivered 36.72% of 2025 installations, but hybrid work diminished weekday footfall and pressured per-machine turnover. In contrast, airports and metro stations are projected to grow at an annual rate of 8.31%, aided by municipal efforts to diversify non-fare revenue. Metro de Madrid's EUR 7.7 million contract for 145 combo ticket-and-snack units underscores the commercial potential, each machine occupies only 4 sq ft and is expected to earn USD 35,000 yearly, split evenly with the transit authority.
Institutional venues such as schools and hospitals provide stable demand but impose nutritional or hygiene restrictions that lengthen assortment cycles. Leisure settings exhibit high per-event revenue yet volatile throughput, compelling operators to balance machine density with route efficiency. Closed-campus systems simplify settlement but tie operators into exclusive contracts, limiting SKU experimentation.
Complete Report Scope:
- By Type
- Beverage
- Food and Snacks
- Personal-Care and Hygiene
- Other Type
- By Location
- Office and Commercial Buildings
- Institutional Settings
- Transportation Facilities
- Leisure and Entertainment Venues
- By Payment Mode
- Cash
- Cashless - Card
- Cashless - Mobile Wallet / QR
- Closed-Loop Systems (Campus/Stored-Value)
- By Technology
- Smart/Connected (IoT-Enabled)
- Non-Smart (Standalone)
- By End-Use Industry
- Corporate Workspaces
- Education
- Healthcare
- Travel and Hospitality
- Manufacturing and Distribution Centres
- By Geography
- North America
- United States
- Canada
- Europe
- United Kingdom
- Germany
- France
- Italy
- Spain
- Russia
- Rest of Europe
- North America
List of Companies Covered in this Report:
- American Vending Machines Inc.
- Fuji Electric Co., Ltd.
- Azkoyen Vending Systems, S.A.
- Aramark Corporation
- Jofemar Corporation
- Compass Group PLC
- Evoca Group S.p.A.
- Crane Merchandising Systems Inc.
- Automated Merchandising Systems Inc.
- Sanden Holdings Corporation
- Selecta Group B.V.
- Bulk Vending Systems Ltd.
- Continental Vending Inc.
- FAS International S.p.A.
- N&W Global Vending S.p.A.
- Westomatic Vending Services Ltd.
- Azkoyen Group S.A.
- Bianchi Vending Group S.p.A.
- Vengo Labs Inc.
- Bianchi Industry S.p.A.
- FAS International S.p.A.
Additional Benefits:
- The market estimate (ME) sheet in Excel format
- 3 months of analyst support
TABLE OF CONTENTS
1 INTRODUCTION
- 1.1 Study Assumptions and Market Definition
- 1.2 Scope of the Study
2 RESEARCH METHODOLOGY
3 EXECUTIVE SUMMARY
4 MARKET LANDSCAPE
- 4.1 Market Overview
- 4.2 Market Drivers
- 4.2.1 Cash-less Micro-Payments Integration Accelerating Unit Economics
- 4.2.2 Rising Demand for Contact-Free Retail Experiences
- 4.2.3 Expansion of Fresh-Food Vending in Transport Hubs
- 4.2.4 AI-Powered Planogram Optimisation and Dynamic Pricing
- 4.2.5 Workplace Well-Being Initiatives Driving Healthy-Snack Offerings
- 4.2.6 Government Incentives for Energy-Efficient Refrigeration
- 4.3 Market Restraints
- 4.3.1 Escalating Cyber-security and Data-Privacy Threats
- 4.3.2 High Capital Cost of Retrofit for Connectivity
- 4.3.3 Stringent EU Waste-Reduction Regulations on Single-Use Packaging
- 4.3.4 Persistent Vandalism and Physical Theft Risks
- 4.4 Industry Value Chain Analysis
- 4.5 Regulatory Landscape
- 4.6 Technological Outlook
- 4.7 Porter's Five Forces Analysis
- 4.7.1 Bargaining Power of Suppliers
- 4.7.2 Bargaining Power of Buyers
- 4.7.3 Threat of New Entrants
- 4.7.4 Threat of Substitutes
- 4.7.5 Intensity of Competitive Rivalry
- 4.8 Impact of Macroeconomic Factors on the Market
- 4.9 Unique Vending Machines Across the Countries
5 MARKET SIZE AND GROWTH FORECASTS (VALUE)
- 5.1 By Type
- 5.1.1 Beverage
- 5.1.2 Food and Snacks
- 5.1.3 Personal-Care and Hygiene
- 5.1.4 Other Type
- 5.2 By Location
- 5.2.1 Office and Commercial Buildings
- 5.2.2 Institutional Settings
- 5.2.3 Transportation Facilities
- 5.2.4 Leisure and Entertainment Venues
- 5.3 By Payment Mode
- 5.3.1 Cash
- 5.3.2 Cashless - Card
- 5.3.3 Cashless - Mobile Wallet / QR
- 5.3.4 Closed-Loop Systems (Campus/Stored-Value)
- 5.4 By Technology
- 5.4.1 Smart/Connected (IoT-Enabled)
- 5.4.2 Non-Smart (Standalone)
- 5.5 By End-Use Industry
- 5.5.1 Corporate Workspaces
- 5.5.2 Education
- 5.5.3 Healthcare
- 5.5.4 Travel and Hospitality
- 5.5.5 Manufacturing and Distribution Centres
- 5.6 By Geography
- 5.6.1 North America
- 5.6.1.1 United States
- 5.6.1.2 Canada
- 5.6.2 Europe
- 5.6.2.1 United Kingdom
- 5.6.2.2 Germany
- 5.6.2.3 France
- 5.6.2.4 Italy
- 5.6.2.5 Spain
- 5.6.2.6 Russia
- 5.6.2.7 Rest of Europe
- 5.6.1 North America
6 COMPETITIVE LANDSCAPE
- 6.1 Strategic Moves
- 6.2 Market Share Analysis
- 6.3 Company Profiles (includes Global Level Overview, Market Level Overview, Core Segments, Financials as available, Strategic Information, Market Rank/Share for key companies, Products and Services, and Recent Developments)
- 6.3.1 American Vending Machines Inc.
- 6.3.2 Fuji Electric Co., Ltd.
- 6.3.3 Azkoyen Vending Systems, S.A.
- 6.3.4 Aramark Corporation
- 6.3.5 Jofemar Corporation
- 6.3.6 Compass Group PLC
- 6.3.7 Evoca Group S.p.A.
- 6.3.8 Crane Merchandising Systems Inc.
- 6.3.9 Automated Merchandising Systems Inc.
- 6.3.10 Sanden Holdings Corporation
- 6.3.11 Selecta Group B.V.
- 6.3.12 Bulk Vending Systems Ltd.
- 6.3.13 Continental Vending Inc.
- 6.3.14 FAS International S.p.A.
- 6.3.15 N&W Global Vending S.p.A.
- 6.3.16 Westomatic Vending Services Ltd.
- 6.3.17 Azkoyen Group S.A.
- 6.3.18 Bianchi Vending Group S.p.A.
- 6.3.19 Vengo Labs Inc.
- 6.3.20 Bianchi Industry S.p.A.
- 6.3.21 FAS International S.p.A.
7 MARKET OPPORTUNITIES AND FUTURE OUTLOOK
- 7.1 White-Space and Unmet-Need Assessment