

|
시장보고서
상품코드
2154976
북미의 5G 기술 : 시장 점유율 분석, 업계 동향과 통계, 성장 예측(2026-2031년)North America 5G Technology - Market Share Analysis, Industry Trends & Statistics, Growth Forecasts (2026 - 2031) |
||||||
 Mordor Intelligence
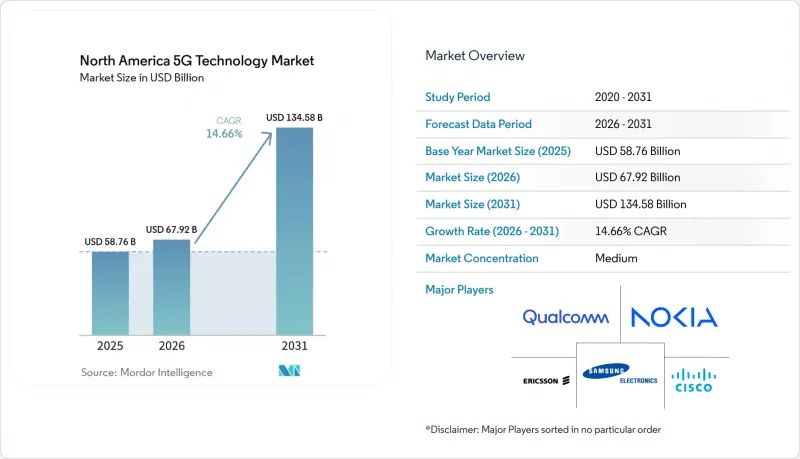
에 따르면 북미의 5G 기술 시장 규모는 2025년에 587억 6,000만 달러, 2026년에 679억 2,000만 달러에 달하며, 2031년까지 1,345억 8,000만 달러에 달할 것으로 예측되고 있으며, 2026-2031년에 CAGR 14.66%로 성장할 것으로 전망되고 있습니다.
북미 5G 기술 시장의 동향과 인사이트
도심 및 기업 캠퍼스내 네트워크 고밀도화 수요 증가
통신사업자들이 대도시권에서 미드밴드 커버리지 구축을 완료함에 따라 네트워크 밀도 향상은 계속해서 중요한 투자 우선순위로 남아 있습니다. 무선 인프라 협회(WIA)의 보고서에 따르면 미국의 실내 스몰 셀 노드 수는 2024년 80만 2,500개에서 2025년에는 83만 350개로 증가할 전망입니다. 이러한 노력은 분산형 안테나 시스템(DAS), 사설 CBRS 네트워크, 그리고 행사장, 병원, 사무실내 실내 커버리지 확보를 지원하고 있습니다. T-Mobile은 85,000곳 이상의 매크로 사이트와 57,000곳의 스몰셀을 운영하고 있으며, 이 회사의 2.5GHz 대역 주파수 대역은 경쟁사인 C-밴드 구축과 비교했을 때 사이트당 커버리지 면적이 70% 가까이 더 넓습니다. 따라서 북미의 5G 기술 시장은 실내 및 캠퍼스용 서비스 분야에서 보다 광범위한 기반을 갖추고 있습니다. 또한 중립 호스트 방식의 도입으로 건물 소유주는 실내 연결의 선정 및 자금 조달 과정에서 더 큰 역할을 수행할 수 있게 됩니다.
광섬유의 대안으로서 고정 무선 접속의 급속한 확대
미국에서는 고정 무선 접속이 가정용 광대역 서비스 제공 분야에서 점차 자리 잡고 있습니다. T-Mobile은 2025년 말 기준 850만 명의 고정 무선 가입자를 확보했으며, 2030년 목표를 1,500만 명으로 상향 조정했습니다. 주파수 대역 효율 향상, 고객 단말 장비(CPE) 선택지의 확대, 그리고 기업용 서비스 제공 개시가 이 목표를 지원하고 있습니다. 독립형 네트워크에서는 정책에 기반한 용량 할당을 통해 고정 무선 트래픽과 모바일 트래픽을 분리할 수 있습니다. 이를 통해 혼잡 압력을 완화하고, 통신 속도에 따른 서비스 요금제를 제공할 수 있게 됩니다. 에릭슨은 2025년 6월, 고정 무선 접속을 제공하는 통신 서비스 제공업체의 51% 이상이 통신 속도에 따른 요금제를 도입하고 있다고 보고했습니다. 이는 1년 전 40%에서 증가한 수치입니다. 따라서 북미의 5G 기술 시장에서는 고정 무선을 단순한 저비용 대안 수단이 아닌, 차별화된 성능을 갖춘 광대역 서비스로 자리매김할 수 있게 됩니다.
높은 주파수 대역 확보 및 구축 비용
주파수 대역 비용은 지역 사업자의 투자 능력을 계속해서 제약하고 있습니다. AT&T는 2025년 8월, 미국내 400개 이상의 시장에서 에코스타(EchoStar)의 주파수 대역 라이선스를 230억 달러에 인수하기로 합의했습니다. 이 라이선스에는 향후 서비스 범위 및 용량 확장을 지원할 수 있는 전미 규모의 저대역 및 중대역 주파수 대역이 포함되어 있습니다. 미국 의회조사국(CRS)은 연방법 제119-21호(P.L. 119-21)가 연방통신위원회(FCC)에 300MHz 주파수 대역을 경매에 부치도록 지시하고 있다고 밝혔습니다. 이 법에 따라 추가 경매 주기가 도입되어 사업자의 자본 예산에 압박을 가할 가능성이 있습니다. 멕시코 역시 할당된 주파수 대역이 제한적이며 규제 구조의 변화에 직면해 있습니다. 이러한 상황으로 인해 북미 5G 기술 시장 전반에 걸쳐 자본 확보 현황에 편차가 발생하고 있습니다.
부문 분석
2025년, 하드웨어는 구성 요소별 매출의 44.85%를 차지했습니다. 이 북미 5G 기술 시장의 점유율은 기지국, 스몰 셀 및 무선 액세스 네트워크(RAN) 업그레이드에 대한 집중적인 투자를 반영한 것입니다. 매시브 MIMO 안테나 유닛, 베이스밴드 모듈 및 사이트 장비가 해당 지역 전체의 초기 통신 영역 구축을 지원했습니다. 통신사업자들이 Open RAN 툴, 네트워크 슬라이싱 플랫폼 및 RAN 관리 애플리케이션을 도입함에 따라 소프트웨어 채택이 확대되고 있습니다. 2025년에도 하드웨어 중심의 조달 모델이 여전히 소프트웨어 매출을 제약하고 있었습니다. 삼성전자가 2026년 1월에 실시한 상용 vRAN 통화에서는 클라우드 네이티브 소프트웨어가 단일 표준 서버에서 작동하는 것이 입증되었습니다. 이러한 접근 방식을 통해 전용 베이스밴드 하드웨어의 필요성을 줄일 수 있습니다. 또한 통신사업자가 인프라 공급업체를 선정할 때의 유연성도 높아집니다. 북미의 5G 기술 시장에서는 커버리지와 용량에 대한 투자가 진행됨에 따라 여전히 대량의 하드웨어가 필요로 하고 있습니다.
서비스 시장은 2026-2031년까지 연평균 성장률(CAGR) 17.10%로 확대될 것으로 예측됩니다. 서비스 부문은 관리형 네트워크, 사설 구축 지원, 클라우드 오케스트레이션 구독을 통해 혜택을 보고 있습니다. 기업용 계약에서는 설계, 통합, 운영 및 성능 관리를 결합한 사례가 점점 늘어나고 있습니다. 에릭슨과 퓨처 테크놀러지스는 2026년 3월, 에너지, 제조, 운송, 물류 분야의 기업 무선 도입을 지원하기 위해 제휴를 확대했습니다. 이러한 비즈니스 모델은 일회성 장비 판매가 아닌 지속적인 서비스 수익을 창출합니다. 독립형 네트워크 슬라이싱을 통해 특정 서비스 품질(QoS)에 기반한 계약도 가능해집니다. 이로 인해 통신사업자나 기업의 조달 과정에서 전문 서비스 및 관리형 서비스의 역할이 강화될 가능성이 있습니다. 가상화 네트워크가 보급됨에 따라 소프트웨어와 서비스가 가치에서 더 큰 비중을 차지하게 될지도 모릅니다.
2025년에는 6GHz 미만의 주파수 대역이 주파수 대역 수익의 56.35%를 차지했습니다. 이 주파수 대역 수익 점유율은 미국, 캐나다, 멕시코 전역에 걸친 C-밴드 및 2.5GHz 대역의 구축에 힘입은 것이었습니다. 미드밴드 주파수는 광역 네트워크에서 커버리지와 용량의 현실적인 균형을 제공합니다. AT&T와 EchoStar 간의 합의는 3.45GHz 대역 및 600MHz 대역에 대한 전국 규모의 라이선스를 통해 이러한 접근 방식을 지원하고 있습니다. Verizon이 도시 지역 구축에 C-밴드를 채택하고 있는 점도 미드밴드 용량의 중요성을 보여줍니다. 밀리미터파(mmWave)는 인구 밀집 지역, 중심 업무 지구 및 대규모 기업 거점에서 여전히 중요한 역할을 수행하고 있습니다. 다만, 전파 특성상의 한계로 인해 광범위한 지역을 커버하는 수단으로서의 유효성은 떨어집니다. RedCap 장치는 완전한 기능을 갖춘 모뎀보다 전력 소비가 적기 때문에 센서나 웨어러블 기기에서 Sub-6GHz의 활용 범위를 넓힐 수 있습니다. 이러한 상황으로 인해 Sub-6GHz는 지역 구축에서 핵심 주파수 대역으로 계속해서 자리매김하고 있습니다.
하이브리드 구성은 2026-2031년에 연평균 성장률(CAGR) 17.65%로 확대될 것으로 예측됩니다. 이는 광범위한 Sub-6GHz 커버리지와 더 높은 처리량이 필요한 장소에서의 mmWave 용량을 결합한 것입니다. 이 접근 방식을 통해 통신사업자는 각 주파수 대역을 그 성능이 가장 잘 발휘되는 장소나 트래픽 프로필에 맞춰 활용할 수 있습니다. 3GPP 릴리스 17 및 18에서의 캐리어 어그리게이션 개선을 통해 주파수 대역을 가로지르는 여러 컴포넌트 캐리어의 사용이 지원됩니다. 5G Americas는 지속적인 주파수 대역의 진화와 고급 기능을 해당 지역의 5G 로드맵에서 중요한 요소로 꼽고 있습니다. 하이브리드 네트워크는 도시 지역, 행사장, 캠퍼스 등이 혼재된 환경에서 성능을 향상시킬 수 있습니다. 또한 통신사업자는 광범위한 중대역 대역을 교체하지 않고도 국소적인 용량을 추가할 수 있게 됩니다. 고객은 호환되는 무선 기기나 안테나가 필요하므로 단말기의 지원 여부는 여전히 중요합니다. 북미의 5G 기술 시장에서는 하이브리드 대역 계획을 활용함으로써 투자를 해당 지역의 트래픽 상황에 맞춰 조정할 수 있습니다.
기타 혜택:
- 엑셀 형식의 시장 예측(ME) 시트
- 3개월간의 애널리스트 지원
자주 묻는 질문
목차
제1장 서론
- 조사 전제조건과 시장 정의
- 조사 범위
제2장 조사 방법
제3장 개요
제4장 시장 구도
- 시장 개요
- 시장 성장 촉진요인
- 시장 성장 억제요인
- 5G 연혁과 진화
- 현재의 도입 사이클(선도자, 채택자, 후발자)
- 업계 밸류체인 분석
- 규제 상황 및 정책의 동향
- 기술 전망
- Porter's Five Forces 분석
- 5G와 Beyond 5G(6G 경로)
- 거시경제 요인이 시장에 미치는 영향
제5장 시장 규모와 성장 예측
- 컴포넌트별
- 주파수대별
- 용도별
- 최종사용자 산업별
- 네트워크 아키텍처별
- 국가별
- 미국
- 캐나다
- 멕시코
제6장 경쟁 구도
- 시장 집중도
- 전략적 동향
- 시장 점유율 분석
- 기업 개요
- Telefonaktiebolaget LM Ericsson(Ericsson)
- Nokia Corporation
- Qualcomm Incorporated
- Samsung Electronics Co., Ltd.
- Cisco Systems, Inc.
- Intel Corporation
- Apple Inc.
- CommScope Holding Company, Inc.
- Juniper Networks, Inc.
- Mavenir plc
- Parallel Wireless Inc.
- MediaTek Inc.
- Skyworks Solutions, Inc.
- Analog Devices, Inc.
- NEC Corporation
- Fujitsu Limited
- Marvell Technology, Inc.
- NVIDIA Corporation
제7장 시장 기회와 향후 전망
KSAAccording to Mordor Intelligence, the North America 5G technology market size is projected to be USD 58.76 billion in 2025, USD 67.92 billion in 2026, and reach USD 134.58 billion by 2031, growing at a CAGR of 14.66% from 2026 to 2031.
North America 5G Technology Market Trends and Insights
Rising Network Densification Needs Across Urban Cores and Enterprise Campuses
Network densification remains a major capital priority as operators complete mid-band coverage in large cities. The Wireless Infrastructure Association reported 830,350 indoor small-cell nodes in the United States in 2025, up from 802,500 in 2024. This work supports distributed antenna systems, private CBRS networks, and in-building coverage at venues, hospitals, and offices. T-Mobile operates more than 85,000 macro sites and 57,000 small cells, and its 2.5 GHz spectrum covers nearly 70% more area per site than competing C-band deployments. The North America 5G technology market, therefore, has a broader base for indoor and campus services. Neutral-host deployments can also give building owners a larger role in selecting and funding indoor connectivity.
Fast Expansion of Fixed Wireless Access as a Fiber Alternative
Fixed wireless access is becoming a more established part of residential broadband delivery in the United States. T-Mobile ended 2025 with 8.5 million fixed wireless subscribers and raised its 2030 target to 15 million. Improved spectrum efficiency, additional customer-premises equipment options, and business eligibility support that target. Standalone networks can separate fixed wireless traffic from mobile traffic through policy-based capacity allocation. This can reduce congestion pressure and support speed-based service plans. Ericsson reported in June 2025 that more than 51% of communications service providers offering fixed wireless access had speed-based plans, compared with 40% 1 year earlier. The North America 5G technology market can therefore position fixed wireless as a broadband service with differentiated performance rather than solely as a lower-cost alternative.
High Spectrum Acquisition and Deployment Costs
Spectrum costs continue to constrain the investment capacity of regional operators. AT&T agreed in August 2025 to acquire EchoStar spectrum licenses for USD 23 billion across more than 400 United States markets. The licenses include nationwide low-band and mid-band spectrum that can support future coverage and capacity expansion. The Congressional Research Service stated that P.L. 119-21 directs the Federal Communications Commission to auction 300 MHz of spectrum. The legislation introduces an additional auction cycle that can put pressure on operators' capital budgets. Mexico also faces a smaller assigned spectrum base and a changing regulatory structure. These conditions make capital availability uneven across the North America 5G technology market.
Other drivers and restraints analyzed in the detailed report include:
- Private 5G Adoption in Manufacturing, Logistics, and Energy Operations
- Cloud-Native Core and Open RAN Modernization by Tier-1 Operators
- Slow Monetization in Rural and Low-Density Markets
For complete list of drivers and restraints, kindly check the Table Of Contents.
Segment Analysis
Hardware accounted for 44.85% of component revenue in 2025. This North America 5G technology market share reflected intensive spending on base stations, small cells, and radio access network upgrades. Massive MIMO antenna units, baseband modules, and site equipment supported the initial coverage buildout across the region. Software adoption is rising as operators introduce Open RAN tools, network slicing platforms, and RAN management applications. Hardware-centered purchasing models still constrained software revenue during 2025. Samsung's January 2026 commercial vRAN call showed that cloud-native software can run on a single standard server. This approach can reduce the need for proprietary baseband hardware. It also gives operators greater flexibility when selecting infrastructure suppliers. The North America 5G technology market continues to require substantial hardware as coverage and capacity investments proceed.
Services are projected to expand at a 17.10% CAGR from 2026 to 2031. The services segment benefits from managed networks, private deployment support, and cloud orchestration subscriptions. Enterprise contracts increasingly combine design, integration, operations, and performance management. Ericsson and Future Technologies expanded their collaboration in March 2026 to support enterprise wireless deployments in energy, manufacturing, transportation, and logistics. These operating models create recurring service revenue rather than a one-time equipment sale. Standalone network slicing also enables contracts based on specified quality of service. This can strengthen the role of professional and managed services in operator and enterprise procurement. Software and services may capture a larger share of value as virtualized networks become more common.
Sub-6 GHz accounted for 56.35% of the spectrum band revenue in 2025. This spectrum revenue share was anchored by C-band and 2.5 GHz deployments across the United States, Canada, and Mexico. Mid-band spectrum offers a practical balance of coverage and capacity for wide-area networks. AT&T's EchoStar agreement supports that approach through nationwide licenses in the 3.45 GHz and 600 MHz bands. Verizon's use of C-band in metropolitan deployments also shows the importance of mid-band capacity. mmWave remains relevant in dense venues, central business districts, and large enterprise sites. Its propagation limits reduce its effectiveness as a broad-coverage layer. RedCap devices can widen Sub-6 GHz use in sensors and wearables because they use less power than full-capability modems. These conditions retain Sub-6 GHz as the central spectrum tier for regional deployments.
Hybrid configurations are projected to expand at a 17.65% CAGR from 2026 to 2031. They combine broad Sub-6 GHz coverage with mmWave capacity in locations that need higher throughput. The approach lets operators use each band for the locations and traffic profiles where it performs best. Carrier aggregation improvements in 3GPP Releases 17 and 18 support the use of multiple component carriers across frequency ranges. 5G Americas identifies continued spectrum evolution and advanced capabilities as important elements of the regional 5G roadmap. Hybrid networks can improve performance in mixed urban, venue, and campus environments. They also allow operators to add localized capacity without replacing the wider mid-band layer. Device support remains important because customers need compatible radios and antennas. The North America 5G technology market can use hybrid band plans to match investment with local traffic conditions.
Complete Report Scope:
- By Component
- Hardware
- Software
- Services
- By Spectrum Band
- Sub-6 GHz
- mmWave
- Hybrid (Sub-6 GHz and mmWave)
- By Application
- Enhanced Mobile Broadband (eMBB)
- Fixed Wireless Access (FWA)
- Massive Machine-Type Communications (mMTC)
- Ultra-Reliable Low-Latency Communications (URLLC)
- By End-User Industry
- Consumer
- Manufacturing
- Healthcare
- Automotive
- Energy and Utilities
- Media and Entertainment
- Public Safety and Defense
- By Network Architecture
- Stand-Alone (SA)
- Non-Stand-Alone (NSA)
- By Country
- United States
- Canada
- Mexico
List of Companies Covered in this Report:
- Telefonaktiebolaget LM Ericsson (Ericsson)
- Nokia Corporation
- Qualcomm Incorporated
- Samsung Electronics Co., Ltd.
- Cisco Systems, Inc.
- Intel Corporation
- Apple Inc.
- CommScope Holding Company, Inc.
- Juniper Networks, Inc.
- Mavenir plc
- Parallel Wireless Inc.
- MediaTek Inc.
- Skyworks Solutions, Inc.
- Analog Devices, Inc.
- NEC Corporation
- Fujitsu Limited
- Marvell Technology, Inc.
- NVIDIA Corporation
Additional Benefits:
- The market estimate (ME) sheet in Excel format
- 3 months of analyst support
TABLE OF CONTENTS
1 INTRODUCTION
- 1.1 Study Assumptions and Market Definition
- 1.2 Scope of the Study
2 RESEARCH METHODOLOGY
3 EXECUTIVE SUMMARY
4 MARKET LANDSCAPE
- 4.1 Market Overview
- 4.2 Market Drivers
- 4.2.1 Rising Network Densification Needs Across Urban Cores and Enterprise Campuses
- 4.2.2 Fast Expansion of Fixed Wireless Access as a Fiber Alternative
- 4.2.3 Private 5G Adoption in Manufacturing, Logistics, and Energy Operations
- 4.2.4 Cloud-Native Core and Open RAN Modernization by Tier-1 Operators
- 4.2.5 Growing Demand for Ultra-Low Latency in Industrial Automation and Connected Vehicles
- 4.2.6 Public Sector and Defense Network Upgrade Programs Supporting Secure 5G Deployments
- 4.3 Market Restraints
- 4.3.1 High Spectrum Acquisition and Deployment Costs
- 4.3.2 Slow Monetization in Rural and Low-Density Markets
- 4.3.3 Power Consumption and Site Acquisition Constraints for Dense Small-Cell Rollouts
- 4.3.4 Device and Ecosystem Fragmentation Across Bands, Standards, and Use Cases
- 4.4 5G Timeline and Evolution
- 4.5 Current Adoption Cycle (Forerunners, Adopters, and Laggards)
- 4.6 Industry Value Chain Analysis
- 4.7 Regulatory and Policy Landscape
- 4.8 Technological Outlook
- 4.9 Porter's Five Forces Analysis
- 4.9.1 Threat of New Entrants
- 4.9.2 Bargaining Power of Suppliers
- 4.9.3 Bargaining Power of Buyers
- 4.9.4 Threat of Substitutes
- 4.9.5 Competitive Rivalry
- 4.10 5G and Beyond (6G Pathways)
- 4.11 Impact of Macroeconomic Factors on the Market
5 MARKET SIZE AND GROWTH FORECASTS (VALUE)
- 5.1 By Component
- 5.1.1 Hardware
- 5.1.2 Software
- 5.1.3 Services
- 5.2 By Spectrum Band
- 5.2.1 Sub-6 GHz
- 5.2.2 mmWave
- 5.2.3 Hybrid (Sub-6 GHz and mmWave)
- 5.3 By Application
- 5.3.1 Enhanced Mobile Broadband (eMBB)
- 5.3.2 Fixed Wireless Access (FWA)
- 5.3.3 Massive Machine-Type Communications (mMTC)
- 5.3.4 Ultra-Reliable Low-Latency Communications (URLLC)
- 5.4 By End-User Industry
- 5.4.1 Consumer
- 5.4.2 Manufacturing
- 5.4.3 Healthcare
- 5.4.4 Automotive
- 5.4.5 Energy and Utilities
- 5.4.6 Media and Entertainment
- 5.4.7 Public Safety and Defense
- 5.5 By Network Architecture
- 5.5.1 Stand-Alone (SA)
- 5.5.2 Non-Stand-Alone (NSA)
- 5.6 By Country
- 5.6.1 United States
- 5.6.2 Canada
- 5.6.3 Mexico
6 COMPETITIVE LANDSCAPE
- 6.1 Market Concentration
- 6.2 Strategic Moves
- 6.3 Market Share Analysis
- 6.4 Company Profiles (includes Global Level Overview, Market Level Overview, Core Segments, Financials as available, Strategic Information, Market Rank/Share, Products and Services, Recent Developments)
- 6.4.1 Telefonaktiebolaget LM Ericsson (Ericsson)
- 6.4.2 Nokia Corporation
- 6.4.3 Qualcomm Incorporated
- 6.4.4 Samsung Electronics Co., Ltd.
- 6.4.5 Cisco Systems, Inc.
- 6.4.6 Intel Corporation
- 6.4.7 Apple Inc.
- 6.4.8 CommScope Holding Company, Inc.
- 6.4.9 Juniper Networks, Inc.
- 6.4.10 Mavenir plc
- 6.4.11 Parallel Wireless Inc.
- 6.4.12 MediaTek Inc.
- 6.4.13 Skyworks Solutions, Inc.
- 6.4.14 Analog Devices, Inc.
- 6.4.15 NEC Corporation
- 6.4.16 Fujitsu Limited
- 6.4.17 Marvell Technology, Inc.
- 6.4.18 NVIDIA Corporation
7 MARKET OPPORTUNITIES AND FUTURE OUTLOOK
- 7.1 White-Space and Unmet-Need Assessment


