

|
시장보고서
상품코드
2157049
리커버리 오케스트레이션 : 시장 점유율 분석, 업계 동향과 통계, 성장 예측(2026-2031년)Recovery Orchestration - Market Share Analysis, Industry Trends & Statistics, Growth Forecasts (2026 - 2031) |
||||||
 Mordor Intelligence
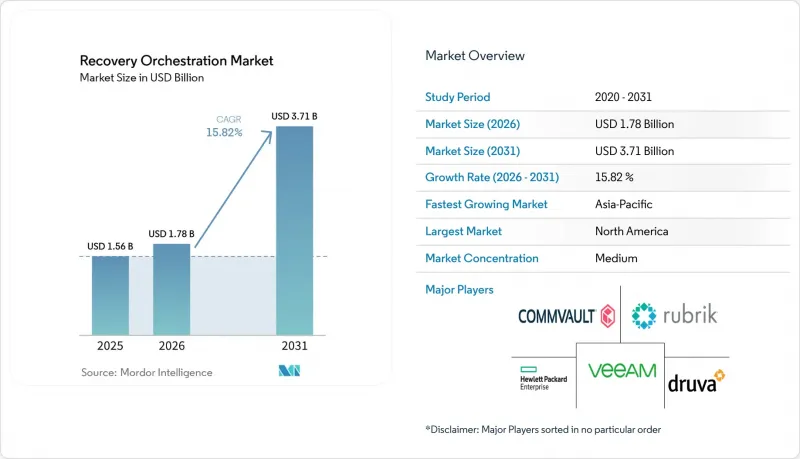
에 따르면 리커버리·오케스트레이션 시장 규모는 2025년에 15억 6,000만 달러로 평가되며, 2026년 17억 8,000만 달러에서 2031년까지 37억 1,000만 달러에 달할 것으로 예측되고 있으며, 예측 기간(2026-2031년)에 CAGR은 15.82%에 달할 전망입니다.
글로벌 복구 오케스트레이션 시장의 동향 및 인사이트
랜섬웨어 및 사이버 공격에 대한 복구 요구 사항 증가
랜섬웨어는 사고 발생시 기존의 백업 및 복구 프로세스의 운영상 한계를 드러내기 때문에 복구 오케스트레이션은 사이버 방어와 밀접하게 연관되어 있습니다. 소포스는 17개국 3,400개 조직을 대상으로 설문조사를 시행한 결과, 몸값 지불을 제외한 평균 복구 비용이 2025년에 44% 감소하여 153만 달러가 되었다고 보고했습니다. 이 조사에 따르면 53%의 조직이 1주일 이내에 완전한 복구를 달성한 것으로 나타났으며, 이는 전년의 35%에서 증가한 수치입니다. IBM은 2025년 랜섬웨어 사고의 평균 총 비용을 508만 달러로 추산하고 있으며, 2026년 보고서에서는 AI를 활용한 공격의 증가에 따라 침해 비용이 사상 최고치를 기록했다고 보고했습니다. Rubrik은 2026년에 위협으로 인해 공격 창이 몇 개월에서 몇 초로 단축됨에 따라 IT 및 보안 담당 임원의 88%가 현재의 복구 시간 목표(RTO) 달성에 대해 우려하고 있다고 보고했습니다. 이는 격리된 환경을 준비하고, 데이터를 위협에 대해 검증하며, 비즈니스 시스템을 순차적으로 복구하는 워크플로우에 대한 복구 오케스트레이션 시장의 수요를 지원하는 것입니다.
하이브리드 및 멀티클라우드 인프라의 확대
하이브리드 및 멀티클라우드 배포으로 인해 분산된 기업 환경 전반에 걸쳐 기존의 백업 툴만으로는 완전히 해결하기 어려운 복구 과제가 발생하고 있습니다. 워크로드는 온프레미스 데이터센터, 프라이빗 클라우드, 그리고 서로 다른 네트워크 모델, ID 설계, 구성 관리 시스템을 갖춘 여러 클라우드 리전에 걸쳐 존재할 수 있습니다. 한 계층에서 장애가 발생하면, 이에 의존하는 다른 계층에도 영향이 미쳐, 비즈니스 연속성 약속 하에서 수동 프로세스만으로는 달성할 수 없는 복구 시간을 초과할 가능성이 있습니다. 이러한 환경을 관리하는 조직은 DevOps에 의한 배포, 자동 스케일링, 클라우드 설정 변경으로 인해 발생하는 구성 드리프트에도 대응해야 합니다. 데이터, 인프라, 애플리케이션 구성이 통합적으로 관리되지 않을 경우, 복구 계획이 시대에 뒤처질 가능성이 있습니다. ‘인프라 아스 코드(IaC)’를 통한 복구에서는 구성 버전, 복구 계획, 데이터 복원을 동일한 관리 프로세스에 통합할 수 있으므로, 복구 오케스트레이션 시장이 그 혜택을 누리고 있습니다.
이종 환경에 걸친 도입의 복잡성
복구 오케스트레이션을 레거시 인프라, 컨테이너화된 워크로드, 클라우드 서비스, SaaS 애플리케이션에 걸쳐 배포하는 것은 어려울 수 있습니다. 각 환경마다 통합 작업, 고유한 구성 요건, 팀 간 조정이 필요하며, 이로 인해 고객이 실질적인 가치를 얻기까지 걸리는 시간이 지연될 수 있습니다. 플랫폼이 데이터, 애플리케이션, 네트워크, ID 전반에 걸쳐 복구를 올바르게 순서대로 진행하려면 최신 토폴로지 데이터가 필요하므로, 정확한 종속성 매핑이 매우 중요합니다. 많은 대기업에서는 특히 운영 모델이 개별적으로 발전해 온 경우, 모든 팀과 시스템에 걸쳐 이 데이터를 프로덕션 환경 수준의 품질로 유지하지 못하고 있습니다. 타사 의존성이 누락되거나 네트워크 설정이 오래된 경우, 실행 중에 복구 순서가 실패하여 사고 대응에 시간이 오래 걸릴 수 있습니다. 서비스 간의 관계를 보여주는 확립된 맵이 없는 상태에서 구매자가 이기종 혼합 환경을 보호해야 하는 경우, 이러한 문제가 복구 오케스트레이션 시장의 보급을 지연시키는 요인이 될 수 있습니다.
부문 분석
2025년, 복구 오케스트레이션 시장에서 소프트웨어가 58.42%를 차지했습니다. 이러한 상황은 복구 프로세스와 보안 운영 워크플로를 연계하여, 보다 광범위한 복원력 프로그램의 일환으로 배포 가능한 플랫폼 아키텍처에 대한 기업의 수요를 반영한 것입니다. API 기반 소프트웨어는 복구 기능을 보안 정보 및 이벤트 관리(SIEM), 보안 오케스트레이션·자동화·대응(SOAR), 그리고 ID 관리 툴와 연동할 수 있습니다. 이를 통해 복구 팀은 개별 백업 관리 작업을 수행하는 대신, 연결된 시스템의 운영 신호를 활용하면서 복구 정책, 테스트 결과 및 절차를 동일한 플랫폼 환경 내에서 유지할 수 있게 됩니다. 또한 이 소프트웨어는 런북을 정의하고, 복구 정책을 관리하며, 복구 절차를 테스트하고, 테스트 결과를 기록하기 위한 일관된 공간을 제공합니다. 구성 요소별 세부 내역에서 나머지 점유율은 서비스가 차지하고 있으며, 서비스는 2031년까지 연평균 성장률(CAGR) 19.66%로 확대될 것으로 예측되어, 이는 각 구성 요소 중 가장 높은 성장률입니다.
이 서비스 시장의 기회는 사내 복구 엔지니어링 역량이 제한적이라는 점과, 끊임없이 변화하는 기업 시스템 전반에 걸쳐 복구 프로그램을 설계, 테스트, 업데이트 및 운영하기 위해 필요한 실무 작업과 관련이 있습니다. 매니지드 클린룸 복구 및 오케스트레이션-어-서비스(OaaS) 모델은 조직에 복구 프로세스의 설계, 검증, 업데이트에 관한 전문적인 지원을 제공할 수 있습니다. 2025년 4월, Commvault는 ‘Cleanroom Recovery’를 매니지드 서비스 제공업체를 위해 확장하여 Azure에 더해 AWS 지원 및 파일 공유 자동 복구 기능을 추가했습니다. 이러한 움직임은 소프트웨어 우선 아키텍처를 대체하지 않고, 모든 고객에게 전담 복구 팀을 구축할 것을 요구하지 않으면서도 채널을 통한 제공으로 접근성을 확대할 수 있음을 보여주었습니다. 컨테이너화된 워크로드, SaaS 환경 및 인프라-어-코드(IaC) 파이프라인의 경우, 시스템의 진화에 따라 도입 지원, 런북 자동화, 정기적인 테스트 및 지속적인 튜닝이 필요할 수 있습니다. 고객은 개별 워크로드, 핵심 애플리케이션 및 관련 운영 팀을 위해 복구 정책을 운영 절차로 구체화하는 데 도움이 필요하므로 이러한 요구로 인해 복구 오케스트레이션 업계에서 서비스는 플랫폼 구독과 함께 지속적인 수입원이 될 수 있습니다. 또한 이 모델은 애플리케이션, 클라우드 리소스, 네트워크 규칙 및 ID 설정이 시간이 지남에 따라 변화하는 가운데 지속적인 검증을 지원하며, 공급자와 고객이 보호 대상 환경에 맞춰 복구 절차를 항상 최신 상태로 유지할 수 있도록 돕습니다.
2025년 시점에 클라우드 기반 복구는 복구 오케스트레이션 시장 규모의 61.19%를 차지했습니다. 클라우드 기반 도입은 2031년까지 연평균 성장률(CAGR) 21.23%로 확대될 것으로 예상되며, 이는 모든 도입 형태 중 가장 높은 성장률입니다. 이러한 위상은 클라우드 환경으로의 워크로드 이전이 지속되고 있다는 점과, 단일 리전이나 운영 환경을 넘어 서비스를 복구해야 할 필요성을 반영합니다. 탄력적인 용량을 통해 영구적인 규모의 보조 시설을 유지하지 않고도 복구 사태 발생시 리소스를 제공할 수 있습니다. 이는 장애 범위나 복구 수요를 사전에 파악할 수 없는 경우에 유용합니다. 멀티 리전 복제는 여러 위치에 분산된 애플리케이션 및 데이터의 복구 계획을 지원합니다. 또한 종량제 요금제를 통해 복구 비용을 현재의 위험 노출 수준에 맞출 수 있으므로, 클라우드 서비스는 복구 오케스트레이션 시장에서 신규 도입의 주요 경로가 되고 있습니다.
온프레미스 배포는 에어갭이 적용된 시스템이나 엄격한 데이터 주권 요건이 부과되는 산업 분야에서 여전히 중요한 역할을 수행하고 있습니다. 중요한 데이터에 대한 로컬 관리가 요구되는 규제 환경이나 복구 환경에서 이러한 용도가 계속 중요하더라도, 온프레미스 배포의 점유율은 전반적으로 감소할 가능성이 있습니다. 또한 기업이 인프라를 완전히 통합하지 않고 온프레미스와 클라우드 인프라 모두에서 워크로드를 보호하는 하이브리드 배포도 확대되고 있으며, 이를 통해 동일한 복구 프로그램 내에서 서로 다른 데이터, 애플리케이션 및 제어 요구 사항을 관리할 수 있게 되었습니다. 2026년 8월, AWS는 Elastic Disaster Recovery에서 멀티 서버 애플리케이션의 순차적 복구 및 복구 시뮬레이션을 수행하기 위한 ‘복구 계획’을 도입했습니다. 사용자는 종속성 순서를 정의하고, 서비스 중단 없이 복구 시뮬레이션을 통해 그 타당성을 검증하며, 계획된 복구 프로세스를 진행하기 전에 승인 체크포인트를 설정할 수 있습니다. 클라우드 공급자에 대한 종속성을 피하는 공급자는 여러 환경에서 사업을 운영하며 일관된 복구 거버넌스를 요구하는 조직의 요구에 대응할 수 있습니다.
지역별 분석
2025년, 북미는 복구 오케스트레이션 시장의 42.71%를 차지했습니다. 미국이 주요 기여 요인이된 것은 랜섬웨어가 의료, 에너지, 금융 서비스, 정부 기관에 걸친 중요 인프라를 표적으로 삼아왔기 때문입니다. SEC의 공시 규정에 따라 문서화된 복구 시간 목표(RTO) 및 감사 추적 기록은 법무 팀, 이사회 및 IT 운영 부서에 있으며, 중요한 요소가 되었습니다. 캐나다에서는 공공 부문의 복원력 프로그램과 금융 서비스 분야의 도입으로 수요가 증가하고 있습니다. 멕시코의 기술 및 제조업 부문은 신흥 수요 기반을 형성하고 있으며, 디지털화가 진행됨에 따라 체계적인 복구 프로세스에 대한 필요성이 높아질 가능성이 있습니다.
북미는 Tier 1 공급업체의 본사는 물론, ID 복구, 인프라 애즈 코드(IAC) 복구, 런북 자동화 전문가를 포함하는 가장 발전된 경쟁 환경을 갖추고 있습니다. 이러한 공급업체 기반은 가격 책정, 제품 개발, 보안 시스템, ID 서비스, 인프라 관리 툴와의 통합을 포함하여 기업 구매자가 공급업체에 기대하는 기능 범위에 대한 압박을 야기할 가능성이 있습니다. 유럽은 금융 서비스, 에너지, 통신, 중요 인프라 전반에 걸친 DORA 및 NIS2의 복합적인 영향에 의해 형성되고 있습니다. 독일, 영국, 프랑스, 이탈리아 및 베네룩스 국가들은 기업 IT 지출에서 유럽의 주요 시장을 차지하고 있습니다. DORA 제11조 및 제12조의 적용을 받는 금융 서비스 기업은 특히 상세한 테스트 및 문서화 의무를 지고 있으며, 이는 기술 조달 및 복구 거버넌스에 영향을 미치고 있습니다. 브라질과 아르헨티나가 주도하는 남미에서는 사이버 보안 프레임워크와 금융 부문의 디지털화에 따라 수요가 형성되고 있지만, 현지 전문 지식의 부족과 IT 거버넌스의 불균일성이 도입에 걸림돌이 될 수 있습니다.
아시아태평양은 2031년까지 연평균 성장률(CAGR) 21.49%로 확대될 것으로 예측됩니다. 이러한 성장은 인도, 중국, 일본, 한국에서의 클라우드 배포과, 핵심 디지털 서비스의 지속적인 가용성에 의존하는 금융 기관, 통신사업자, 공공 기관에 영향을 미치는 사이버 위협의 증가와 관련이 있습니다. 인도의 디지털 인프라 확대와 공공 부문 기관에 대한 공격으로 인해 기업 및 정부의 계획에서 복원력의 중요성이 더욱 커지고 있습니다. 중국의 데이터 현지화 요건과 일본의 운영 기술(OT) 보안에 대한 우선적인 노력은 도입 설계에 영향을 미치고 있으며, 클라우드 기반 복구 외에도 하이브리드형 및 온프레미스형 사용 사례를 촉진할 가능성이 있습니다. 아랍에미리트(UAE)와 사우디아라비아가 주도하는 중동 및 아프리카에서는 국가 비전 프로그램과 주권 클라우드에 대한 투자를 통해 복구 프로그램을 지원하는 인프라가 구축되고 있으며, 수요는 초기 단계에 있습니다. 이러한 시장에서는 정부 기관과 금융 서비스 기업이 수요를 주도하고 있는데, 이는 해당 업무 요건에서 사업 연속성과 관리된 데이터 환경이 중시되기 때문입니다.
기타 혜택:
- 엑셀 형식의 시장 예측(ME) 시트
- 3개월간의 애널리스트 지원
목차
제1장 서론
- 조사 전제조건과 시장 정의
- 조사 범위
제2장 조사 방법
제3장 개요
제4장 시장 구도
- 시장 개요
- 시장 성장 촉진요인
- 시장 성장 억제요인
- 업계 밸류체인 분석
- 거시경제 요인의 영향
- 규제 상황
- 기술 전망
- Porter's Five Forces 분석
제5장 시장 규모와 성장 예측
- 컴포넌트별
- 배포 모드별
- 회복 정도별
- 조직 규모별
- 산업 분야별
- 지역별
- 북미
- 미국
- 캐나다
- 멕시코
- 남미
- 브라질
- 아르헨티나
- 기타 남미 국가
- 유럽
- 독일
- 영국
- 프랑스
- 이탈리아
- 베네룩스
- 기타 유럽 국가
- 아시아태평양
- 중국
- 일본
- 인도
- 한국
- 호주
- 기타 아시아태평양 국가
- 중동 및 아프리카
- 중동
- 아랍에미리트
- 사우디아라비아
- 기타 중동 국가
- 아프리카
- 남아프리카공화국
- 나이지리아
- 이집트
- 기타 아프리카 국가
- 중동
- 북미
제6장 경쟁 구도
- 시장 집중도
- 전략적 동향
- 시장 점유율 분석
- 기업 개요
- Veeam Software Group GmbH
- Hewlett Packard Enterprise Company
- Commvault Systems, Inc.
- Rubrik, Inc.
- Druva Inc.
- Cohesity, Inc.
- Broadcom Inc.
- IBM Corporation
- OpenText Corporation
- Quest Software Inc.
- Semperis Inc.
- Infrascale, Inc.
- Perpetuuiti Co. Ltd.
- RackWare, Inc.
- LINBIT USA, Inc.
- CloudEndure, Inc.
- Hystax, Inc.
- Cristie Software Limited
- Cirrus Data Solutions, Inc.
- Cutover, Inc.
- Fusion Risk Management, Inc.
- Redwood Software, LLC
- Firefly Technologies, Inc.
- ControlMonkey Ltd.
- Respawn, Inc.
- Recovery Point Systems, Inc.
- Axcient, LLC
제7장 시장 기회와 향후 전망
KSAAccording to Mordor Intelligence, the recovery orchestration market size was valued at USD 1.56 billion in 2025 and estimated to grow from USD 1.78 billion in 2026 to reach USD 3.71 billion by 2031, at a CAGR of 15.82% during the forecast period (2026-2031).
Global Recovery Orchestration Market Trends and Insights
Escalating Ransomware and Cyberattack Recovery Requirements
Recovery orchestration has become closely connected with cyber defense because ransomware exposes the operational limits of traditional backup and restore processes during an active incident. Sophos surveyed 3,400 organizations across 17 countries and reported that average recovery costs, excluding ransom payments, fell 44% to USD 1.53 million in 2025. The same study found that 53% of organizations achieved full recovery within 1 week, compared with 35% in the previous year. IBM placed the average total cost of a ransomware incident at USD 5.08 million in 2025, while its 2026 report recorded a new high in breach costs amid AI-enabled attacks. Rubrik reported in 2026 that 88% of IT and security leaders were concerned about meeting current recovery time objectives, as threats were shortening the exploitation window from months to seconds. This supports demand in the recovery orchestration market for workflows that prepare isolated environments, validate data for threats, and restore business systems in sequence.
Expansion of Hybrid and Multi-Cloud Infrastructure
Hybrid and multi-cloud adoption has created recovery challenges that point backup tools cannot fully address across distributed enterprise estates. Workloads can sit across on-premises data centers, private clouds, and several cloud regions with different networking models, identity designs, and configuration management systems. A disruption in 1 layer can affect dependent layers and exceed the recovery time that a manual process can meet under a business continuity commitment. Organizations managing these estates must also address configuration drift caused by DevOps deployments, auto-scaling activity, and changes in cloud settings. Recovery plans can become outdated when data, infrastructure, and application configurations are not maintained together. The recovery orchestration market is benefiting as infrastructure-as-code recovery brings configuration versions, recovery plans, and data restoration into the same controlled process.
High Implementation Complexity Across Heterogeneous Environments
Recovery orchestration can be difficult to deploy across legacy infrastructure, containerized workloads, cloud services, and SaaS applications. Each environment adds integration work, distinct configuration requirements, and cross-team coordination, which can delay the customer's practical value. Accurate dependency mapping is central because a platform needs current topology data to sequence recovery correctly across data, applications, networks, and identities. Many large enterprises do not maintain this data at production quality across all teams and systems, especially where operating models have developed separately. Missing third-party dependencies or outdated network settings can cause a recovery sequence to fail during execution and lengthen an incident response. These issues can slow adoption in the recovery orchestration market when buyers must protect heterogeneous environments without an established map of service relationships.
Other drivers and restraints analyzed in the detailed report include:
- Regulatory Demand for Tested and Auditable Recovery
- Rising Cost of IT Downtime and Operational Disruption
- Shortage of Recovery Engineering and Cybersecurity Skills
For complete list of drivers and restraints, kindly check the Table Of Contents.
Segment Analysis
Software accounted for 58.42% of the recovery orchestration market in 2025. The position reflected enterprise demand for platform architectures that connect recovery processes with security operations workflows and that can be deployed as part of a wider resilience program. API-based software can link recovery functions with security information and event management, security orchestration, automation and response, and identity tools. This allows recovery teams to use operational signals from connected systems rather than running a separate backup administration task, while maintaining recovery policies, test results, and sequenced procedures within the same platform environment. Software also provides a consistent place to define runbooks, manage recovery policies, test recovery steps, and record test results. Services held the remaining share of the component split, while services are projected to expand at a CAGR of 19.66% through 2031, the fastest rate among components.
The service opportunity is linked to limited internal recovery engineering capacity and the practical work required to design, test, update, and operate a recovery program across changing enterprise systems. Managed cleanroom recovery and orchestration-as-a-service models can give organizations specialized support for designing, validating, and updating recovery processes. In April 2025, Commvault extended Cleanroom Recovery to managed service providers, adding AWS support alongside Azure and automated recovery of file shares. The move showed how channel delivery can broaden access without replacing software-first architectures or requiring every customer to build a dedicated recovery team. Containerized workloads, SaaS environments, and infrastructure-as-code pipelines may require implementation support, runbook automation, periodic testing, and ongoing tuning as systems evolve. These needs can make services a sustained revenue stream alongside platform subscriptions in the Recovery orchestration industry, as customers require help translating a recovery policy into operational procedures for individual workloads, critical applications, and related operating teams. The model can also support recurring validation as applications, cloud resources, network rules, and identity settings change over time, helping providers and customers keep recovery procedures aligned with the environment they are intended to protect.
Cloud-based recovery held 61.19% of the recovery orchestration market size in 2025. Cloud-based deployment is projected to expand at a CAGR of 21.23% through 2031, the highest rate across deployment modes. Its position reflects ongoing workload migration to cloud environments and the need to recover services across more than 1 region or operating setting. Elastic capacity can provide resources during a recovery event without maintaining a permanently sized secondary facility, which can be useful when the scope of disruption or recovery demand is not known in advance. Multi-region replication can support recovery planning for applications and data that are distributed across locations. Consumption-based pricing can also align recovery costs with current risk exposure, making cloud delivery a principal route for new adoption in the recovery orchestration market.
On-premises deployment remains relevant for air-gapped systems and sectors with stringent data sovereignty requirements. Its broader share can decline even when these uses remain important in regulated settings that require local control over critical data or in recovery environments. Hybrid deployment is also expanding as enterprises protect workloads across on-premises and cloud infrastructure without completing full infrastructure consolidation, allowing them to manage differing data, application, and control requirements in the same recovery program. In August 2026, AWS introduced Recovery Plans in Elastic Disaster Recovery for sequential recovery of multi-server applications and drills. Users can define dependency sequences, validate them through non-disruptive drills, and set approval checkpoints before proceeding through a planned recovery process. Providers that avoid cloud-provider lock-in can address organizations operating across several environments and seeking consistent recovery governance.
Complete Report Scope:
- By Component
- Software
- Services
- By Deployment Mode
- Cloud-Based
- On-Premises
- Hybrid
- By Recovery Extent
- Resource and Workload-Level Recovery
- Application and Business-Service Recovery
- Site and Platform Recovery
- Other Recovery Extents
- By Organization Size
- Large Enterprises
- Small and Medium-Sized Enterprises
- By Industry Vertical
- Government and Public Administration
- Industrial Manufacturing
- Retail and E-Commerce
- Transportation and Logistics
- Energy and Utilities
- Oil and Gas
- IT and Telecommunication
- Media and Entertainment
- Education and Research Institutions
- Healthcare and Life Sciences
- Banking, Financial Services, and Insurance (BFSI)
- Other Industry Verticals
- By Geography
- North America
- United States
- Canada
- Mexico
- South America
- Brazil
- Argentina
- Rest of South America
- Europe
- Germany
- United Kingdom
- France
- Italy
- BENELUX
- Rest of Europe
- Asia-Pacific
- China
- Japan
- India
- South Korea
- Australia
- Rest of Asia-Pacific
- Middle East and Africa
- Middle East
- United Arab Emirates
- Saudi Arabia
- Rest of Middle East
- Africa
- South Africa
- Nigeria
- Egypt
- Rest of Africa
- Middle East
- North America
Geography Analysis
North America held 42.71% of the recovery orchestration market share in 2025. The United States was the main contributor because ransomware has targeted critical infrastructure across healthcare, energy, financial services, and government agencies. SEC disclosure rules make documented recovery time objectives and audit trails relevant to legal teams, boards, and IT operations. Canada adds demand through public-sector resilience programs and financial services adoption. Mexico's technology and manufacturing sectors constitute an emerging demand base, in which greater digitalization can increase the need for structured recovery processes.
North America has the most developed competitive ecosystem, including tier-1 supplier headquarters and specialists in identity recovery, infrastructure-as-code restoration, and runbook automation. This supplier base can create pressure on pricing, product development, and the scope of functions that enterprise buyers expect from their providers, including integration with security systems, identity services, and infrastructure management tools. Europe is shaped by the combined effect of DORA and NIS2 across financial services, energy, telecommunications, and critical infrastructure. Germany, the United Kingdom, France, Italy, and the BENELUX countries represent major European markets in enterprise IT spending. Financial services firms subject to DORA Articles 11 and 12 face particularly detailed testing and documentation obligations, which affect technology procurement and recovery governance. South America, led by Brazil and Argentina, has early-stage demand shaped by cybersecurity frameworks and financial-sector digitization, although limited local expertise and uneven IT governance can constrain adoption.
Asia-Pacific is projected to expand at a CAGR of 21.49% through 2031. The growth is linked to cloud adoption in India, China, Japan, and South Korea, and to increasing cyber threats affecting financial institutions, telecommunications providers, and public agencies that depend on the continuous availability of critical digital services. India's digital infrastructure expansion and attacks on public-sector institutions have elevated resilience in enterprise and government planning. China's data localization requirements and Japan's operational technology security priorities are influencing deployment design and can favor hybrid and on-premises use cases alongside cloud recovery. The Middle East and Africa, led by the UAE and Saudi Arabia, are seeing early-stage demand as national Vision programs and sovereign cloud investments build the supporting infrastructure for recovery programs. Government and financial services organizations are leading demand in these markets as their operating requirements place a high value on continuity and controlled data environments.
- Veeam Software Group GmbH
- Hewlett Packard Enterprise Company
- Commvault Systems, Inc.
- Rubrik, Inc.
- Druva Inc.
- Cohesity, Inc.
- Broadcom Inc.
- IBM Corporation
- OpenText Corporation
- Quest Software Inc.
- Semperis Inc.
- Infrascale, Inc.
- Perpetuuiti Co. Ltd.
- RackWare, Inc.
- LINBIT USA, Inc.
- CloudEndure, Inc.
- Hystax, Inc.
- Cristie Software Limited
- Cirrus Data Solutions, Inc.
- Cutover, Inc.
- Fusion Risk Management, Inc.
- Redwood Software, LLC
- Firefly Technologies, Inc.
- ControlMonkey Ltd.
- Respawn, Inc.
- Recovery Point Systems, Inc.
- Axcient, LLC
Additional Benefits:
- The market estimate (ME) sheet in Excel format
- 3 months of analyst support
TABLE OF CONTENTS
1 INTRODUCTION
- 1.1 Study Assumptions and Market Definition
- 1.2 Scope of the Study
2 RESEARCH METHODOLOGY
3 EXECUTIVE SUMMARY
4 MARKET LANDSCAPE
- 4.1 Market Overview
- 4.2 Market Drivers
- 4.2.1 Escalating Ransomware and Cyberattack Recovery Requirements
- 4.2.2 Expansion of Hybrid and Multi-Cloud Infrastructure
- 4.2.3 Regulatory Demand for Tested and Auditable Recovery
- 4.2.4 Rising Cost of IT Downtime and Operational Disruption
- 4.2.5 Recovery Drift From Continuous Cloud Configuration Changes
- 4.2.6 Dependency-Aware Recovery for Cascading Third-Party Failures
- 4.3 Market Restraints
- 4.3.1 High Implementation Complexity Across Heterogeneous Environments
- 4.3.2 Shortage of Recovery Engineering and Cybersecurity Skills
- 4.3.3 Incomplete Dependency Mapping and Recovery Data Quality
- 4.3.4 Conflicting Data Residency, Immutability, and Recovery Requirements
- 4.4 Industry Value-Chain Analysis
- 4.5 Impact of Macroeconomic Factors
- 4.6 Regulatory Landscape
- 4.6.1 Digital Operational Resilience Act Requirements
- 4.6.2 NIS2 Business Continuity and Incident Recovery Requirements
- 4.6.3 SEC Cybersecurity Disclosure Expectations
- 4.6.4 Critical Infrastructure and Sector-Specific Requirements
- 4.7 Technological Outlook
- 4.7.1 Continuous Data Protection and Journal-Based Recovery
- 4.7.2 Infrastructure-as-Code Recovery
- 4.7.3 Cleanroom and Isolated Recovery Environments
- 4.7.4 Artificial Intelligence-Assisted Recovery Validation
- 4.7.5 Dependency Graphs and Recovery Sequence Optimization
- 4.7.6 Configuration-as-Code and Recovery Posture Management
- 4.8 Porter's Five Forces Analysis
- 4.8.1 Threat of Substitutes
- 4.8.2 Bargaining Power of Buyers
- 4.8.3 Bargaining Power of Suppliers
- 4.8.4 Threat of New Entrants
- 4.8.5 Competitive Rivalry
5 MARKET SIZE AND GROWTH FORECASTS (VALUE)
- 5.1 By Component
- 5.1.1 Software
- 5.1.2 Services
- 5.2 By Deployment Mode
- 5.2.1 Cloud-Based
- 5.2.2 On-Premises
- 5.2.3 Hybrid
- 5.3 By Recovery Extent
- 5.3.1 Resource and Workload-Level Recovery
- 5.3.2 Application and Business-Service Recovery
- 5.3.3 Site and Platform Recovery
- 5.3.4 Other Recovery Extents
- 5.4 By Organization Size
- 5.4.1 Large Enterprises
- 5.4.2 Small and Medium-Sized Enterprises
- 5.5 By Industry Vertical
- 5.5.1 Government and Public Administration
- 5.5.2 Industrial Manufacturing
- 5.5.3 Retail and E-Commerce
- 5.5.4 Transportation and Logistics
- 5.5.5 Energy and Utilities
- 5.5.6 Oil and Gas
- 5.5.7 IT and Telecommunication
- 5.5.8 Media and Entertainment
- 5.5.9 Education and Research Institutions
- 5.5.10 Healthcare and Life Sciences
- 5.5.11 Banking, Financial Services, and Insurance (BFSI)
- 5.5.12 Other Industry Verticals
- 5.6 By Geography
- 5.6.1 North America
- 5.6.1.1 United States
- 5.6.1.2 Canada
- 5.6.1.3 Mexico
- 5.6.2 South America
- 5.6.2.1 Brazil
- 5.6.2.2 Argentina
- 5.6.2.3 Rest of South America
- 5.6.3 Europe
- 5.6.3.1 Germany
- 5.6.3.2 United Kingdom
- 5.6.3.3 France
- 5.6.3.4 Italy
- 5.6.3.5 BENELUX
- 5.6.3.6 Rest of Europe
- 5.6.4 Asia-Pacific
- 5.6.4.1 China
- 5.6.4.2 Japan
- 5.6.4.3 India
- 5.6.4.4 South Korea
- 5.6.4.5 Australia
- 5.6.4.6 Rest of Asia-Pacific
- 5.6.5 Middle East and Africa
- 5.6.5.1 Middle East
- 5.6.5.1.1 United Arab Emirates
- 5.6.5.1.2 Saudi Arabia
- 5.6.5.1.3 Rest of Middle East
- 5.6.5.2 Africa
- 5.6.5.2.1 South Africa
- 5.6.5.2.2 Nigeria
- 5.6.5.2.3 Egypt
- 5.6.5.2.4 Rest of Africa
- 5.6.5.1 Middle East
- 5.6.1 North America
6 COMPETITIVE LANDSCAPE
- 6.1 Market Concentration
- 6.2 Strategic Moves
- 6.3 Market Share Analysis
- 6.4 Company Profiles (includes Global Level Overview, Market Level Overview, Core Segments, Financials as available, Strategic Information, Market Rank/Share, Products and Services, Recent Developments)
- 6.4.1 Veeam Software Group GmbH
- 6.4.2 Hewlett Packard Enterprise Company
- 6.4.3 Commvault Systems, Inc.
- 6.4.4 Rubrik, Inc.
- 6.4.5 Druva Inc.
- 6.4.6 Cohesity, Inc.
- 6.4.7 Broadcom Inc.
- 6.4.8 IBM Corporation
- 6.4.9 OpenText Corporation
- 6.4.10 Quest Software Inc.
- 6.4.11 Semperis Inc.
- 6.4.12 Infrascale, Inc.
- 6.4.13 Perpetuuiti Co. Ltd.
- 6.4.14 RackWare, Inc.
- 6.4.15 LINBIT USA, Inc.
- 6.4.16 CloudEndure, Inc.
- 6.4.17 Hystax, Inc.
- 6.4.18 Cristie Software Limited
- 6.4.19 Cirrus Data Solutions, Inc.
- 6.4.20 Cutover, Inc.
- 6.4.21 Fusion Risk Management, Inc.
- 6.4.22 Redwood Software, LLC
- 6.4.23 Firefly Technologies, Inc.
- 6.4.24 ControlMonkey Ltd.
- 6.4.25 Respawn, Inc.
- 6.4.26 Recovery Point Systems, Inc.
- 6.4.27 Axcient, LLC
7 MARKET OPPORTUNITIES AND FUTURE OUTLOOK
- 7.1 White-Space and Unmet-Need Assessment


