

|
시장보고서
상품코드
2157072
인도네시아의 해상 화물 운송 : 시장 점유율 분석, 업계 동향과 통계, 성장 예측(2026-2031년)Indonesia Ocean Freight Transport - Market Share Analysis, Industry Trends & Statistics, Growth Forecasts (2026 - 2031) |
||||||
 Mordor Intelligence
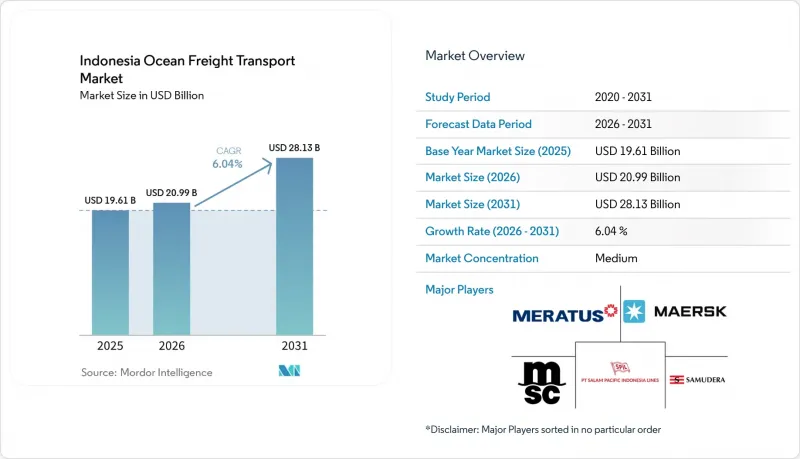
에 따르면 인도네시아의 해상 화물 운송 시장 규모는 2025년에 196억 1,000만 달러로 평가되며, 2026년 209억 9,000만 달러에서 2031년까지 281억 3,000만 달러에 달할 것으로 예측되고 있으며, 예측 기간(2026-2031년)에 CAGR은 6.04%에 달할 전망입니다.
인도네시아 해상 화물 운송 시장의 동향 및 인사이트
국내 및 국제 컨테이너 무역의 성장
2026년 상반기, 페린드가 관리하는 터미널의 국제 컨테이너 처리량은 9.13% 증가했으며, 수입량은 11.67% 증가했습니다. 이러한 증가는 소비자의 재고 보충이 아닌, 제조업과 관련된 자본재 수요에 의해 주도되고 있습니다. 원자재와 자본재는 인도네시아 수입의 78%를 차지하고 있으며, 이는 산업 활동과 컨테이너 수입 수요 간의 직접적인 연관성을 지원합니다. 제조업체는 생산 과정에서 수입된 투입 자재와 설비를 사용하므로 해당 화물 수요는 단기적인 가계 수요에 대한 의존도가 낮습니다. 2026년 1월부터 4월까지 인도네시아의 수출액은 전년 동기 대비 5.48% 증가한 921억 5,000만 달러에 달했습니다. 수출 활동의 활성화는 수출용 컨테이너 수요를 지원할 뿐만 아니라, 자바 섬을 중심으로 한 항로에서 선박의 가동률 향상에도 기여합니다. 물류 흐름이 더욱 균형을 이루게 됨에 따라 해운사는 설비를 양방향으로 활용할 수 있게 되어 빈 컨테이너 배치 비용을 절감할 수 있습니다. 무역 기반이 국내 공급 수요와 수출 동향을 결합하고 있으므로 이러한 상황은 인도네시아의 해상 화물 운송 시장을 지원하고 있습니다.
항만의 현대화와 네트워크 확대
탄중 프리옥 제2 컨테이너 터미널은 2026년 8월에 가동을 시작하며, 517.5미터의 부두와 9만 8,700제곱미터의 야드를 갖추고 있습니다. 이 추가 용량 덕분에 수출입 화물의 증가에 따라 자카르타의 컨테이너 화물 처리 능력이 향상될 것입니다. 또한 인도네시아 컨테이너 무역의 대부분을 처리하는 이 관문에서 해운사들은 더 많은 부두 및 야드 용량을 확보할 수 있게 됩니다. 페린드(Perind)사는 2025-2026년에 74곳의 시설을 개보수했으며, PINP 프로그램을 통해 최대 20개의 새로운 섬 간 항로 개설을 목표로 했습니다. 이러한 노력으로 인해 초점은 개별 터미널의 업그레이드에서 전국적인 항만 네트워크를 통한 화물 이동으로 전환되고 있습니다. 자바 섬의 관문에서 처리 능력이 강화됨에 따라 술라웨시, 파푸아 및 기타 동부 지역의 2차 항만에 대한 피더 수요가 증가할 가능성이 있습니다. 컨테이너가 대형 허브 터미널을 경유하여 도착하거나 최종 목적지가 자바 섬 외부에 있는 경우, 신뢰할 수 있는 2차 연결 노선이 필수적입니다. 대규모 허브에서는 소규모 항구와의 더 정기적인 서비스가 필요하므로 이러한 연결은 인도네시아 해상 화물 운송 시장의 성장을 지원하게 될 것입니다.
연료 가격 변동 및 벙커 비용의 위험
인도네시아의 섬 간 근해 항로에서 벙커 비용은 영업 비용의 45%에서 55%를 차지합니다. 이 위험은 원양 항로보다 크며, 운임을 인상할 여지가 제한적인 운항 사업자에게는 가장 큰 과제가 되고 있습니다. 소규모 섬들을 연결하는 항로에서는 화물 물동량이 불안정한 경우가 많기 때문에 운항 사업자가 반드시 만선 상태의 귀항 화물 적재를 통해 급등한 연료비를 회수할 수 있는 것은 아닙니다. PT IMC Pelita Logistik사는 연료 가격 변동을 2026년 1분기 주요 과제로 파악하고, 항해 최적화를 활용하여 비용 절감을 도모했습니다. PT TEMAS사는 2026년 8월부터 수라바야·켄다리·골롱탈로 항로에서 LNG 추진선 ‘MV Digul Mas’의 운항을 시작했습니다. 이 선박은 연료 가격 변동 위험을 줄이는 접근 방식의 한 예라고 할 수 있지만, 선단을 전환하기 위해서는 소규모 운항사가 확보하기 어려운 자본이 필요합니다. 또한 국제 해운사들도 듀얼 연료(이원 연료) 옵션을 통해 IMO(국제해사기구)의 탄소 강도 지표 준수를 목표로 하고 있습니다.
부문별 분석
2025년, 인도네시아 해상 화물 운송 시장에서 비컨테이너 화물은 57.86%의 점유율을 차지하고 있으며, 이는 개별 유닛 로드가 아닌 대량으로 운송되는 원자재 화물의 중요성이 여전히 높음을 반영합니다. 한편, 컨테이너 화물은 2031년까지 연평균 성장률(CAGR) 7.89%로 확대될 것으로 예측되며, 인도네시아 해상 화물 운송 시장에서 가장 빠르게 성장하는 화물 카테고리가 될 전망입니다. 건화물 부문에서는 석탄과 광물이, 액체화물 부문에서는 원유, LPG, 팜유가, 일반화물 부문에서는 표준 컨테이너에 들어가지 않는 화물이 취급되었습니다. 이러한 화물 흐름은 생산 거점이나 가공 시설이 연안 항로에 의존하고 있는 칼리만탄, 술라웨시, 수마트라와 밀접한 관련이 있습니다. 많은 수출이 대량의 벌크 상품 운송에 의존하고 있으며, 화물의 물리적 특성에 맞는 선박 유형이 필요하므로 이 부문은 여전히 중요한 위치를 차지하고 있습니다. PT 페르타미나 인터내셔널 쉬핑은 2025년에 111척의 선박을 운용하며, LNG 운송 빈도를 전년 대비 5.5배로 늘렸습니다. 이 회사의 선단 활동은 인도네시아 해상 화물 운송 시장에서 액체 벌크 화물의 역할이 확대되고 있으며, 섬들 간의 정기적인 에너지 공급이 필요함을 보여줍니다. 또한 브레이크벌크 화물은 모로와리의 니켈 제련소 건설과 인도네시아 동부의 전력 인프라 구축을 지원하고 있으며, 이러한 프로젝트 자재는 대부분의 경우 표준 컨테이너 서비스로는 운송할 수 없습니다.
E-Commerce 재고 보충, 의약품 유통, 전자기기 수입으로 인해 시간 엄수가 요구되는 화물에 대한 정기적인 배송 패턴을 지원하는 정기 항로 서비스로의 화물 전환이 진행되고 있습니다. 이러한 변화로 인해 화주들은 스팟 용선 방식의 일반 화물 운송보다 예측 가능한 서비스를 이용할 수 있게 되었으며, 기항 일정을 물류 일정과 보다 적절하게 조정할 수 있게 되었습니다. 의약품 유통에서는 항구 도착부터 내륙 배송에 이르기까지 더욱 엄격한 온도 관리가 요구되므로, 냉장 컨테이너의 중요성이 높아지고 있습니다. 생물제제에 대한 BPOM의 온도 기록 요건으로 인해 컨테이너 화물내 전용 냉장 컨테이너의 사용이 촉진되고 있습니다. 또한 기존 연료비가 서비스의 수익성을 압박하던 항로에서는 운항 사업자가 컨테이너 운송 능력과 연료비 대책을 결합하고 있습니다. 수라바야·켄다리·골롱타로 항로를 운항하는 TEMAS사의 MV 디굴 마스호는 운항 비용을 감당하면서도 화물 수요에 부응하는 이러한 접근 방식을 구현하고 있습니다. 이러한 화물의 전환으로 인해 인도네시아 해상 화물 운송 시장은 벌크 화물의 중요한 역할을 유지하면서도 더욱 견고한 컨테이너 운송 기반을 구축하고 있습니다.
기타 혜택:
- 엑셀 형식의 시장 예측(ME) 시트
- 3개월간의 애널리스트 지원
자주 묻는 질문
목차
제1장 서론
- 조사 전제조건과 시장 정의
- 조사 범위
제2장 조사 방법
제3장 개요
- 시장 규모, 성장률 및 예측
- 주요 수요 요인과 해상 운송의 동향
- 주요 해상 무역 회랑과 화물 집중
- 경쟁 구도와 주요 해상 화물 운송 사업자
제4장 시장 구도
- 시장 개요와 해상 운송의 중요성
- 시장 성장 촉진요인
- 시장 성장 억제요인
- 밸류체인 구조와 해상 화물 유동의 분석
- 해상 화물 운송 업무에 관한 규제 프레임워크
- 항만 및 해운 업무에서 기술의 도입
- 항만 취급량 및 컨테이너 운송량의 동향
- 주요 항만 및 해상 게이트웨이 퍼포먼스 평가
- 해상 운임과 운송 비용의 동향
- 연료비 및 선박 운항비의 동향
- Porter's Five Forces 분석
- 지정학적 이벤트가 공급망의 변화에 미치는 영향
제5장 시장 규모와 성장 예측
- 화물 유형별
- 최종사용자 산업별
- 지역별
- Java(자카르타 및 BOD)
- 수마트라
- 보르네오
- 술라웨시
- 발리 및 누사 텡가라
- 파푸아 지역 및 말루쿠 제도
제6장 경쟁 구도
- 시장 집중도
- 전략적 동향
- 시장 점유율 분석
- 기업 개요
- Mediterranean Shipping Company(MSC)
- A.P. Moller-Maersk
- CMA CGM
- COSCO SHIPPING Lines
- Ocean Network Express(ONE)
- Hapag-Lloyd
- ZIM Integrated Shipping Services
- Pacific International Lines(PIL)
- Meratus
- PT Salam Pacific Indonesia Lines(SPIL)
- PT TEMAS Tbk
- PT Samudera Indonesia Tbk
- PT Tanto Intim Line
- PT Pertamina International Shipping
- PT Pelayaran Nasional Indonesia(PELNI)
- Evergreen Marine Corporation(Evergreen Line)
- PT Soechi Lines Tbk
- PT Humpuss Maritim Internasional Tbk
- PT IMC Pelita Logistik Tbk
- PT Transcoal Pacific Tbk
- PT Habco Trans Maritima Tbk
- PT Berlian Laju Tanker Tbk
제7장 시장 기회와 향후 전망
제8장 부록
KSA 26.10.30According to Mordor Intelligence, the Indonesia ocean freight transport market size was valued at USD 19.61 billion in 2025, and is estimated to grow from USD 20.99 billion in 2026 to reach USD 28.13 billion by 2031, at a CAGR of 6.04% during the forecast period (2026-2031).
Indonesia Ocean Freight Transport Market Trends and Insights
Growth in Domestic and International Containerized Trade
International container throughput at Pelindo-managed terminals rose 9.13% in the first half of 2026, and imports increased 11.67%. This increase is driven by capital-goods demand connected to manufacturing rather than consumer restocking. Raw materials and capital goods accounted for 78% of Indonesia's imports, which supported a direct link between industrial activity and inbound container demand. Manufacturers use imported inputs and equipment in production, so their freight requirements are less dependent on short-term household demand. Indonesia's exports reached USD 92.15 billion in January through April 2026, up 5.48% year over year. Higher export activity also supports outbound container demand and can improve vessel use on Java-centered routes. More balanced flows help carriers use equipment for both directions and reduce the cost of positioning empty containers. These conditions support the Indonesia ocean freight transport market because the trade base combines domestic supply needs with export movements.
Port Modernization and Network Expansion
Tanjung Priok Terminal 2 Petikemas began operations in August 2026 with a 517.5-meter berth and a 98,700 square-meter yard. This additional capacity raises Jakarta's ability to handle container flows as import and export traffic grows. It also gives carriers more berth and yard capacity at a gateway that handles a large share of the country's container trade. Pelindo rehabilitated facilities at 74 locations during 2025-2026, while its PINP program targeted up to 20 new inter-island routes. These actions move the focus from individual terminal upgrades to the movement of cargo through the national port network. Capacity added at Java gateways can increase feeder demand for secondary ports in Sulawesi, Papua, and other eastern areas. Reliable secondary links are necessary when containers arrive through large hub terminals but have final destinations outside Java. This connection supports growth in the Indonesia ocean freight transport market because larger hubs require more regular services with smaller ports.
Fuel-Price Volatility and Bunker-Cost Exposure
Bunker costs represented 45% to 55% of operating expenses on Indonesia's short-sea inter-island routes. This exposure is greater than on deep-sea trades and is most difficult for operators with limited ability to raise freight rates. Routes serving smaller islands often have uneven cargo flows, so operators cannot always recover higher fuel costs through a full return load. PT IMC Pelita Logistik identified fuel-price volatility as a principal first-quarter 2026 challenge and used voyage optimization to contain costs. PT TEMAS began operating the LNG-powered MV Digul Mas in August 2026 on the Surabaya-Kendari-Gorontalo route. The vessel provides an example of a lower-volatility fuel approach, although fleet conversion requires capital that smaller operators may not have. International carriers are also working toward IMO Carbon Intensity Indicator compliance through dual-fuel options.
Other drivers and restraints analyzed in the detailed report include:
- Resource Downstreaming and Bulk-Cargo Export Demand
- E-commerce, Retail Replenishment, and Consumer-Goods Imports
- Hinterland Connectivity Gaps and High Inter-Island Logistics Costs
For complete list of drivers and restraints, kindly check the Table Of Contents.
Segment Analysis
Non-containerized cargo held 57.86% of the Indonesia ocean freight transport market share in 2025, reflecting the continued importance of commodity freight that moves in large volumes rather than through individual unit loads, while containerized cargo is projected to expand at a 7.89% CAGR through 2031, making it the fastest-growing cargo category within the Indonesia ocean freight transport market. Dry bulk handled coal and minerals, liquid bulk moved crude petroleum, LPG, and palm oil, and breakbulk supported cargo that does not fit standard containers. These freight flows are closely tied to Kalimantan, Sulawesi, and Sumatra, where production sites and processing facilities depend on coastal shipping links. The segment remains important because many exports depend on large-volume commodity movements and because cargoes require vessel types matched to their physical characteristics. PT Pertamina International Shipping managed 111 vessels in 2025 and increased LNG shipment frequency 5.5 times year over year. Its fleet activity illustrates the growing role of liquid bulk in the Indonesia ocean freight transport market and the need for regular energy distribution between islands. Breakbulk also supports nickel smelter construction in Morowali and power infrastructure work in eastern Indonesia, where project materials often cannot move in standard container services.
E-commerce replenishment, pharmaceutical distribution, and electronics imports are moving more freight toward scheduled liner services, which support regular delivery patterns for time-sensitive goods. This shift gives shippers more predictable service than spot-chartered general cargo and better aligns port calls with distribution schedules. Reefer containers are gaining importance as pharmaceutical distribution requires more temperature-controlled handling from port arrival through inland delivery. BPOM temperature-logging requirements for biologics are encouraging dedicated reefer use within containerized freight. Operators are also combining container capacity with fuel-cost measures on routes where conventional fuel costs had weakened service economics. TEMAS's MV Digul Mas on the Surabaya-Kendari-Gorontalo route reflects this approach to serving cargo demand while addressing operating costs. The cargo transition gives the Indonesia ocean freight transport market a stronger container base while retaining a large bulk freight role.
Complete Report Scope:
- By Cargo Type
- Containerized Cargo
- Dry
- Reefer
- Non-Containerized Cargo
- Dry Bulk Cargo
- Liquid Bulk Cargo
- Breakbulk and General Cargo
- Containerized Cargo
- By End-User Industry
- Electronics and Semiconductors
- Chemicals and Petrochemicals
- Food and Beverage
- Pharmaceuticals and Healthcare
- Retail and E-commerce
- Others
- By Region
- Java (Jakarta and BOD)
- Sumatra
- Kalimantan
- Sulawesi
- Bali and Nusa Tenggara
- Papua Region and Maluku Islands
List of Companies Covered in this Report:
- Mediterranean Shipping Company (MSC)
- A.P. Moller - Maersk
- CMA CGM
- COSCO SHIPPING Lines
- Ocean Network Express (ONE)
- Hapag-Lloyd
- ZIM Integrated Shipping Services
- Pacific International Lines (PIL)
- Meratus
- PT Salam Pacific Indonesia Lines (SPIL)
- PT TEMAS Tbk
- PT Samudera Indonesia Tbk
- PT Tanto Intim Line
- PT Pertamina International Shipping
- PT Pelayaran Nasional Indonesia (PELNI)
- Evergreen Marine Corporation (Evergreen Line)
- PT Soechi Lines Tbk
- PT Humpuss Maritim Internasional Tbk
- PT IMC Pelita Logistik Tbk
- PT Transcoal Pacific Tbk
- PT Habco Trans Maritima Tbk
- PT Berlian Laju Tanker Tbk
Additional Benefits:
- The market estimate (ME) sheet in Excel format
- 3 months of analyst support
TABLE OF CONTENTS
1 INTRODUCTION
- 1.1 Study Assumptions and Market Definition
- 1.2 Scope of the Study
2 RESEARCH METHODOLOGY
3 EXECUTIVE SUMMARY
- 3.1 Market Size, Growth, and Forecast Outlook
- 3.2 Key Demand Drivers and Ocean Freight Trends
- 3.3 Major Maritime Trade Corridors and Cargo Concentration
- 3.4 Competitive Landscape and Leading Ocean Freight Providers
4 MARKET LANDSCAPE
- 4.1 Market Overview and Importance of Ocean Freight Transport
- 4.2 Market Drivers
- 4.2.1 Growth in Domestic and International Containerized Trade
- 4.2.2 Port Modernization and Network Expansion
- 4.2.3 Resource Downstreaming and Bulk-Cargo Export Demand
- 4.2.4 E-commerce, Retail Replenishment and Consumer-Goods Imports
- 4.2.5 Eastern Indonesia Route Consolidation and Feeder-Network Formalization
- 4.2.6 Digital Cargo Visibility and Data-Driven Container Repositioning
- 4.3 Market Restraints
- 4.3.1 Fuel-Price Volatility and Bunker-Cost Exposure
- 4.3.2 Hinterland Connectivity Gaps and High Inter-Island Logistics Costs
- 4.3.3 Stricter Cabotage and Foreign-Investment Requirements
- 4.3.4 Empty-Container Imbalances Across Indonesia's Island Corridors
- 4.4 Value Chain Structure and Maritime Cargo Flow Analysis
- 4.5 Regulatory Framework for Ocean Freight Operations
- 4.6 Technology Adoption in Port and Shipping Operations
- 4.7 Port Throughput and Container Traffic Development Trends
- 4.8 Major Ports and Maritime Gateway Performance Assessment
- 4.9 Ocean Freight Rates and Shipping Cost Dynamics
- 4.10 Fuel Costs and Vessel Operating Expense Trends
- 4.11 Porter's Five Forces Analysis
- 4.11.1 Threat of New Entrants
- 4.11.2 Bargaining Power of Buyers and Consumers
- 4.11.3 Bargaining Power of Suppliers
- 4.11.4 Threat of Substitute Services
- 4.11.5 Intensity of Competitive Rivalry
- 4.12 Impact of Geo-Political Events on Supply Chain Shifts
5 MARKET SIZE AND GROWTH FORECASTS
- 5.1 By Cargo Type
- 5.1.1 Containerized Cargo
- 5.1.1.1 Dry
- 5.1.1.2 Reefer
- 5.1.2 Non-Containerized Cargo
- 5.1.2.1 Dry Bulk Cargo
- 5.1.2.2 Liquid Bulk Cargo
- 5.1.2.3 Breakbulk and General Cargo
- 5.1.1 Containerized Cargo
- 5.2 By End-User Industry
- 5.2.1 Electronics and Semiconductors
- 5.2.2 Chemicals and Petrochemicals
- 5.2.3 Food and Beverage
- 5.2.4 Pharmaceuticals and Healthcare
- 5.2.5 Retail and E-commerce
- 5.2.6 Others
- 5.3 By Region
- 5.3.1 Java (Jakarta and BOD)
- 5.3.2 Sumatra
- 5.3.3 Kalimantan
- 5.3.4 Sulawesi
- 5.3.5 Bali and Nusa Tenggara
- 5.3.6 Papua Region and Maluku Islands
6 COMPETITIVE LANDSCAPE
- 6.1 Market Concentration
- 6.2 Strategic Moves
- 6.3 Market Share Analysis
- 6.4 Company Profiles (includes Global Level Overview, Market Level Overview, Core Segments, Financials as available, Strategic Information, Geographic Coverage, Products and Services, Recent Developments)
- 6.4.1 Mediterranean Shipping Company (MSC)
- 6.4.2 A.P. Moller - Maersk
- 6.4.3 CMA CGM
- 6.4.4 COSCO SHIPPING Lines
- 6.4.5 Ocean Network Express (ONE)
- 6.4.6 Hapag-Lloyd
- 6.4.7 ZIM Integrated Shipping Services
- 6.4.8 Pacific International Lines (PIL)
- 6.4.9 Meratus
- 6.4.10 PT Salam Pacific Indonesia Lines (SPIL)
- 6.4.11 PT TEMAS Tbk
- 6.4.12 PT Samudera Indonesia Tbk
- 6.4.13 PT Tanto Intim Line
- 6.4.14 PT Pertamina International Shipping
- 6.4.15 PT Pelayaran Nasional Indonesia (PELNI)
- 6.4.16 Evergreen Marine Corporation (Evergreen Line)
- 6.4.17 PT Soechi Lines Tbk
- 6.4.18 PT Humpuss Maritim Internasional Tbk
- 6.4.19 PT IMC Pelita Logistik Tbk
- 6.4.20 PT Transcoal Pacific Tbk
- 6.4.21 PT Habco Trans Maritima Tbk
- 6.4.22 PT Berlian Laju Tanker Tbk
7 MARKET OPPORTUNITIES AND FUTURE OUTLOOK
- 7.1 White-Space Opportunities and Unmet Maritime Logistics Needs
- 7.2 High-Potential Cargo Segments and Regional Growth Opportunities
- 7.3 Strategic Growth Priorities Across Ocean Freight Ecosystem
- 7.4 Future Market Outlook and Emerging Trade Demand Pockets


