|
시장보고서
상품코드
1755309
식품 안전 모니터링 시스템 시장 : 기회, 성장 촉진요인, 산업 동향 분석 및 예측(2025-2034년)Food Safety Monitoring Systems Market Opportunity, Growth Drivers, Industry Trend Analysis, and Forecast 2025 - 2034 |
||||||
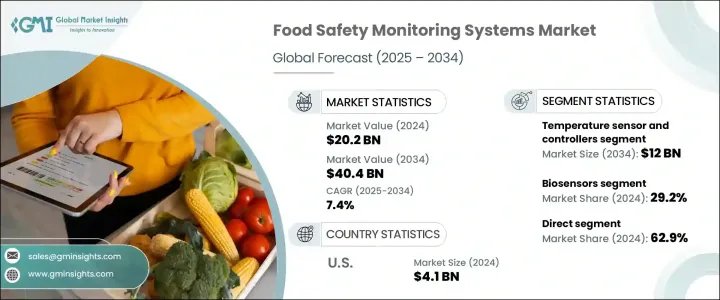
세계의 식품 안전 모니터링 시스템 시장은 2024년에는 202억 달러로 평가되었으며 2034년에는 404억 달러에 이를 것으로 추정되며, CAGR 7.4%로 성장할 전망입니다.
국제 식품 무역이 더욱 상호 연결되어 감에 따라 일관된 안전과 품질을 유지하는 것이 점점 더 중요한 과제가 되고 있습니다. 식품이 소비자에게 도달하기 전에 여러 국가를 거쳐 이동하는 경우가 많아지면서 지능형 모니터링 시스템에 대한 수요가 급증했습니다. 이러한 시스템은 자동화된 데이터 수집, 실시간 모니터링, 예측 분석 등 기능을 제공하여 원료부터 제품 진열대까지의 전체 과정에 걸친 안전성을 보장합니다.

국제 식품 법규 및 규제 프레임워크 준수 는 이제 최우선 과제이며, 기업들은 EU 일반 식품법(EU General Food Law)과 미국 식품 안전 현대화법(Food Safety Modernization Act) 등 요구사항을 충족시키는 솔루션을 도입하고 있습니다. 규제 기준 충족 외에도 이러한 시스템은 제품 리콜이나 준수 위반으로 인한 재정적 위험을 줄이고 브랜드 신뢰성을 보호하는 데 핵심적인 역할을 합니다.
| 시장 범위 | |
|---|---|
| 시작 연도 | 2024년 |
| 예측 연도 | 2025-2034년 |
| 시작 금액 | 202억 달러 |
| 예측 금액 | 404억 달러 |
| CAGR | 7.4% |
2024년에 온도 센서 및 컨트롤러 부문은 68억 달러의 매출을 올렸으며, 2034년에는 120억 달러로 성장할 것으로 예상됩니다. 이러한 도구는 공급망의 여러 단계에서 미생물 위험을 최소화하고 부패하기 쉬운 상품의 품질을 유지하는 데 도움이 되기 때문에 식품 안전 모니터링에 필수적입니다. 이들의 적용 범위는 가공, 운송, 냉동 보관, 소매 운영에 이릅니다. 대규모 제조 시설이나 소규모 시설 모두에서 이 시스템은 다양한 운영 요구사항에 맞는 신뢰성 있고 확장 가능하며 통합된 솔루션을 제공합니다.
직접 유통 채널은 2024년 62.9%의 상당한 시장 점유율을 차지했으며, 2025년부터 2034년까지 연평균 성장률(CAGR) 7.3%로 성장할 것으로 예상됩니다. 직접 채널은 식품 안전 모니터링 시스템 공급업체가 최종 사용자와 밀접하게 협력할 수 있도록 하여 맞춤형 기술, 신속한 지원, 연장된 서비스 계약을 제공하는 기회를 창출합니다. 이러한 직접적인 관계는 시스템 공급업체가 제조 및 가공 산업의 고객과 장기적인 파트너십을 구축하며 독특한 운영 요구사항을 충족시킬 수 있도록 돕습니다.
미국의 식품 안전 모니터링 시스템 시장은 2024년에 41억 달러를 기록했으며, 2034년까지 연평균 성장률(CAGR) 7%로 성장할 것으로 예상됩니다. 미국은 강력한 규제 환경과 첨단 식품 생산의 미래로 전 세계를 선도하고 있습니다. 식품 안전을 담당하는 기관은 업계의 추적 가능성 및 규정 준수를 보장하는 규정을 엄격하게 시행하고 있습니다. 식품의 품질과 안전에 대한 소비자의 높은 기대, 빈번한 규제 감사, IoT 지원 센서 및 AI 기반 분석 등 최신 기술의 광범위한 채택이 이 지역의 강력한 시장 성장에 주요 요인으로 작용하고 있습니다.
식품 안전 모니터링 시스템 시장을 선도하는 주요 기업은 Honeywell International Inc., Shimadzu Corporation, Bio-Rad Laboratories, Inc., ABB Ltd., Rockwell Automation, Inc., Mettler-Toledo International Inc., 3M Company, General Electric(GE), Siemens AG, Thermo Fisher Scientific Inc. Corporation, Emerson Electric Co., Agilent Technologies, Inc.등이 있습니다. 식품 안전 모니터링 시스템 분야 기업들은 시장 지위를 강화하기 위해 다양한 전략적 이니셔티브를 추진하고 있습니다. 많은 기업들이 시스템 정확도, 통합성, 자동화를 향상시키기 위해 연구개발(R&D)에 대규모 투자를 진행하고 있습니다. 다른 기업들은 공급망의 다양한 단계에서 원활한 모니터링을 제공하기 위해 소프트웨어와 하드웨어의 상호운용성에 집중하고 있습니다. 식품 제조업체 및 가공업체와의 전략적 파트너십은 채택률을 높이는 데 기여하며, 지역 확장 노력은 개발도상국 시장의 성장하는 수요를 충족시키기 위해 진행되고 있습니다.
목차
제1장 조사 방법과 범위
제2장 주요 요약
제3장 업계 인사이트
- 생태계 분석
- 밸류체인에 영향을 주는 요인
- 이익률 분석
- 혁신
- 장래의 전망
- 제조업자
- 리셀러
- 소매업체
- 트럼프 정권의 관세 분석
- 무역에 미치는 영향
- 무역량의 혼란
- 보복 조치
- 업계에 미치는 영향
- 공급측의 영향(원재료)
- 주요 원재료의 가격 변동
- 공급망 재구성
- 생산 비용에 미치는 영향
- 수요측의 영향(판매가격)
- 최종 시장에의 가격 전달
- 시장 점유율 동향
- 소비자의 반응 패턴
- 영향을 받는 주요 기업
- 전략적인 업계 대응
- 공급망 재구성
- 가격 설정 및 제품 전략
- 정책관여
- 전망과 향후 검토 사항
- 무역에 미치는 영향
- 공급자의 상황
- 이익률 분석
- 주요 뉴스와 대처
- 규제 상황
- 영향요인
- 성장 촉진요인
- 식중독 발생률 상승
- 엄격한 정부규제
- 식품 공급망의 세계화
- 업계의 잠재적 위험 및 과제
- 높은 도입 비용
- 지역간의 표준화의 부족
- 성장 촉진요인
- 성장 가능성 분석
- 무역 분석
- Porter's Five Forces 분석
- PESTEL 분석
제4장 경쟁 구도
- 소개
- 기업의 시장 점유율 분석
- 경쟁 포지셔닝 매트릭스
- 전략적 전망 매트릭스
제5장 시장 추계 및 예측 : 장비 유형별(2021-2034년)
- 주요 동향
- 온도 센서 및 컨트롤러
- 습도 모니터링 시스템
- 압력 모니터링 장치
- 유량계 및 컨트롤러
- 가스 분석장치
- 기타(pH계, 수분 활성계, 금속 감지기 등)
제6장 시장 추계 및 예측 : 기술별(2021-2034년)
- 주요 동향
- 바이오센서
- IoT 및 무선 센서
- AI 및 머신 비전
- 블록체인 통합
- 기타
제7장 시장 추계 및 예측 : 컴포넌트별(2021-2034년)
- 주요 동향
- 하드웨어
- 소프트웨어
제8장 시장 추계 및 예측 : 용도별(2021-2034년)
- 주요 동향
- 육류 및 닭고기 가공 공장
- 유제품 및 치즈 제조 라인
- 해산물 가공 장비
- 음료병 포장 시설
- 조리된 식품 및 포장 식품의 조립 라인
- 기타
제9장 시장 추계 및 예측 : 유통 채널별(2021-2034년)
- 주요 동향
- 직접
- 간접
제10장 시장 추계 및 예측 : 지역별(2021-2034년)
- 주요 동향
- 북미
- 미국
- 캐나다
- 유럽
- 영국
- 독일
- 프랑스
- 이탈리아
- 스페인
- 아시아태평양
- 중국
- 일본
- 인도
- 한국
- 호주
- 라틴아메리카
- 브라질
- 멕시코
- 중동 및 아프리카
- 남아프리카
- 사우디아라비아
- 아랍에미리트(UAE)
제11장 기업 프로파일
- 3M
- ABB Ltd.
- Agilent Technologies, Inc.
- Bio-Rad Laboratories, Inc.
- Danaher Corporation
- Emerson Electric Co
- Endress Hauser Group
- General Electric(GE)
- Honeywell International Inc.
- Mettler-Toledo International Inc.
- Rockwell Automation, Inc.
- Shimadzu Corporation
- Siemens AG
- Thermo Fisher Scientific Inc.
- Yokogawa Electric Corporation
The Global Food Safety Monitoring Systems Market was valued at USD 20.2 billion in 2024 and is estimated to grow at a CAGR of 7.4% to reach USD 40.4 billion by 2034, driven by the escalating number of foodborne illnesses and contamination incidents. As international food trade becomes more interconnected, maintaining consistent safety and quality has become a growing concern. With food items often passing through multiple countries before reaching consumers, the demand for intelligent monitoring systems has surged. These systems offer capabilities like automated data gathering, real-time surveillance, and predictive analytics, ensuring end-to-end safety from source to shelf.
Compliance with international food laws and regulatory frameworks is now a top priority, prompting businesses to adopt solutions that support requirements such as the EU General Food Law and the United States' Food Safety Modernization Act. In addition to meeting regulatory standards, these systems play a critical role in protecting brand integrity and reducing financial exposure due to product recalls or non-compliance.
| Market Scope | |
|---|---|
| Start Year | 2024 |
| Forecast Year | 2025-2034 |
| Start Value | $20.2 Billion |
| Forecast Value | $40.4 Billion |
| CAGR | 7.4% |
In 2024, the temperature sensors and controllers segment generated USD 6.8 billion and is projected to climb to USD 12 billion by 2034. These tools are essential in food safety monitoring as they help minimize microbial risks and preserve the quality of perishable goods across various points in the supply chain. Their application spans processing, transportation, cold storage, and retail operations. Whether in large-scale manufacturing or smaller facilities, these systems offer dependable, scalable, and integrated solutions that fit various operational needs.
The direct distribution channel captured a significant share of 62.9% in 2024 and is set to grow at a CAGR of 7.3% from 2025 through 2034. Direct channels allow providers of food safety monitoring systems to engage closely with end users, creating opportunities to offer customized technology, responsive support, and extended service agreements. These direct relationships help system vendors cater to unique operational demands and build long-term partnerships with clients in manufacturing and processing sectors.
United States Food Safety Monitoring Systems Market generated USD 4.1 billion in 2024 and is projected to grow at a CAGR of 7% through 2034. The country remains a global leader due to its robust regulatory environment and advanced food production landscape. Agencies responsible for food safety strictly enforce regulations that ensure the industry's commitment to traceability and compliance. High consumer expectations around food quality and safety, frequent regulatory audits, and widespread adoption of cutting-edge technologies-including IoT-enabled sensors and AI-powered analytics-are key contributors to the strong market growth in the region.
Key players leading the Food Safety Monitoring Systems Market include Honeywell International Inc., Shimadzu Corporation, Bio-Rad Laboratories, Inc., ABB Ltd., Rockwell Automation, Inc., Mettler-Toledo International Inc., 3M Company, General Electric (GE), Siemens AG, Thermo Fisher Scientific Inc., Yokogawa Electric Corporation, Endress+Hauser Group, Danaher Corporation, Emerson Electric Co, and Agilent Technologies, Inc. To solidify their market presence, companies in the food safety monitoring systems space are deploying several strategic initiatives. Many are investing heavily in R&D to enhance system accuracy, integration, and automation. Others are focusing on software and hardware interoperability to offer seamless monitoring across different stages of the supply chain. Strategic partnerships with food producers and processors help increase adoption, while regional expansion efforts aim to address growing demand in developing markets.
Table of Contents
Chapter 1 Methodology & Scope
- 1.1 Market scope & definition
- 1.2 Base estimates & calculations
- 1.3 Forecast parameters
- 1.4 Data sources
- 1.4.1 Primary
- 1.5 Secondary
- 1.5.1 Paid sources
- 1.5.2 Public sources
Chapter 2 Executive Summary
- 2.1 Industry synopsis, 2021 - 2034
Chapter 3 Industry Insights
- 3.1 Industry ecosystem analysis
- 3.1.1 Factor affecting the value chain
- 3.1.2 Profit margin analysis
- 3.1.3 Disruptions
- 3.1.4 Future outlook
- 3.1.5 Manufacturers
- 3.1.6 Distributors
- 3.1.7 Retailers
- 3.2 Trump administration tariffs analysis
- 3.2.1 Impact on trade
- 3.2.1.1 Trade volume disruptions
- 3.2.1.2 Retaliatory measures
- 3.2.2 Impact on the industry
- 3.2.3 Supply-side impact (raw materials)
- 3.2.3.1 Price volatility in key materials
- 3.2.3.2 Supply chain restructuring
- 3.2.3.3 Production cost implications
- 3.2.3.4 Demand-side impact (selling price)
- 3.2.3.5 Price transmission to end markets
- 3.2.3.6 Market share dynamics
- 3.2.3.7 Consumer response patterns
- 3.2.4 Key companies impacted
- 3.2.5 Strategic industry responses
- 3.2.5.1 Supply chain reconfiguration
- 3.2.5.2 Pricing and product strategies
- 3.2.5.3 Policy engagement
- 3.2.6 Outlook and future considerations
- 3.2.1 Impact on trade
- 3.3 Supplier landscape
- 3.4 Profit margin analysis
- 3.5 Key news & initiatives
- 3.6 Regulatory landscape
- 3.7 Impact forces
- 3.7.1 Growth drivers
- 3.7.1.1 Rising incidence of foodborne illnesses
- 3.7.1.2 Stringent government regulations
- 3.7.1.3 Globalization of food supply chains
- 3.7.2 Industry pitfalls & challenges
- 3.7.2.1 High implementation costs
- 3.7.2.2 Lack of standardization across regions
- 3.7.1 Growth drivers
- 3.8 Growth potential analysis
- 3.9 Trade analysis
- 3.10 Porter's analysis
- 3.11 PESTEL analysis
Chapter 4 Competitive Landscape, 2024
- 4.1 Introduction
- 4.2 Company market share analysis
- 4.3 Competitive positioning matrix
- 4.4 Strategic outlook matrix
Chapter 5 Market Estimates & Forecast, By Equipment Type, 2021 - 2034, (USD Billion) (Thousand Units)
- 5.1 Key trends
- 5.2 Temperature sensors and controllers
- 5.3 Humidity monitoring systems
- 5.4 Pressure monitoring devices
- 5.5 Flow meters and controllers
- 5.6 Gas analyzers
- 5.7 Others (pH meters, water activity monitors, metal detectors, etc.)
Chapter 6 Market Estimates & Forecast, By Technology, 2021 - 2034, (USD Billion) (Thousand Units)
- 6.1 Key trends
- 6.2 Biosensors
- 6.3 IoT & Wireless sensors
- 6.4 AI & Machine vision
- 6.5 Blockchain Integration
- 6.6 Others
Chapter 7 Market Estimates & Forecast, By Component, 2021 - 2034, (USD Billion) (Thousand Units)
- 7.1 Key trends
- 7.2 Hardware
- 7.3 Software
Chapter 8 Market Estimates & Forecast, By Application, 2021 - 2034, (USD Billion) (Thousand Units)
- 8.1 Key trends
- 8.2 Meat & Poultry processing plants
- 8.3 Dairy & Cheese manufacturing lines
- 8.4 Seafood processing equipment
- 8.5 Beverage bottling facilities
- 8.6 Ready-to-Eat & Packaged food assembly lines
- 8.7 Others
Chapter 9 Market Estimates & Forecast, By Distribution Channel, 2021 - 2034, (USD Billion) (Thousand Units)
- 9.1 Key trends
- 9.2 Direct
- 9.3 Indirect
Chapter 10 Market Estimates & Forecast, By Region, 2021 -2034 (USD Billion) (Thousand Units)
- 10.1 Key trends
- 10.2 North America
- 10.2.1 U.S.
- 10.2.2 Canada
- 10.3 Europe
- 10.3.1 UK
- 10.3.2 Germany
- 10.3.3 France
- 10.3.4 Italy
- 10.3.5 Spain
- 10.4 Asia Pacific
- 10.4.1 China
- 10.4.2 Japan
- 10.4.3 India
- 10.4.4 South Korea
- 10.4.5 Australia
- 10.5 Latin America
- 10.5.1 Brazil
- 10.5.2 Mexico
- 10.6 MEA
- 10.6.1 South Africa
- 10.6.2 Saudi Arabia
- 10.6.3 UAE
Chapter 11 Company Profiles (Business Overview, Financial Data, Product Landscape, Strategic Outlook, SWOT Analysis)
- 11.1 3M
- 11.2 ABB Ltd.
- 11.3 Agilent Technologies, Inc.
- 11.4 Bio-Rad Laboratories, Inc.
- 11.5 Danaher Corporation
- 11.6 Emerson Electric Co
- 11.7 Endress+Hauser Group
- 11.8 General Electric (GE)
- 11.9 Honeywell International Inc.
- 11.10 Mettler-Toledo International Inc.
- 11.11 Rockwell Automation, Inc.
- 11.12 Shimadzu Corporation
- 11.13 Siemens AG
- 11.14 Thermo Fisher Scientific Inc.
- 11.15 Yokogawa Electric Corporation