
|
시장보고서
상품코드
1703509
CPaaS 시장(2025-2029년)Global CPaaS Market: 2025-2029 |
||||||
"AdTech와의 제휴가 성장 견인, 내년 CPaaS 매출 340억 달러 돌파 전망"
| 주요 통계 | |
|---|---|
| 2025년 시장 총액: | 302억 달러 |
| 2029년 시장 총액: | 481억 달러 |
| 2025-2029년 시장 성장률 | 60% |
| 예측 기간: | 2025-2029년 |
이 조사 패키지는 향후 12개월 동안 진화하는 CPaaS(Communications Platform-as-a-Service) 시장을 주도하는 주요 요인에 대한 종합적인 분석을 제공합니다. 특히 리치 미디어 채널과 대화형 메시징에 대한 수요가 증가함에 따라 CPaaS 플랫폼이 어떻게 서비스를 전환해야 하는지에 초점을 맞추고 있습니다. SMS 가격 폭등과 사기 등 메시징 시장의 혼란에 따라 향후 1년 동안 CPaaS의 주요 투자 기회를 이해하는 데 있어 이해관계자들에게 필수적인 도구가 되고 있습니다.
이 보고서는 11개 채널과 6개 산업별 CPaaS 트래픽 및 수익 예측, 최신 시장 동향과 비즈니스 기회에 초점을 맞춘 상세한 조사 결과를 담고 있습니다. 또한, CPaaS 분야의 주요 15개 기업과의 인터뷰를 바탕으로 한 광범위한 분석을 포함한 경쟁사 순위표도 포함되어 있습니다.
주요 특징
- 시장 역학 : 이 보고서는 CPaaS 시장 전망에 대한 심층적인 인사이트를 제공하고, 리치 미디어와 대화형 메시징 서비스가 시장에 가져올 파괴적 혁신 등 향후 시장 성장의 주요 촉진요인을 평가하고, CPaaS 기업이 향후 시장에서 성공하기 위해 집중해야 할 주요 부가가치 서비스 및 파트너십, CPaaS 인에이블먼트 서비스 기회를 다루고 있습니다. 또한 은행, 정부 및 공공 서비스, 헬스케어, 여행 및 관광, 소매 및 E-Commerce, 티켓 판매 등 주요 산업 분야의 CPaaS 도입 동향을 조사했습니다. 또한, 61개국의 시장 기회를 평가하는 국가별 준비 지수를 통해 올해 CPaaS 벤더들이 주목해야 할 국가를 선정했습니다.
- 주요 요점 및 전략적 제안 : CPaaS 시장의 주요 발전 기회, 업계 동향, 인사이트를 상세히 분석하고, 이해관계자를 위한 주요 전략적 제안을 담고 있습니다.
- 벤치마크 산업 예측 : CPaaS 트래픽 총량 5년 예측, 은행, 정부/공공서비스, 헬스케어, 여행/관광, 소매/E-Commerce, 티켓 판매 등 채널/섹터별 수익 예측 등 CPaaS 시장 규모와 예측을 제공합니다. 또한, CPaaS 플랫폼을 이용하는 총 기업 수와 CPaaS 구독의 총 수익도 예측하고 있습니다.
- Juniper Research 경쟁사 리더보드 : 18개 CPaaS 벤더의 역량을 평가합니다.
샘플보기
시장 데이터 및 예측 보고서
샘플보기
시장 동향 및 전략 보고서
시장 데이터 및 예측 보고서
이 조사 제품군에는 380개의 표와 263,000개 이상의 데이터 포인트에 대한 시장 예측 데이터세트에 대한 액세스가 포함되어 있습니다. 이 조사 제품군에는 다음과 같은 지표가 포함되어 있습니다:
- CPaaS 트래픽 및 수익 : 채널별
- 이메일
- MMS
- 모바일 아이덴티티 API
- 푸시 알림
- 온라인 & 모바일 챗봇
- OTT 비즈니스 메시징
- RCS 비즈니스 메시징
- SMS
- 소셜 미디어
- 동영상
- 음성
- CPaaS 트래픽 및 수익 : 부문별
- 은행
- 정부 및 공공 서비스
- 헬스케어
- 소매 및 E-Commerce
- 티켓 판매
- 여행·관광
- CPaaS 플랫폼 이용 기업 수
- CPaaS 구독 총수입
Juniper Research 인터랙티브 예측(Excel)은 다음과 같은 기능을 제공합니다:
- 통계 분석 : 데이터 기간 동안 모든 지역과 국가에 대해 표시되며, 특정 지표를 검색할 수 있습니다. 그래프는 쉽게 수정할 수 있으며, 클립보드로 내보낼 수 있습니다.
- 국가별 데이터 도구 : 이 도구에서는 예측 기간 동안 모든 주요 지역 및 국가의 지표를 볼 수 있습니다. 검색창을 통해 표시할 지표를 좁힐 수 있습니다.
- 국가별 비교 도구 : 다른 국가를 선택하여 비교할 수 있습니다. 이 도구에는 그래프를 내보내는 기능이 포함되어 있습니다.
- What-if 분석 : 5가지 인터랙티브 시나리오를 통해 예측 지표를 자신의 가정 조건과 비교할 수 있습니다.
경쟁사 리더보드 보고서
경쟁사 리더보드 보고서에서는 CPaaS 분야의 18개 주요 벤더에 대한 상세한 평가와 시장에서의 포지셔닝을 확인할 수 있습니다.
|
|
목차
시장 동향·전략
제1장 중요 포인트·전략적 제안
- 중요 포인트·전략적 추천사항
- 중요 포인트
- 전략적 제안
제2장 향후 시장 전망
- CPaaS 시장 : 소개
- CPaaS 시장 향후 전망
- CPaaS 비즈니스 모델
- 부가가치 서비스
- CPaaS 파트너십
- CPaaS 유효화
제3장 업계 동향과 향후 성장
- 업계 개요
- 은행 업무
- 헬스케어
- 소매·E-Commerce
- 여행과 관광
제4장 국가별 준비 지수
- 국가별 준비 지수 : 소개
- 주목 시장
- 성장 시장
- 포화 시장
- 신흥 시장
경쟁 리더보드
제1장 경쟁 리더보드
제2장 기업 개요
- Bandwidth
- CEQUENS
- Cisco Webex
- CM.com
- Comviva
- GMS(Global Message Services)
- Infobip
- LINK Mobility
- Monty Mobile
- Route Mobile(Proximus Group)
- Sinch
- Soprano Design
- Syniverse
- Tanla Platforms
- Tata Communications
- Twilio
- Vonage
- 관련 조사
데이터·예측
제1장 시장 예측·중요 포인트
- CPaaS 예측 : 소개
- CPaaS 시장 가치 합계
- CPaaS 트래픽 매출 : 채널별
- CPaaS 트래픽 매출 : 부문별
제2장 CPaaS 모바일 메시징 예측
- CPaaS SMS & MMS 예측 : 소개
- CPaaS SMS & MMS : 예측 방법
- CPaaS SMS 시장 전체
- CPaaS MMS 시장 전체
- CPaaS RCS 메시징 시장
- 예측 방법
- 총매출
- CPaaS OTT 메시징 시장
- 예측 방법
- 총매출
- CPaaS 아이덴티티 API 시장
- 예측 방법
- 총매출
제3장 음성·비디오 시장 예측
- CPaaS 음성·비디오 : 소개
- 예측 방법
- CPaaS 음성 총매출
- CPaaS 비디오 총매출
'CPaaS Revenue to Exceed $34bn Next Year, as AdTech Partnerships Drive Growth'
| KEY STATISTICS | |
|---|---|
| Total market value in 2025: | $30.2bn |
| Total market value in 2029: | $48.1bn |
| Market growth 2025-2029: | 60% |
| Forecast period: | 2025-2029 |
Overview
Our latest "Communications Platform-as-a-Service (CPaaS)" research suite comprises a comprehensive analysis of the key factors driving this evolving market over the next 12 months; emphasising how CPaaS platforms must pivot their services as demand for rich media channels and conversational messaging grows. With the recent disruption within the messaging market, including the high price and fraud surrounding SMS, the report is an essential tool for stakeholders to understand where the key investment opportunities are for CPaaS over the next year.
The CPaaS market report includes several different options that can be purchased separately. This includes access to a market forecast of CPaaS traffic and revenue, split by 11 channels and six industries, and a detailed study highlighting the latest market trends and opportunities. It also includes a Competitor Leaderboard document containing an extensive analysis of the major players in the CPaaS space, backed by 15 interviews with leading market players. The coverage can also be purchased as a full research suite, containing all these elements and including a substantial discount.
The study will provide stakeholders with key information on how to succeed in the CPaaS market; including how growth in rich media and conversational messaging must impact CPaaS players' future strategies. It assesses the key value-added services that CPaaS players must offer, including rich media tools, chatbots, and network application programming interfaces (APIs). Its extensive coverage makes the CPaaS research suite an incredibly valuable resource for examining the future of this market.
All report content is delivered in the English language.
Key Features
- Market Dynamics: Provides detailed insight into the outlook of the CPaaS market; assessing key drivers to future market growth, including the disruption that rich media and conversational messaging services will have on the market. It addresses the key value-added services and partnerships that CPaaS players must focus on for future success in the market, as well as the opportunity for CPaaS enablement services. The research also explores enterprise adoption of CPaaS across key industries, including banking, government & public services, healthcare, travel & tourism, retail & eCommerce, and ticketing. Moreover, it includes a Country Readiness Index which assesses the market opportunities across 61 countries; identifying countries which must be of focus for CPaaS vendors this year.
- Key Takeaways & Strategic Recommendations: In-depth analysis of key development opportunities, industry trends, and findings within the CPaaS market; accompanied by key strategic recommendations for stakeholders.
- Benchmark Industry Forecasts: This provides market sizing and forecasts for CPaaS, including five-year forecasts for total CPaaS traffic, and revenue split by channel and sector, including banking, government & public services, healthcare, travel & tourism, retail & eCommerce, and ticketing. It also forecasts the total number of businesses using CPaaS platforms and the total CPaaS subscription revenue.
- Juniper Research Competitor Leaderboard: Key industry player capability and capacity assessment for 18 CPaaS vendors, via the Juniper Research Competitor Leaderboard.
SAMPLE VIEW
Market Data & Forecasting Report

The numbers tell you what's happening, but our written report details why, alongside the methodologies.
SAMPLE VIEW
Market Trends & Strategies Report

A comprehensive analysis of the current market landscape, alongside strategic recommendations.
Market Data & Forecasting Report
The market-leading research suite for the "CPaaS" market includes access to the full set of market forecast data of 380 tables and over 263,000 datapoints. Metrics in the research suite include:
- Total CPaaS traffic and revenue, split by channel:
- MMS
- Mobile Identity APIs
- Push Notifications
- Online & Mobile Chatbots
- OTT Business Messaging
- RCS Business Messaging
- SMS
- Social Media
- Video
- Voice
- Total CPaaS traffic and revenue is then further split by sector:
- Banking
- Government & Public Services
- Healthcare
- Retail & eCommerce
- Ticketing
- Travel & Tourism
- Total Number of Businesses Using CPaaS Platforms
- Total CPaaS Subscription Revenue
Juniper Research Interactive Forecast Excel contains the following functionality:
- Statistics Analysis: Users benefit from the ability to search for specific metrics, displayed for all regions and countries across the data period. Graphs are easily modified and can be exported to the clipboard.
- Country Data Tool: This tool lets users look at metrics for all key regions and countries in the forecast period. Users can refine the metrics displayed via a search bar.
- Country Comparison Tool: Users can select and compare different countries. The ability to export graphs is included in this tool.
- What-if Analysis: Here, users can compare forecast metrics against their own assumptions, via five interactive scenarios.
Market Trends & Strategies Report
This market study examines the "CPaaS" landscape in detail; assessing how disruption within the messaging market will impact the future growth of the CPaaS market, as well as which channels will be key to this growth. The report delivers an in-depth analysis of the strategic opportunities for vendors, addressing key partnership opportunities, industry demand, and the potential of CPaaS enablement services.
It also evaluates country level opportunities for CPaaS growth, via Juniper Research's Country Readiness Index; identifying the key markets where enterprises are expected to adopt the advanced capabilities of CPaaS which will lead to higher profit margins for CPaaS vendors, and therefore the markets that vendors should focus on next year.
Competitor Leaderboard Report
The Competitor Leaderboard report provides a detailed evaluation and market positioning for 18 leading vendors in the "CPaaS" space. The vendors are positioned as either established leaders, leading challengers or disruptors and challengers based on capacity and capability assessments:
|
|
This document is centred around the Juniper Research Competitor Leaderboard; a vendor positioning tool that provides an at-a-glance view of the competitive landscape in a market, backed by a robust methodology.
Table of Contents
Market Trends & Strategies
1. Key Takeaways & Strategic Recommendations
- 1.1. Key Takeaways & Strategic Recommendations
- 1.2. Key Takeaways
- 1.3. Strategic Recommendations
2. Future Market Outlook
- 2.1. CPaaS Market Introduction
- 2.2. Future Outlook For the CPaaS Market
- Figure 2.1: Global CPaaS Market Value in 2025, Split by 8 Key Regions: $30.1 billion
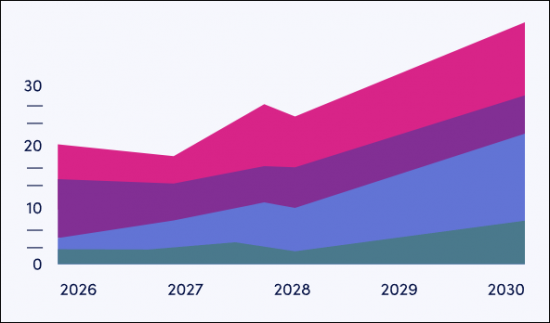
- Figure 2.2: CPaaS Revenue by Channel ($m), 2025-2029
- 2.3. CPaaS Business Model
- 2.3.1. Value-added Services
- i. Rich Messaging Channel Tools
- Figure 2.3: Marketing Message in Rich Media and SMS Format
- ii. Network APIs
- iii. Chatbots
- i. Rich Messaging Channel Tools
- 2.3.2. CPaaS Partnerships
- 2.3.3. CPaaS Enablement
- 2.3.1. Value-added Services
3. Industry Trends & Future Growth
- 3.1. Industry Overview
- Figure 3.1: CPaaS Market Share by Industry, 2025
- 3.1.1. Banking
- Figure 3.2: CPaaS Revenue in the Banking Industry ($m), Split by Channel, 2025-2029
- 3.1.2. Healthcare
- Figure 3.3: CPaaS Revenue in the Healthcare Industry ($m), Split by Channel, 2025-2029
- 3.1.3. Retail & eCommerce
- Figure 3.4: CPaaS Revenue in the Retail & eCommerce Industry ($m), Split by Channel, 2025-2029
- 3.1.4. Travel & Tourism
- Figure 3.5: CPaaS Revenue in the Travel & Tourism Industry ($m), Split by Channel, 2025-2029
- Figure 3.6: Example WhatsApp Message For Travel & Tourism
4. Country Readiness Index
- 4.1. Introduction to the Country Readiness Index
- Figure 4.1: Country Readiness Index Regional Definitions
- Table 4.2: Juniper Research Country Readiness Index Scoring Criteria: CPaaS Disruption
- Figure 4.3: Juniper Research Country Readiness Index: CPaaS
- Table 4.4: Juniper Research CPaaS Country Readiness Index: List of Country Categorisation
- 4.2. Focus Markets
- 4.2.1. Investment in 5G and Cloud Services Provides Basis for CPaaS Adoption in Focus Markets
- Figure 4.5: Proportion of SIMs that are 5G in Key Focus Markets in 2025 (%)
- 4.2.2. Clarity of Regulations Simplifies Compliance, Encouraging Enterprise Adoption
- 4.2.3. High Number of Rich Media Messaging Users in Focus Markets to Boost Adoption for Marketing Use Cases
- Figure 4.6: Proportion of Mobile Subscribers that Subscribe to OTT Messaging Applications in Key Focus Markets in 2025 (%)
- 4.2.1. Investment in 5G and Cloud Services Provides Basis for CPaaS Adoption in Focus Markets
- 4.3. Growth Markets
- 4.3.1. High Advertising Spend and Penetration of Rich Messaging Channels Indicates Future Demand for Marketing Use Cases
- Table 4.7: Average Spend per Business on Digital Advertising in Israel and Malaysia ($)
- 4.3.1. High Advertising Spend and Penetration of Rich Messaging Channels Indicates Future Demand for Marketing Use Cases
- 4.4. Saturated Markets
- 4.4.1. High Existing CPaaS Traffic, but Limited Opportunity for Growth with Rich Media Use Cases
- 4.5. Developing Markets
- 4.5.1. Vague or Highly Stringent Regulatory Frameworks
- 4.5.2. Low Demand for Advanced Capabilities of CPaaS Platforms
- Figure 4.8: Average Number of Chatbot Accesses per User per Month in Key Developing Markets in 2025
- Table 4.9: Juniper Research Competitor Leaderboard Scoring Heatmap: North America
- Table 4.10: Juniper Research Competitor Leaderboard Scoring Heatmap: Latin America
- Table 4.11: Juniper Research Competitor Leaderboard Scoring Heatmap: West Europe
- Table 4.12: Juniper Research Competitor Leaderboard Scoring Heatmap: Central & East Europe
- Table 4.13: Juniper Research Competitor Leaderboard Scoring Heatmap: Far East & China
- Table 4.14: Juniper Research Competitor Leaderboard Scoring Heatmap: Indian Subcontinent
- Table 4.15: Juniper Research Competitor Leaderboard Scoring Heatmap: Rest of Asia Pacific
- Table 4.16: Juniper Research Competitor Leaderboard Scoring Heatmap: Africa & Middle East
Competitor Leaderboard
1. Competitor Leaderboard
2. Company Profiles
- 2.1.1. Bandwidth
- i. Corporate Information
- Table 2.1: Bandwidth's Select Financial Information ($m), 2023-2024
- ii. Geographical Spread
- iii. Key Clients & Strategic Partnerships
- iv. High-level View of Offerings
- v. Juniper Research's View: Key Strengths & Strategic Development Opportunities
- i. Corporate Information
- 2.1.2. CEQUENS
- 2.1.3. Cisco Webex
- Table 2.3: Cisco's Selected Financial Information ($bn), Fiscal Year 2022-2024
- v. Juniper Research's View: Key Strengths & Strategic Development Opportunities
- 2.1.4. CM.com
- i. Corporate Information
- Table 2.4: Relevant Acquisitions Made by CM.com, 2020-present
- Table 2.5: CM.com's Select Financial Information (Euro-m), 2022-2024
- ii. Geographical Spread
- iii. Key Clients & Strategic Partners
- iv. High-level View of Offerings
- v. Juniper Research's View: Key Strengths & Strategic Development Opportunities
- i. Corporate Information
- 2.1.5. Comviva
- i. Corporate Information
- ii. Geographical Spread
- iii. Key Clients & Strategic Recommendations
- iv. High-level View of Offerings
- v. Juniper Research's View: Key Strengths & Strategic Development Opportunities
- 2.1.6. GMS (Global Message Services)
- i. Corporate Information
- ii. Geographical Spread
- iii. Key Clients & Strategic Partners
- iv. High-level View of Offerings
- v. Juniper Research's View: Key Strengths & Strategic Development Opportunities
- 2.1.7. Infobip
- i. Corporate Information
- Table 2.6: Infobip's Acquisitions - April 2021 to Present
- ii. Geographical Spread
- iii. Key Clients & Strategic Partnerships
- iv. High-level View of Offerings
- v. Juniper Research's View: Key Strengths & Strategic Development Opportunities
- i. Corporate Information
- 2.1.8. LINK Mobility
- i. Corporate Information
- iv. High-level View of Offerings
- v. Juniper Research's View: Key Strengths & Strategic Development Opportunities
- v. Juniper Research's View: Key Strengths & Strategic Development Opportunities
- 2.1.10. Monty Mobile
- 2.1.11. Route Mobile (Proximus Group)
- i. Corporate Information
- Table 2.7: Route Mobile's Financial Information (Indian Rupee- Cr), FY 2021-22 - FY 2023-24
- ii. Geographical Spread
- iii. Key Clients & Strategic Partners
- iv. High-level View of Offerings
- v. Juniper Research's View: Key Strengths & Strategic Development Opportunities
- i. Corporate Information
- 2.1.12. Sinch
- i. Corporate Information
- Table 2.8: Sinch's Most Recent Acquisitions, 2020-2021
- Table 2.9: Sinch's Select Financial Information (SEKm), 2022-2024
- ii. Geographical Spread
- iii. Key Clients & Strategic Partnerships
- iv. High-level View of Offerings
- v. Juniper Research's View: Key Strengths & Strategic Development Opportunities
- i. Corporate Information
- 2.1.13. Soprano Design
- i. Corporate Information
- ii. Geographical Spread
- Figure 2.10: Soprano Design's Global Reach and Support Network
- iii. Key Clients & Strategic Partnerships
- iv. High-level View of Offerings
- v. Juniper Research's View: Key Strengths & Strategic Development Opportunities
- 2.1.14. Syniverse
- i. Corporate Information
- ii. Geographical Spread
- iii. Key Customers & Strategic Partnerships
- iv. High-level View of Offerings
- v. Juniper Research's View: Key Strengths & Strategic Development Opportunities
- 2.1.15. Tanla Platforms
- i. Corporate Information
- ii. Geographical Spread
- iii. Key Clients & Strategic Partnerships
- iv. High-level View of Offerings
- v. Juniper Research's View: Key Strengths & Strategic Development Opportunities
- 2.1.16. Tata Communications
- i. Corporate Information
- Table 2.11: Tata Communications' Select Financial Information (Indian Rupee- in crore), FY 2022-23 & FY 2023-24
- ii. Geographical Spread
- iii. Key Clients & Strategic Partnerships
- v. Juniper Research's View: Key Strengths & Strategic Development Opportunities
- i. Corporate Information
- 2.1.17. Twilio
- i. Corporate Information
- Table 2.12: Twilio's Revenue Information 2021-present
- ii. Geographical Spread
- iii. Key Clients & Strategic Partnerships
- iv. High-level View of Offerings
- v. Juniper Research's View: Key Strengths & Strategic Development Opportunities
- i. Corporate Information
- 2.1.19. Vonage
- i. Corporate Information
- ii. Geographical Spread
- iii. Key Clients & Strategic Partnerships
- iv. High-level View of Offerings
- v. Juniper Research's View: Key Strengths & Strategic Development Opportunities
- Table 2.13: Juniper Research Competitor Leaderboard Scoring Criteria
- 2.2. Related Research
Data & Forecasting
1. Market Forecasts & Key Takeaways
- 1.1. Introduction to CPaaS Forecasts
- Figure 1.1: Key CPaaS Forecast Information
- 1.1.1. Total CPaaS Market Value
- Figure & Table 1.2: Total CPaaS Market Value ($m), Split by 8 Key Regions 2025-2029
- 1.1.2. Total CPaaS Traffic Revenue by Channel
- Figure & Table 1.3: Total CPaaS Traffic Revenue ($m), Split by 11 Key Channels, 2025-2029
- 1.1.3. CPaaS Traffic Revenue by Sector
- Figure & Table 1.4: Total CPaaS Traffic Revenue ($m), Split by 6 Key Sectors, 2025-2029
2. CPaaS Mobile Messaging Forecasts
- 2.1. Introduction to CPaaS SMS & MMS Forecasts
- 2.1.1. CPaaS SMS & MMS Forecast Methodology
- Figure 2.1: CPaaS SMS Forecast Methodology
- Figure 2.2: CPaaS MMS Forecast Methodology
- 2.1.2. Total CPaaS SMS Market
- Figure & Table 2.3: Total CPaaS SMS Revenue ($m), Split by 8 Key Regions, 2025-2029
- 2.1.3. Total CPaaS MMS Market
- Figure & Table 2.4: Total CPaaS SMS Revenue ($m), Split by 8 Key Regions, 2025-2029
- 2.1.1. CPaaS SMS & MMS Forecast Methodology
- 2.2. CPaaS RCS Messaging Market
- 2.2.1. RCS Business Messaging Forecast Methodology
- Figure 2.5: RCS Business Messaging Forecast Methodology
- 2.2.2. Total CPaaS RCS Revenue
- Figure & Table 2.6: Total CPaaS RCS Revenue ($m), Split by 8 Key Regions, 2025-2029
- 2.2.1. RCS Business Messaging Forecast Methodology
- 2.3. CPaaS OTT Messaging Market
- 2.3.1. OTT Business Messaging Forecast Methodology
- Figure 2.7: OTT Business Messaging Forecast Methodology
- 2.3.2. Total CPaaS OTT Business Messaging Revenue
- Figure & Table 2.8: Total CPaaS Revenue from OTT Business Messaging Traffic ($m), Split by 8 Key Regions, 2025-2029
- 2.3.1. OTT Business Messaging Forecast Methodology
- 2.4. CPaaS Identity API Market
- 2.4.1. Identity API Forecast Methodology
- Figure 2.9: Identity API Forecast Methodology
- 2.4.2. Total CPaaS Identity API Revenue
- Figure & Table 2.10: Total CPaaS Revenue from Mobile Identity API Calls ($m), Split by 8 Key Regions, 2025-2029
- 2.4.1. Identity API Forecast Methodology
3. Voice & Video Market Forecasts
- 3.1. Introduction to CPaaS Voice & Video
- 3.1.1. Voice & Video Forecast Methodology
- Figure 3.1: CPaaS Voice Forecast Methodology
- Figure 3.2: CPaaS Video Forecast Methodology
- 3.1.2. Total CPaaS Voice Revenue
- Figure & Table 3.3: Total CPaaS Voice Service Revenue ($m), Split by 8 Key Regions, 2025-2029
- 3.1.3. Total CPaaS Video Revenue
- Figure & Table 3.4: Total CPaaS Video Service Revenue ($m), Split by 8 Key Regions, 2025-2029
- 3.1.1. Voice & Video Forecast Methodology
