|
시장보고서
상품코드
1850194
AaaS(Analytics as a Service) 시장 : 점유율 분석, 산업 동향, 통계, 성장 예측(2025-2030년)Analytics As A Service - Market Share Analysis, Industry Trends & Statistics, Growth Forecasts (2025 - 2030) |
||||||
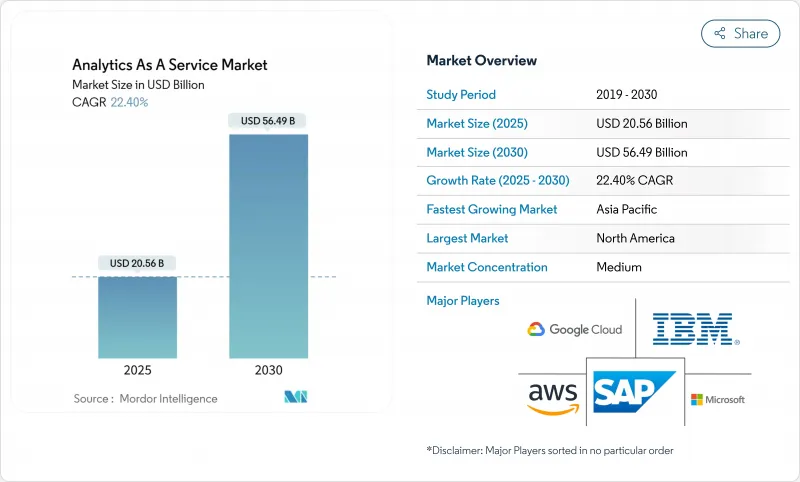
AaaS(Analytics as a Service) 시장 규모는 2025년에 205억 6,000만 달러, 예측 기간(2025-2030년)의 CAGR은 22.40%를 나타내고, 2030년에는 564억 9,000만 달러에 이를 것으로 예측됩니다.

클라우드 퍼스트 데이터 현대화 프로그램을 통해 기업은 On-Premise 분석 스택을 폐지하고 종량 과금 서비스로 전환할 수 있으므로 수요가 증가하고 있습니다. 또한, 벡터 네이티브 데이터스토어의 급속한 보급으로, 생성형 AI를 위한 비구조화된 데이터의 실시간 처리가 가능해지고 있습니다. 현재 퍼블릭 클라우드의 도입이 주도하고 있지만, 기업이 비용 관리와 데이터 주권 규칙의 균형을 맞추면서 하이브리드 전략이 진행되고 있습니다. 하이퍼스케일 플랫폼이 AI 기능을 강화하는 반면 전문 공급업체는 수직 솔루션과 임베디드 애널리틱스에 집중하기 때문에 경쟁이 치열해지고 있습니다. 그러나 인력 부족과 데이터 진출의 경제성은 도입 일정과 ROI 계산에 영향을 미치고 있습니다.
세계 AaaS(Analytics as a Service) 시장 동향과 통찰
클라우드 우선 기업 데이터 현대화 프로그램
현대화 프로젝트는 사일로화된 데이터를 AI 지원 파이프라인을 지원하는 클라우드 네이티브 플랫폼에 통합하는 동기 부여가 되었습니다. IBM의 보고서에 따르면 대기업의 대부분은 2025년까지 클라우드에서 대부분의 워크로드를 실행할 계획이며 레거시 데이터 웨어하우스에서 벗어나는 것을 강조하고 있습니다. 공급업체는 워크로드의 이식성을 단순화하고, 스키마 변환을 자동화하고, 다중 리전 환경에서 보안 관리를 유지하기 위한 전체 스택 마이그레이션 툴킷을 제공합니다. 금융 서비스, 헬스케어 및 소매업이 데이터 웨어하우스를 도입하는 주요 이점은 통찰력을 얻기까지의 시간 단축과 인프라 오버헤드 감소를 포함합니다. 지출이 자본 투자에서 운영 지출로 이동하는 동안 서비스 제공 업체는 투명성이 높은 가격 설정, 통합 거버넌스 및 도입 가속을위한 사전 구축 된 AI 서비스로 차별화를 도모하고 있습니다.
AI에 대응하는 벡터 네이티브 데이터 스토어의 보급
벡터 데이터베이스는 일반 AI 검색, 추천 및 채팅 경험을 위한 비정형 컨텐츠를 릴리스하는 데 도움이 됩니다. Oracle은 HeatWave GenAI에 자동 벡터 스토어를 통합했습니다. Salesforce는 Data Cloud에서 벡터 기능을 사용할 수 있습니다. 이러한 통합은 개별 인덱싱 레이어를 사용하지 않고도 대규모 유사성 쿼리를 단순화합니다. 엔터프라이즈는 단일 플랫폼 내에서 텍스트, 음성, 이미지 임베딩 및 트랜잭션 데이터를 결합할 수 있는 능력을 획득하여 대기 시간과 운영 복잡성을 줄일 수 있습니다. 소매업 및 미디어 업계에서는 개인화된 경험을 실현하기 위해 이 접근법을 신속하게 채택하고 산업계에서는 품질 검사 모델을 개선하기 위해 벡터 검색을 채택합니다. 시장 진출기업은 오픈소스 호환성과 모델 재교육을 용이하게 하는 오케스트레이션 파이프라인을 강조하고 있습니다.
급등하는 하이퍼스케일러의 이글레스피의 경제성
데이터 전송 요금은 일반 클라우드 요금의 10%-15%를 차지할 수 있습니다. 이러한 요금은 플랫폼 간 테라바이트를 마이그레이션함으로써 총 소유 비용이 증가하기 때문에 멀티클라우드 분석 아키텍처를 방해합니다. 영국 시장 경쟁청은 전환 수수료를 스위칭 장벽으로 지적합니다. 일부 공급자는 특정 조건 하에서 요금 면제를 도입하고 있지만 고객은 여전히 계약상의 장애물에 직면하고 있습니다. 서비스 통합자는 현재 대용량 데이터 세트를 중립 스토리지 계층에 유지하는 아키텍처와 최대 85%의 비용 절감을 추구하는 Rackspace Data Freedom과 같은 데이터 인 모션 최적화를 채택하는 아키텍처를 추진하고 있습니다.
부문 분석
대기업은 2024년 매출의 64%를 차지하는 기업 규모의 데이터 레이크 및 고급 모델링 도구 도입에 많은 예산을 활용하고 있습니다. 대기업의 분석 시설은 종종 오랜 ERP 및 CRM 시스템과 통합되어 부서 횡단 대시보드 및 AI 주도 예측을 가능하게 합니다. 또한 다국적 기업은 주권 관리를 우선하기 위해 사설 백본 네트워크를 통해 상호 연결하는 지역 고유의 도입을 진행하고 있습니다.
중소기업의 현재 점유율은 작지만 2030년까지 연평균 복합 성장률(CAGR)은 24.3%를 나타내고 가장 높습니다. 종량제 가격 설정과 턴키 템플릿은 데이터 사이언스 전문 팀이 없는 기업의 장벽을 낮춥니다. 노코드 인터페이스, 자동 ML 서비스, 패키징된 가상 애널리틱스는 창업자가 신속하게 통찰력을 제공하고 재고 최적화 및 타겟 마케팅을 지원하는 데 도움이 됩니다. 중소기업 도입이 확대됨에 따라 공급업체는 워크로드 비용을 비즈니스 KPI에 매핑하고 재무 팀과 운영 팀 전반에 걸쳐 투명한 예산 구성을 촉진하는 단순화된 FinOps 콘솔을 시험적으로 도입하고 있습니다. 중소기업의 유입은 AaaS(Analytics as a Service) 시장의 고객 기반을 확대하고 공급자는 경량 서비스 계층과 커뮤니티 주도 교육을 출시하게 됩니다.
퍼블릭 클라우드가 2024년 매출의 48.3%를 유지한 이유는 공유 인프라가 즉각적인 탄력성, 세계 도달범위 및 지속적인 기능 업그레이드를 가능하게 하기 때문입니다. 신흥 기업과 디지털 네이티브 기업은 최신 AI 가속기에 액세스하면서 데이터센터에 지출을 피하고 완전 관리 분석 스택을 활용합니다. 그러나 규제 산업의 기업은 거주 의무와 사내 위험 정책을 충족하기 위해 민감한 워크로드를 개인 환경에 유지합니다.
하이브리드 아키텍처는 CAGR 26.7%로 확장되어 퍼블릭 확장성과 프라이빗 클라우드 제어가 융합됩니다. IBM은 하이브리드 배치를 통해 팀이 데이터와 컴퓨팅을 최적의 위치에 배치할 수 있게 되어 유연성이 향상된다고 지적합니다. 엔터프라이즈는 일반적으로 원시 데이터를 개인 오브젝트 저장소에 배치하고 대규모 모델 교육을 위해 공용 클러스터에 버스트합니다. 이 토폴로지는 igres 비용을 줄이고 계층화된 재해 복구 태세를 지원합니다. 소블린 요구사항이 높아짐에 따라 공급업체는 지역별 소블린 클라우드 존과 클라우드 간 네트워킹 서비스를 도입하여 AaaS(Analytics as a Service) 시장에서 하이브리드의 매력을 더욱 향상시키고 있습니다.
AaaS(Analytics as a Service) 시장은 기업 규모별(중소기업, 대기업), 전개 모델별(퍼블릭 클라우드, 프라이빗 클라우드, 하이브리드 클라우드), 분석 유형별(기술적 분석, 진단적 분석, 기타), 최종 사용자 산업별(IT 및 통신, 은행, 금융서비스 및 보험(BFSI), 헬스케어 및 생명과학 등), 지역별로 분류되어 있습니다. 시장 예측은 금액(달러)으로 제공됩니다.
지역 분석
북미는 2024년 매출의 42.8%를 차지하고 클라우드 보급, 성숙한 AI 인재 풀, 압도적인 하이퍼스케일러에 의한 끊임없는 제품 혁신이 그 요인이 되고 있습니다. 헬스케어, 소매, 미디어의 미국 기업은 대규모 애널리틱스를 적용하여 체험의 개인화, 물류 최적화, 정밀의료 추진을 실시했습니다. 정부기관은 또한 분석 워크로드를 촉진하는 데이터 공유 이니셔티브를 확대하고 있습니다. 캐나다 기업은 공공 부문의 데이터 거주에 관한 법률을 충족하는 소블린 클라우드 존의 신속한 도입으로 이를 추종하고 있습니다. 멕시코 제조 회랑에서는 수출 지향 공급망에 클라우드 애널리틱스를 통합하여 업무 통찰력의 격차를 해소하고 있습니다.
아시아태평양은 중국, 일본, 인도, 동남아시아의 적극적인 디지털 경제 아젠다에 견인되어 CAGR이 25.4%로 가장 높을 것으로 예측되고 있습니다. 급속히 확장되는 전자상거래 플랫폼은 매일 테라바이트 단위의 행동 데이터를 캡처하고 핀테크는 충분한 서비스를 받지 않은 사람들을 대상으로 한 신용 모델을 전개하고 있습니다. 현지 클라우드 제공업체는 다국적 하이퍼스케일러와 제휴하여 지역을 준수하는 인프라를 구축함으로써 대기 시간을 낮추고 주권에 대응하는 서비스로서 분석 시장 제공을 가능하게 하고 있습니다. 스마트 팩토리 개발을 위한 정부 자극책이 수요를 더욱 자극하고, 중소기업은 저비용의 서비스 번들을 활용해 레거시 시스템으로부터 도약합니다.
유럽은 프라이버시와 AI 거버넌스의 틀에 의해 형성된 큰 점유율을 차지합니다. GDPR(EU 개인정보보호규정)의 엄격한 시행과 향후 예정된 EU의 AI 법규는 설명 가능한 모델, 감사 계층, 주권 클라우드 제어의 도입을 기업에 촉구하고 있습니다. AWS는 독일을 기반으로 하는 기업체를 설립하고 2025년 후반을 목표로 독립한 유럽 소블린 클라우드를 운영한다고 발표했습니다. 금융 기관은 다중 리전 중복성을 도입하여 운영 탄력성을 유지하며, 제조업은 IoT 데이터를 애널리틱스 파이프라인에 연결하여 에너지 효율 목표를 지원합니다. 유럽의 AaaS(Analytics as a Service) 시장은 이와 같이 혁신과 컴플라이언스의 균형을 맞추고 비즈니스와 규제 요구를 충족시키는 하이브리드 패턴을 추진하고 있습니다.
기타 혜택 :
- 엑셀 형식 시장 예측(ME) 시트
- 3개월간의 애널리스트 서포트
목차
제1장 서론
- 조사의 전제조건과 시장의 정의
- 조사 범위
제2장 조사 방법
제3장 주요 요약
제4장 시장 상황
- 시장 개요
- 시장 성장 촉진요인
- 클라우드 퍼스트의 엔터프라이즈 데이터 근대화 프로그램
- Gen-AI 대응의 벡터 네이티브 데이터 스토어의 보급
- SMB의 클라우드 이행에 의한 종량 과금제 수요 증가
- 컴플라이언스 주도 실시간 감사 분석(예: DORA, SEC)
- 수직 SaaS "미니 클라우드"에서의 임베디드 분석
- 소블린 클라우드의 의무화에 의해 지역적인 AaaS의 구축이 촉진된다
- 시장 성장 억제요인
- 하이퍼스케일러의 에그레스 요금의 경제성이 높아진다
- FinOps와 데이터 운용의 인재 부족
- 모델의 설명 가능성에 관한 규제가 도입을 지연시킨다
- 비 녹색 데이터센터의 이용을 제한하는 탄소 강도 할당
- 업계 밸류체인 분석
- 규제 상황
- 기술의 전망
- 주요 실적 평가 지표(KPI)
- 업계의 매력 - Porter's Five Forces 분석
- 신규 참가업체의 위협
- 구매자의 협상력
- 공급기업의 협상력
- 대체품의 위협
- 경쟁 기업간 경쟁 관계
- 거시 경제 요인이 시장에 미치는 영향
제5장 시장 규모와 성장 예측(가치관)
- 기업 규모별
- 중소기업
- 대기업
- 전개 모델별
- 퍼블릭 클라우드
- 프라이빗 클라우드
- 하이브리드 클라우드
- 분석 유형별
- 기술적 분석
- 진단 분석
- 예측 분석
- 처방적 분석
- 최종 사용자 업계별
- IT 및 통신
- BFSI
- 헬스케어 및 생명과학
- 소매업 및 전자상거래
- 제조업
- 에너지 및 유틸리티
- 정부 및 공공 부문
- 기타 최종 사용자 산업
- 지역별
- 북미
- 미국
- 캐나다
- 멕시코
- 남미
- 브라질
- 아르헨티나
- 칠레
- 기타 남미
- 유럽
- 독일
- 영국
- 프랑스
- 이탈리아
- 스페인
- 러시아
- 기타 유럽
- 아시아태평양
- 중국
- 일본
- 인도
- 한국
- 호주
- 싱가포르
- 말레이시아
- 기타 아시아태평양
- 중동 및 아프리카
- 중동
- 사우디아라비아
- 아랍에미리트(UAE)
- 튀르키예
- 기타 중동
- 아프리카
- 남아프리카
- 나이지리아
- 이집트
- 기타 아프리카
- 북미
제6장 경쟁 구도
- 시장 집중도
- 전략적 동향
- 시장 점유율 분석
- 기업 프로파일
- Amazon Web Services
- Microsoft Corporation
- Google Cloud(Alphabet Inc.)
- IBM Corporation
- SAP SE
- Oracle Corporation
- Hewlett Packard Enterprise
- SAS Institute
- Accenture PLC
- Teradata Corporation
- Snowflake Inc.
- Databricks, Inc.
- Salesforce, Inc.
- Tableau Software, LLC
- QlikTech International AB
- MicroStrategy Incorporated
- TIBCO Software, Inc.
- Alteryx, Inc.
- Splunk Inc.
- Domo, Inc.
- Sisense Ltd.
- ThoughtSpot, Inc.
- Looker Studio(Google)
- GoodData, Inc.
- Zoho Analytics(Zoho Corporation)
제7장 시장 기회와 미래 동향
- 화이트 스페이스와 미충족 요구의 평가
The Analytics as a Service Market size is estimated at USD 20.56 billion in 2025, and is expected to reach USD 56.49 billion by 2030, at a CAGR of 22.40% during the forecast period (2025-2030).
Demand is rising because cloud-first data-modernization programs allow enterprises to retire on-premises analytics stacks and shift to pay-as-you-go services. The fast spread of vector-native data stores is also enabling real-time processing of unstructured data for generative AI. Public cloud deployments lead today, yet hybrid strategies are advancing as firms balance cost control with data-sovereignty rules. Competitive intensity is mounting as hyperscale platforms deepen AI capabilities while specialist providers focus on vertical solutions and embedded analytics. Talent shortages and data-egress economics, however, continue to influence implementation timelines and ROI calculations.
Global Analytics As A Service Market Trends and Insights
Cloud-First Enterprise Data-Modernization Programmes
Modernization projects are motivating organisations to consolidate siloed data into cloud-native platforms that support AI-ready pipelines. IBM reports that a majority of large enterprises plan to run most workloads in the cloud by 2025, underscoring a pivot away from legacy data warehouses. Vendors position full-stack migration toolkits to simplify workload portability, automate schema conversion, and uphold security controls across multi-region environments. Financial services, healthcare, and retail adopters cite quicker time-to-insight and lower infrastructure overhead as primary benefits. As spending shifts from capital expenditure to operating expenditure, service providers differentiate on transparent pricing, integrated governance, and pre-built AI services to accelerate deployment.
Proliferation of Gen-AI-Ready, Vector-Native Data Stores
Vector databases are helping firms unlock unstructured content for generative AI search, recommendation, and chat experiences. Oracle embedded automated vector stores inside its HeatWave GenAI offering. Salesforce followed by enabling vector capabilities in Data Cloud. These integrations simplify similarity queries at scale without separate indexing layers. Enterprises gain the ability to combine text, audio, and image embeddings with transactional data inside a single platform, reducing latency and operational complexity. Early adopters in retail and media use the approach to personalise experiences, while industrial firms employ vector search to refine quality-inspection models. Market entrants emphasise open-source compatibility and orchestrated pipelines that ease model retraining.
Escalating Hyperscaler Egress-Fee Economics
Data-transfer fees can represent 10%-15% of a typical cloud invoice. These charges deter multi-cloud analytics architectures because shifting terabytes between platforms inflates total cost of ownership. The UK Competition and Markets Authority flagged egress fees as a switching barrier. Although some providers have introduced fee waivers under certain conditions, customers still face contractual hurdles. Service integrators now promote architectures that keep large datasets in neutral storage tiers or employ data-in-motion optimisation, such as Rackspace's Data Freedom offering, claiming up to 85% cost reduction.
Other drivers and restraints analyzed in the detailed report include:
- Rising Pay-as-You-Go Demand from SMB Cloud Migrations
- Compliance-Driven Real-Time Audit Analytics
- Shortage of FinOps and Data-Ops Talent
For complete list of drivers and restraints, kindly check the Table Of Contents.
Segment Analysis
Large Enterprises accounted for 64% of 2024 revenue as they leverage deep budgets to deploy enterprise-wide data lakes and advanced modelling tools. Their analytics estates often integrate with long-standing ERP and CRM systems, enabling cross-functional dashboards and AI-driven forecasting. Multi-nationals also prioritise sovereignty controls, leading to region-specific deployments that interconnect via private backbone networks.
SMEs contribute a smaller share today yet will record the highest 24.3% CAGR to 2030. Pay-as-you-go pricing and turnkey templates lower barriers for firms without dedicated data-science teams. No-code interfaces, auto-ML services, and packaged vertical analytics help founders draw insights quickly, supporting inventory optimisation and targeted marketing. As SMB adoption broadens, vendors pilot simplified FinOps consoles that map workload cost to business KPIs, fostering transparent budgeting across finance and operations teams. The influx of SMEs broadens the Analytics as a Service market customer base, encouraging providers to release lightweight service tiers and community-led education.
Public cloud maintained 48.3% of 2024 revenue because its shared infrastructure grants instant elasticity, global reach, and continuous feature upgrades. Start-ups and digital natives rely on fully managed analytics stacks, avoiding data-centre expenditures while accessing the latest AI accelerators. However, firms in regulated industries retain sensitive workloads in private environments to satisfy residency mandates and internal risk policies.
Hybrid architectures are set to expand at a 26.7% CAGR, blending public scalability with private-cloud control. IBM notes that hybrid deployments improve flexibility by letting teams locate data and compute where each performs best. Enterprises commonly stage raw data in private object stores, then burst to public clusters for large-scale model training. This topology mitigates egress fees and supports tiered disaster-recovery postures. As sovereignty requirements rise, providers introduce region-specific sovereign cloud zones and inter-cloud networking services, further reinforcing hybrid appeal within the Analytics as a Service market.
Analytics As A Service Market is Segmented by Enterprise Size (Small and Medium Enterprises and Large Enterprises), Deployment Model (Public Cloud, Private Cloud, and Hybrid Cloud), Analytics Type (Descriptive Analytics, Diagnostic Analytics, and More), End-User Industry (IT and Telecommunication, BFSI, Healthcare and Life-Sciences, and More), and Geography. The Market Forecasts are Provided in Terms of Value (USD).
Geography Analysis
North America held 42.8% of 2024 revenue, anchored by widespread cloud adoption, mature AI talent pools, and constant product innovation from dominant hyperscalers. United States enterprises in healthcare, retail, and media apply large-scale analytics to personalise experiences, optimise logistics, and drive precision medicine. Government agencies also expand data-sharing initiatives that fuel analytic workloads. Canadian organisations follow with fast uptake of sovereign cloud zones that fulfil public-sector data-residency laws. Mexico's manufacturing corridors integrate cloud analytics into export-oriented supply chains, closing operational insight gaps.
Asia-Pacific is projected to produce the highest 25.4% CAGR, driven by aggressive digital-economic agendas in China, Japan, India, and Southeast Asia. Rapidly scaling e-commerce platforms ingest terabytes of behavioural data daily, while fintechs roll out credit models targeting underserved populations. Local cloud providers partner with multinational hyperscalers to build regionally compliant infrastructure, lowering latency and enabling sovereign-ready Analytics as a Service market offerings. Government stimulus programmes for smart-factory rollouts further stimulate demand, and SMEs leverage low-cost service bundles to leapfrog legacy systems.
Europe occupies a significant share shaped by privacy and AI governance frameworks. Strict GDPR enforcement and forthcoming EU AI Act rules push firms to deploy explainable models, audit layers, and sovereign cloud controls. AWS announced a Germany-based corporate entity to operate an independent European Sovereign Cloud with launch targeted for late 2025. Financial institutions implement multi-region redundancy to maintain operational resilience, while manufacturers connect IoT data into analytics pipelines that support energy-efficiency targets. The Analytics as a Service market in Europe thus balances innovation with compliance, promoting hybrid patterns that satisfy both business and regulatory imperatives.
- Amazon Web Services
- Microsoft Corporation
- Google Cloud (Alphabet Inc.)
- IBM Corporation
- SAP SE
- Oracle Corporation
- Hewlett Packard Enterprise
- SAS Institute
- Accenture PLC
- Teradata Corporation
- Snowflake Inc.
- Databricks, Inc.
- Salesforce, Inc.
- Tableau Software, LLC
- QlikTech International AB
- MicroStrategy Incorporated
- TIBCO Software, Inc.
- Alteryx, Inc.
- Splunk Inc.
- Domo, Inc.
- Sisense Ltd.
- ThoughtSpot, Inc.
- Looker Studio (Google)
- GoodData, Inc.
- Zoho Analytics (Zoho Corporation)
Additional Benefits:
- The market estimate (ME) sheet in Excel format
- 3 months of analyst support
TABLE OF CONTENTS
1 INTRODUCTION
- 1.1 Study Assumptions and Market Definition
- 1.2 Scope of the Study
2 RESEARCH METHODOLOGY
3 EXECUTIVE SUMMARY
4 MARKET LANDSCAPE
- 4.1 Market Overview
- 4.2 Market Drivers
- 4.2.1 Cloud-first enterprise data-modernization programmes
- 4.2.2 Proliferation of Gen-AI-ready, vector-native data stores
- 4.2.3 Rising pay-as-you-go demand from SMB cloud migrations
- 4.2.4 Compliance-driven real-time audit analytics (e.g., DORA, SEC)
- 4.2.5 Embedded analytics in vertical SaaS 'mini-clouds'
- 4.2.6 Sovereign-cloud mandates spurring regional AaaS build-outs
- 4.3 Market Restraints
- 4.3.1 Escalating hyperscaler egress-fee economics
- 4.3.2 Shortage of FinOps and data-ops talent
- 4.3.3 Model-explainability regulations delaying roll-outs
- 4.3.4 Carbon-intensity quotas limiting non-green data-centre use
- 4.4 Industry Value Chain Analysis
- 4.5 Regulatory Landscape
- 4.6 Technological Outlook
- 4.7 Key Performance Indicators (KPIs)
- 4.8 Industry Attractiveness - Porter's Five Forces Analysis
- 4.8.1 Threat of New Entrants
- 4.8.2 Bargaining Power of Buyers
- 4.8.3 Bargaining Power of Suppliers
- 4.8.4 Threat of Substitutes
- 4.8.5 Intensity of Competitive Rivalry
- 4.9 Impact of Macroeconomic Factors on the Market
5 MARKET SIZE AND GROWTH FORECASTS (VALUES)
- 5.1 By Enterprise Size
- 5.1.1 Small and Medium Enterprises (SME)
- 5.1.2 Large Enterprises
- 5.2 By Deployment Model
- 5.2.1 Public Cloud
- 5.2.2 Private Cloud
- 5.2.3 Hybrid Cloud
- 5.3 By Analytics Type
- 5.3.1 Descriptive Analytics
- 5.3.2 Diagnostic Analytics
- 5.3.3 Predictive Analytics
- 5.3.4 Prescriptive Analytics
- 5.4 By End-user Industry
- 5.4.1 IT and Telecommunication
- 5.4.2 BFSI
- 5.4.3 Healthcare and Life-Sciences
- 5.4.4 Retail and E-Commerce
- 5.4.5 Manufacturing
- 5.4.6 Energy and Utilities
- 5.4.7 Government and Public Sector
- 5.4.8 Other End-user Industries
- 5.5 By Geography
- 5.5.1 North America
- 5.5.1.1 United States
- 5.5.1.2 Canada
- 5.5.1.3 Mexico
- 5.5.2 South America
- 5.5.2.1 Brazil
- 5.5.2.2 Argentina
- 5.5.2.3 Chile
- 5.5.2.4 Rest of South America
- 5.5.3 Europe
- 5.5.3.1 Germany
- 5.5.3.2 United Kingdom
- 5.5.3.3 France
- 5.5.3.4 Italy
- 5.5.3.5 Spain
- 5.5.3.6 Russia
- 5.5.3.7 Rest of Europe
- 5.5.4 Asia-Pacific
- 5.5.4.1 China
- 5.5.4.2 Japan
- 5.5.4.3 India
- 5.5.4.4 South Korea
- 5.5.4.5 Australia
- 5.5.4.6 Singapore
- 5.5.4.7 Malaysia
- 5.5.4.8 Rest of Asia-Pacific
- 5.5.5 Middle East and Africa
- 5.5.5.1 Middle East
- 5.5.5.1.1 Saudi Arabia
- 5.5.5.1.2 United Arab Emirates
- 5.5.5.1.3 Turkey
- 5.5.5.1.4 Rest of Middle East
- 5.5.5.2 Africa
- 5.5.5.2.1 South Africa
- 5.5.5.2.2 Nigeria
- 5.5.5.2.3 Egypt
- 5.5.5.2.4 Rest of Africa
- 5.5.1 North America
6 COMPETITIVE LANDSCAPE
- 6.1 Market Concentration
- 6.2 Strategic Moves
- 6.3 Market Share Analysis
- 6.4 Company Profiles (includes Global level Overview, Market level overview, Core Segments, Financials as available, Strategic Information, Market Rank/Share for key companies, Products and Services, and Recent Developments)
- 6.4.1 Amazon Web Services
- 6.4.2 Microsoft Corporation
- 6.4.3 Google Cloud (Alphabet Inc.)
- 6.4.4 IBM Corporation
- 6.4.5 SAP SE
- 6.4.6 Oracle Corporation
- 6.4.7 Hewlett Packard Enterprise
- 6.4.8 SAS Institute
- 6.4.9 Accenture PLC
- 6.4.10 Teradata Corporation
- 6.4.11 Snowflake Inc.
- 6.4.12 Databricks, Inc.
- 6.4.13 Salesforce, Inc.
- 6.4.14 Tableau Software, LLC
- 6.4.15 QlikTech International AB
- 6.4.16 MicroStrategy Incorporated
- 6.4.17 TIBCO Software, Inc.
- 6.4.18 Alteryx, Inc.
- 6.4.19 Splunk Inc.
- 6.4.20 Domo, Inc.
- 6.4.21 Sisense Ltd.
- 6.4.22 ThoughtSpot, Inc.
- 6.4.23 Looker Studio (Google)
- 6.4.24 GoodData, Inc.
- 6.4.25 Zoho Analytics (Zoho Corporation)
7 MARKET OPPORTUNITIES AND FUTURE TRENDS
- 7.1 White-Space and Unmet-Need Assessment