


|
시장보고서
상품코드
1693500
미국의 미량영양소 비료 시장 : 시장 점유율 분석, 산업 동향 및 통계, 성장 예측(2025-2030년)United States Micronutrient Fertilizer - Market Share Analysis, Industry Trends & Statistics, Growth Forecasts (2025 - 2030) |
||||||
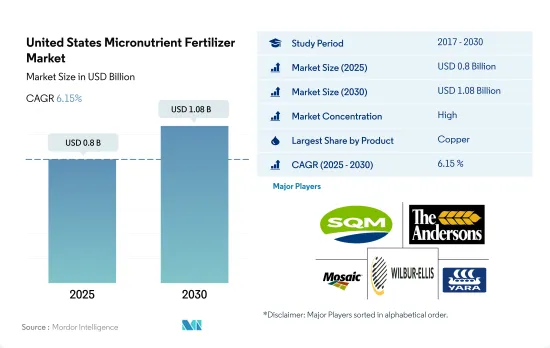
미국의 미량영양소 비료 시장 규모는 2025년에 8억 달러로 추정되고, 2030년에는 10억 8,000만 달러에 이를 것으로 예측되며, 예측 기간(2025-2030년)의 CAGR은 6.15%로 성장할 것으로 예측됩니다.
토양 결핍증의 확대와 균형 잡힌 영양의 필요성이 시장 성장을 가속할 것으로 예측됩니다.
- 토양 양분의 결핍과, 그것이 작물의 건강과 수량에 미치는 영향에 관한 농가의 의식이, 미국의 미량영양소 수요 증가를 촉진하고 있습니다.
- 아연은 미량영양소 비료 시장의 지배적 기업으로서 대두해 2022년 시장 총액의 약 27.3%를 차지했습니다. 2023-2030년 CAGR은 5.2%로 예측되고 있습니다. 특히 아연 결핍증은 워싱턴 과수원, 옥수수, 밀에서 만연하고 있어 성장 저해와 잎의 장애로 이어지고 있습니다. 그 결과 생산자는 더욱더 아연 비료에 눈을 돌리게 되어 있습니다.
- 대부분의 농작물에서는 다양한 환경 요인과 토양 요인에 의해 식물에 대한 철 공급이 제한되어 있습니다. 이 결핍이 철 비료 시장의 성장을 촉진해 2023-2030년 CAGR 3.9%로 예측되고 있습니다.
- 구리는 식물의 효소 활동, 엽록소 합성, 씨앗 생산에 필수적입니다. 밀, 보리, 야채와 같은 농작물은 특히 구리 결핍의 영향을 받기 쉽습니다. 미국에서는 농작물이 농업의 대부분을 차지하고 있기 때문에, 이 분야의 구리 비료의 시장 가치는 2023-2030년 3.7%의 CAGR로 추이할 것으로 예상되고 있습니다.
- 미량영양소는 세포벽 형성, 꽃가루 형성, 발아, 엽록소 생산, 질소 고정, 단백질의 필수 부분 합성 등 많은 식물의 대사 활동에서 중요한 역할을 하고 있습니다. 미량영양소의 비료는 적은 양이지만 균형 잡힌 작물 영양에 중요합니다. 따라서 미량영양소 비료 시장 가치는 2023-2030년 4.0%를 나타낼 것으로 예상됩니다.
미국의 미량영양소 비료 시장 동향
미국에서는 대두과 옥수수가 2대 작물로 재배되고 있습니다.
- 미국에서는 인구가 2020년 3억 3,590만 명에서 2022년에는 3억 3,820만 명으로 증가했습니다. 2000년 이후 농지의 총 면적은 5,000만 에이커 가까이 감소하여 2022년 시점에는 8억 9,340만 에이커에 이르렀습니다. 농지가 한정되어 있다는 것은 농업 투입물을 사용하여 농업 생산성을 높일 필요가 있음을 보여줍니다. 작물의 생산성을 높이기 위해 비료는 오랫동안 사용되어 왔습니다. 미국의 4대 작물은 옥수수, 면화, 대두, 밀이며 2022년 주요 작물 작부 면적의 65.7% 이상을 차지했습니다.
- 대두 및 옥수수는 미국에서 재배되고 있는 2대 작물입니다. 2022년에는 대두 재배 면적이 가장 많아 미국 경지 면적의 25.8%를 차지했고, 그 다음으로 옥수수가 25.7%, 밀이 11.1%였습니다. 이 작물의 대부분은 인디애나 서부, 일리노이, 아이오와, 미주리, 네브래스카, 캔자스 동부를 커버하는 '콘벨트'라고 불리는 지역에서 재배되고 있습니다. 옥수수와 대두 생산이 이 지역을 지배하고 있습니다. 미국 농무부에 따르면 미국은 쌀의 주요 수출국이며, 그 재배의 대부분은 4개 지역에서 이루어지고 있습니다.
- 농업 자재 제조업체는 농가의 정확한 비료 살포를 지원하기 위해 기술 혁신을 하고 있습니다. 이것은 재배비용을 줄일 뿐만 아니라 효율도 향상시킵니다. 미국의 밭농사 분야는 큰 시장의 가능성을 가지고 있습니다. 정부로부터의 자금 원조나 지원의 증가와 맞물려 적극적인 성장이 전망되고 있습니다.
미량영양소는 작물이 생물학적 및 생물학적 스트레스에 대항할 수 있도록 하는 데 매우 중요합니다.
- 미량영양소는 식물의 성장에 필요하며, 작물의 영양에서 중요한 역할을 합니다. 미량영양소 비료에는 붕소, 구리, 망간, 아연, 코발트 등 식물이 미량에 필요로 하는 원소가 포함되어 있습니다. 작물이 필요로 하는 미량영양소는 미국 각지의 토양 조건에 따라 달라집니다. 붕소 결핍은 유기물이 적고 용출되기 쉬운 남동부 사질 토양에서 흔히 볼 수 있습니다.
- 미국에서는 농작물에 미량영양소의 평균 시용량은 1 헥타르 당 4.2kg입니다. 망간은 2022년에는 헥타르당 11.0kg의 시용량이 되어 콩, 밀, 사탕수수, 옥수수와 같은 주요 농작물의 생산성을 높이기 위해 매우 중요합니다. 그 결과 망간이 미량영양소 비료 시장을 독점하며 2022년 총 소비량의 33.0%를 차지했습니다. 망간에 이어 구리와 아연의 시용량은 각각 ha당 7.2kg 및 6.7kg입니다. 이러한 미량영양소는 작물이 생물학적 및 생물학적 스트레스에 대항할 수 있도록 하는 데 매우 중요하며, 인공적인 수단에 의해 그 결핍에 대처하는 것의 중요성을 강조하고 있습니다.
- 2022년에는 농작물 분야가 큰 점유율을 차지하고 미량영양소 비료 시장 전체에 금액으로 87.6%, 수량으로 87.5% 기여했습니다. 이 작물들 중에서는 대두가 헥타르당 4.5kg의 시용률로 1위를 차지했습니다. 지속가능한 농법으로의 전환과 작물의 적절한 성장을 위해 토양 속 미량영양소 수준을 유지할 필요성이 2023-2030년 미국 미량영양소 비료 시장의 성장을 촉진할 것으로 예상됩니다.
미국의 미량영양소 비료 산업 개요
미국의 미량영양소 비료 시장은 상당히 통합되어 있으며 주요 5개사에서 84.13%를 차지하고 있습니다. 이 시장 주요 기업은 다음과 같습니다. Sociedad Quimica y Minera de Chile SA, The Andersons Inc., The Mosaic Company, Wilbur-Ellis Company LLC and Yara International ASA.(알파벳순 정렬)
기타 혜택
- 엑셀 형식 시장 예측(ME) 시트
- 3개월의 애널리스트 서포트
목차
제1장 주요 요약 및 주요 조사 결과
제2장 보고서 제안
제3장 서문
- 조사의 전제조건 및 시장 정의
- 조사 범위
- 조사 방법
제4장 주요 산업 동향
- 주요 작물의 작부 면적
- 농작물
- 원예작물
- 평균 양분 시용률
- 미량영양소
- 농작물
- 원예작물
- 미량영양소
- 관개 설비가 있는 농지
- 규제 프레임워크
- 밸류체인 및 유통 채널 분석
제5장 시장 세분화
- 제품별
- 붕소
- 구리
- 철
- 망간
- 몰리브덴
- 아연
- 기타
- 시비 모드별
- 시비
- 잎면 살포
- 토양
- 작물 유형별
- 농작물
- 원예작물
- 잔디 및 관상용
제6장 경쟁 구도
- 주요 전략 동향
- 시장 점유율 분석
- 기업 상황
- 기업 프로파일
- Haifa Group
- Koch Industries Inc.
- Nouryon
- Sociedad Quimica y Minera de Chile SA
- The Andersons Inc.
- The Mosaic Company
- Wilbur-Ellis Company LLC
- Yara International ASA
제7장 CEO에 대한 주요 전략적 질문
제8장 부록
- 세계 개요
- 개요
- Porter's Five Forces 분석 프레임워크
- 세계의 밸류체인 분석
- 시장 역학(DROs)
- 정보원 및 참고문헌
- 도표 일람
- 주요 인사이트
- 데이터 팩
- 용어집
The United States Micronutrient Fertilizer Market size is estimated at 0.8 billion USD in 2025, and is expected to reach 1.08 billion USD by 2030, growing at a CAGR of 6.15% during the forecast period (2025-2030).

The growing soil deficiency and the need for balanced nutrition is anticipated to drive the growth of the market
- The awareness among farmers regarding soil nutrient deficiencies and their impact on crop health and yields is driving the rising demand for micronutrients in the United States.
- Zinc emerged as the dominant player in the micronutrient fertilizer market, accounting for approximately 27.3% of the total market value in 2022. It is projected to witness a CAGR of 5.2% from 2023 to 2030. Notably, zinc deficiency is prevalent in Washington orchards, maize, and wheat, leading to stunted growth and leaf disorders. Consequently, growers are increasingly turning to zinc fertilizers.
- In most agricultural crops, various environmental and soil factors limit the availability of iron to plants. This scarcity is expected to fuel the growth of the iron fertilizers market, which is projected to register a CAGR of 3.9% from 2023 to 2030.
- Copper is vital for enzymatic activities, chlorophyll synthesis, and seed production in plants. Field crops like wheat, barley, oats, and vegetables are particularly susceptible to copper deficiency. Given that field crops dominate the agricultural landscape in the United States, the market value of copper fertilizers in this segment is anticipated to register a CAGR of 3.7% during 2023-2030.
- Micronutrients play an important role in many plant metabolic activities, such as cell wall formation, pollen formation, germination, chlorophyll production, nitrogen fixation, and synthesis of essential parts of proteins. Even though micronutrient fertilizers are required in less quantity, they are important for balanced crop nutrition. Hence, the micronutrient fertilizer market's value is anticipated to register a CAGR of 4.0% during 2023-2030.
United States Micronutrient Fertilizer Market Trends
Soybean and corn are the two largest crops grown in the United States
- In the United States, the population increased from 335.9 million in 2020 to 338.2 million in 2022. From 2000 onward, the total farmland area has decreased by almost 50 million acres, reaching a total of 893.4 million acres, as of 2022. The limited farmland indicates the need to increase agricultural productivity with the use of agri inputs. Fertilizers have been used for a long time to increase the productivity of crops. The four major crops in the United States are corn, cotton, soybean, and wheat, which accounted for more than 65.7% of the principal crop acreage in 2022.
- Soybean and corn are the two largest crops grown in the United States. In 2022, soybean had the highest area under cultivation, accounting for 25.8% of the total arable land in the United States, followed by corn at 25.7% and wheat at 11.1%. The majority of these crops are grown in a region known as the "Corn Belt," which covers western Indiana, Illinois, Iowa, Missouri, eastern Nebraska, and Eastern Kansas. The production of corn (maize) and soybeans dominates this area. Additionally, the United States is a major exporter of rice, with most of the cultivation happening in four regions, three of which are in the South and one in California, according to the USDA.
- Manufacturers of farm inputs are innovating to aid farmers in precise fertilizer application. This not only trims cultivation costs but also bolsters efficiency. The field crop sector in the United States holds substantial market potential. Coupled with increased government funding and support, it is poised for positive growth.
Micronutrients are pivotal in equipping crops to combat both biotic and abiotic stresses
- Micronutrients are necessary for plant growth and play a critical role in crop nutrition. Micronutrient fertilizers contain trace amounts of elements such as boron, copper, manganese, zinc, and cobalt, which plants require in small amounts. Micronutrient requirements by the crop vary depending on the soil condition across the United States. Boron deficiency is more common in sandy soils of the southeast, which are low in organic matter content and more susceptible to leaching.
- In the United States, the average application rate for micronutrients in field crops stands at 4.2 kg per hectare. Manganese, with an application rate of 11.0 kg per hectare in 2022, is crucial for boosting the productivity of key field crops such as soybean, wheat, sugarcane, and maize. As a result, manganese dominates the micronutrient fertilizer market, accounting for 33.0% of the total consumption in 2022. Following manganese, copper and zinc have application rates of 7.2 and 6.7 kg per hectare, respectively. These micronutrients are pivotal in equipping crops to combat both biotic and abiotic stresses, underscoring the importance of addressing their deficiencies through artificial means.
- In 2022, the field crops segment held the lion's share, contributing 87.6% in value and 87.5% in volume to the overall micronutrient fertilizer market. Among these crops, soybean led the pack with an application rate of 4.5 kg per hectare. The shifting focus toward sustainable methods of farming and the need to maintain micronutrient levels in the soil for the proper growth of crops are expected to drive the US micronutrient fertilizers market's growth during 2023-2030.
United States Micronutrient Fertilizer Industry Overview
The United States Micronutrient Fertilizer Market is fairly consolidated, with the top five companies occupying 84.13%. The major players in this market are Sociedad Quimica y Minera de Chile SA, The Andersons Inc., The Mosaic Company, Wilbur-Ellis Company LLC and Yara International ASA (sorted alphabetically).
Additional Benefits:
- The market estimate (ME) sheet in Excel format
- 3 months of analyst support
TABLE OF CONTENTS
1 EXECUTIVE SUMMARY & KEY FINDINGS
2 REPORT OFFERS
3 INTRODUCTION
- 3.1 Study Assumptions & Market Definition
- 3.2 Scope of the Study
- 3.3 Research Methodology
4 KEY INDUSTRY TRENDS
- 4.1 Acreage Of Major Crop Types
- 4.1.1 Field Crops
- 4.1.2 Horticultural Crops
- 4.2 Average Nutrient Application Rates
- 4.2.1 Micronutrients
- 4.2.1.1 Field Crops
- 4.2.1.2 Horticultural Crops
- 4.2.1 Micronutrients
- 4.3 Agricultural Land Equipped For Irrigation
- 4.4 Regulatory Framework
- 4.5 Value Chain & Distribution Channel Analysis
5 MARKET SEGMENTATION (includes market size in Value in USD and Volume, Forecasts up to 2030 and analysis of growth prospects)
- 5.1 Product
- 5.1.1 Boron
- 5.1.2 Copper
- 5.1.3 Iron
- 5.1.4 Manganese
- 5.1.5 Molybdenum
- 5.1.6 Zinc
- 5.1.7 Others
- 5.2 Application Mode
- 5.2.1 Fertigation
- 5.2.2 Foliar
- 5.2.3 Soil
- 5.3 Crop Type
- 5.3.1 Field Crops
- 5.3.2 Horticultural Crops
- 5.3.3 Turf & Ornamental
6 COMPETITIVE LANDSCAPE
- 6.1 Key Strategic Moves
- 6.2 Market Share Analysis
- 6.3 Company Landscape
- 6.4 Company Profiles
- 6.4.1 Haifa Group
- 6.4.2 Koch Industries Inc.
- 6.4.3 Nouryon
- 6.4.4 Sociedad Quimica y Minera de Chile SA
- 6.4.5 The Andersons Inc.
- 6.4.6 The Mosaic Company
- 6.4.7 Wilbur-Ellis Company LLC
- 6.4.8 Yara International ASA
7 KEY STRATEGIC QUESTIONS FOR FERTILIZER CEOS
8 APPENDIX
- 8.1 Global Overview
- 8.1.1 Overview
- 8.1.2 Porter's Five Forces Framework
- 8.1.3 Global Value Chain Analysis
- 8.1.4 Market Dynamics (DROs)
- 8.2 Sources & References
- 8.3 List of Tables & Figures
- 8.4 Primary Insights
- 8.5 Data Pack
- 8.6 Glossary of Terms
