


|
시장보고서
상품코드
1693534
아시아태평양의 미량영양소 비료 시장 : 점유율 분석, 산업 동향, 성장 예측(2025-2030년)Asia-Pacific Micronutrient Fertilizer - Market Share Analysis, Industry Trends & Statistics, Growth Forecasts (2025 - 2030) |
||||||
■ 보고서에 따라 최신 정보로 업데이트하여 보내드립니다. 배송일정은 문의해 주시기 바랍니다.
가격
※ 부가세 별도
한글목차
영문목차
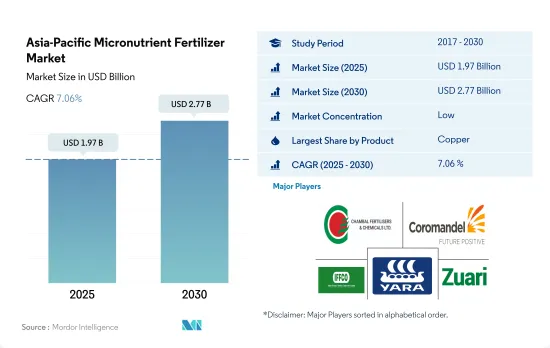
아시아태평양의 미량영양소 비료 시장 규모는 2025년에는 19억 7,000만 달러, 2030년에는 27억 7,000만 달러에 이를 것으로 예측되며, 예측 기간 중(2025-2030년) CAGR은 7.06%를 나타낼 전망입니다.
의식 증가와 농업 생산의 중요성은 이 지역 시장을 견인 할 수 있습니다.
- 붕소는 이 지역에서 가장 소비되고 있는 미량영양소이며, 2022년의 소비량 점유율은 26.5%였습니다.
- 아시아태평양에서는 아연이 소비량의 점에서 2위 시장 점유율을 차지했으며, 그 점유율은 26.2%, 2022년의 수량은 15만 9,100톤이었습니다.
- 구리는 2022년의 아시아태평양의 미량영양소 시장의 28.6%를 차지합니다.소량에서도 필요로 하는 중요한 미량영양소입니다.
- 철은 이 지역에서 3번째로 소비량이 많은 미량영양소이며, 2022년에는 전체 미량영양소 중 20.8%의 점유율을 차지합니다.
- 따라서, 보다 높은 수율과 생산성의 필요성, 작물 재배에 있어서의 미량영양소의 중요성에 관한 농업 종사자의 지식의 고조등의 요인 덕분에, 이 지역의 미량영양소 시장은 2023-2030년 사이에 CAGR 6.8%로 성장할 것으로 예측됩니다.
영양 부족과 영양 불량 문제에 관한 농업 종사자의 의식의 고조가 시장을 견인할 가능성
- 2022년에는 인도와 중국이 아시아태평양의 미량영양소 비료 시장의 지배적 진출기업으로 부상하여 각각 시장 점유율의 41.7%와 31.7%를 획득했습니다. 과학 및 환경 센터(CSE)는 인도의 토양 결함을 강조했으며, 붕소가 47%, 철이 37%, 아연이 39%로 가장 현저하다는 것을 밝혔습니다.
- 중국 정부는 비료의 과잉사용의 중대성을 인식하고 "비료사용 증가 제로를 위한 행동계획"을 도입했습니다.
- 연구에서는 일관되게 한국, 말레이시아, 대만 등의 국가에서 붕소 결핍의 만연이 강조되어 왔습니다.
- 아시아태평양식품비료기술센터는 황산철 0.5%, 황산망간 0.1%, 황산동 0.1% 등의 미량영양소를 엽면 살포함으로써 작물의 결핍 증상이 효과적으로 완화되는 것을 확인하고 있습니다.
- 식량안전보장 확보가 급무이기 때문에 아시아태평양의 미량영양소 비료 수요는 2023-2030년 사이에 6.8%의 견고한 CAGR로 성장할 것으로 예측되고 있습니다.
아시아태평양 미량영양소 비료 시장 동향
주요 성장 작물 재배가 크게 확대되고 비료 시장 성장이 예상된다.
- 아시아태평양에서는 농작물이 재배면적 전체의 95% 이상을 차지하고 있습니다.
- 중국, 인도, 파키스탄, 호주를 포함한 아시아태평양은 세계 최대의 밀 생산국 중 하나입니다. 중국과 인도는 세계 최대의 밀 생산국이며 소비국이기도 합니다. 특히 밀의 재배면적은 2018-2022년에 걸쳐 63만 8,600ha 증가했습니다.
- 쌀은 이 지역에서 가장 큰 농작물입니다.그 재배 면적만으로 2022년의 전체 농지 면적의 약 16.44%를 차지하고 있습니다. 쌀은 아시아와 태평양의 대부분의 지역에서 주식이 되고 있습니다. 700만 톤의 쌀을 생산하고 인도는 1억 2,400만 톤의 쌀을 수확할 것으로 예측되고 있습니다.
- 농작물에 대한 국내외 수요의 급증은 농작물 전용의 경작면적 확대를 촉진하고 있습니다.
2022년 평균 양분 시용량은 유채, 카놀라가 9.2kg/헥타르에서 가장 많다.
- 고수량 작물의 양분 제거 속도가 가속되어 있기 때문에 미량영양소 수요가 최근 성장하고 있습니다. 납, 망간, 구리는 밭작물에 주로 시용되는 양분의 주요 유형로, 2022년에는 각각 12kg/헥타르, 9.1kg/헥타르, 7.2kg/헥타르를 차지할 것으로 추정됩니다.
- 신흥 국가의 농업 관계자들 사이에서는 미량영양소 비료를 사용하는 이점에 대한 인식이 부족하고, 이러한 비료 구입과 관련된 비용이 높은 것이 이 지역에서의 미량영양소 비료의 성장을 제한하는 요인이 되고 있습니다.
- 작물 유형별로는 2022년 평균 양분 시용량이 가장 많은 것은 유채, 카놀라에서 9.2kg/헥타르, 이어서 옥수수가 6.7kg/헥타르, 쌀이 5.4kg/헥타르입니다. 다른 밀의 경우, 주요 미량영양소의 결핍은 구리와 망간입니다.
- 농업 종사자가 작물 헥타르당에서 보다 많은 수확을 얻는 것을 목표로 하고 있기 때문에 작물 생산에 있어서의 미량영양소의 인기는 급속히 높아지고 있습니다.
아시아태평양의 미량영양소 비료 산업 개요
아시아태평양의 미량영양소 비료 시장은 세분화되어 있으며 상위 5개 기업에서 28.85%를 차지하고 있습니다.
기타 혜택
- 엑셀 형식 시장 예측(ME) 시트
- 3개월의 애널리스트 서포트
목차
제1장 주요 요약과 주요 조사 결과
제2장 보고서 제안
제3장 소개
- 조사의 전제조건과 시장 정의
- 조사 범위
- 조사 방법
제4장 주요 산업 동향
- 주요 작물의 작부 면적
- 밭작물
- 원예작물
- 평균 양분 시용률
- 미량영양소
- 밭작물
- 원예작물
- 미량영양소
- 관개 설비가 있는 농지
- 규제 프레임워크
- 밸류체인과 유통채널 분석
제5장 시장 세분화
- 제품
- 붕소
- 구리
- 철
- 망간
- 몰리브덴
- 아연
- 기타
- 적용방법
- 시비
- 잎면 살포
- 토양
- 작물 유형
- 밭작물
- 원예작물
- 잔디 및 관상용
- 생산국
- 호주
- 방글라데시
- 중국
- 인도
- 인도네시아
- 일본
- 파키스탄
- 필리핀
- 태국
- 베트남
- 기타 아시아태평양
제6장 경쟁 구도
- 주요 전략 동향
- 시장 점유율 분석
- 기업 상황
- 기업 프로파일
- Chambal Fertilizers & Chemicals Ltd
- Coromandel International Ltd.
- Grupa Azoty SA(Compo Expert)
- Haifa Group
- ICL Group Ltd
- Indian Farmers Fertiliser Cooperative Limited
- Yara International ASA
- Zuari Agro Chemicals Ltd
제7장 CEO에 대한 주요 전략적 질문
제8장 부록
- 세계 개요
- 개요
- Five Forces 분석 프레임워크
- 세계의 밸류체인 분석
- 시장 역학(DROs)
- 정보원과 참고문헌
- 도표 일람
- 주요 인사이트
- 데이터 팩
- 용어집
The Asia-Pacific Micronutrient Fertilizer Market size is estimated at 1.97 billion USD in 2025, and is expected to reach 2.77 billion USD by 2030, growing at a CAGR of 7.06% during the forecast period (2025-2030).

Growing awareness and their importance in the agriculture production may drive the market in the region
- Boron was the most consumed micronutrient in the region, with a consumption volume share of 26.5% in 2022. The majority of boron consumption is attributed to the region's soils, which have reduced water content and higher nitrogen levels that limit boron uptake by plants, leading to increased utilization of boron micronutrients.
- In Asia-Pacific, zinc held the second-largest market share in terms of consumption, with a share of 26.2% and a volume of 159.1 thousand metric tons in 2022. The demand for zinc is anticipated to continue rising in the coming years due to its vital role in the growth and development of plants.
- Copper accounted for 28.6% of the Asia-Pacific micronutrient market's value in the region in 2022. It is an important micronutrient needed in small quantities. It acts as a catalyst in many important plant reactions during growth and plays a key role in protein formation.
- Iron was the third most-consumed micronutrient fertilizer in the region, accounting for a 20.8% share among all micronutrients in 2022. Iron plays an important role in a plant's growth and development as it contains many enzymes and acts as a catalyst in chlorophyll formation. The growing iron deficiency in the soil is expected to fuel the growth of the market.
- Hence, owing to factors like the need for higher yield and productivity and the growing knowledge among farmers about their importance in crop cultivation, the market for micronutrients in the region is anticipated to grow between 2023 and 2030 with a value CAGR of 6.8%.
Nutrient deficiencies and growing awareness among farmers regarding malnutrition problems may drive the market
- In 2022, India and China emerged as the dominant players in the Asia-Pacific micronutrient fertilizer market, capturing 41.7% and 31.7% of the market share, respectively. The Centre for Science and Environment (CSE) highlighted India's soil deficiencies, with boron, iron, and zinc being the most prominent, at 47%, 37%, and 39% respectively. This makes India the leading market in the region, although it fares better in terms of copper and manganese deficiencies.
- Recognizing the gravity of fertilizer overuse, the Chinese government introduced the "Action Plan for the Zero Increase of Fertilizer Use." This regulation has curtailed the usage of fertilizers, including micronutrient variants. Consequently, the growth rate of micronutrients, especially in the field crops segment, has been limited to a modest CAGR of 3.8%.
- Studies have consistently highlighted the prevalence of boron deficiency in countries like Korea, Malaysia, and Taiwan. This deficiency is particularly pronounced in volcanic, acidic, and calcareous soils, significantly impacting crops like peanuts, soybeans, papaya, and citrus. As a result, the market for boron micronutrient fertilizers has witnessed a surge.
- The Food and Fertilizer Technology Centre for the Asian and Pacific Region has observed that applying micronutrients through the foliar mode, such as 0.5% iron sulfate, manganese sulfate, and 0.1% copper sulfate, at the recommended dosages, effectively mitigates crop deficiency symptoms.
- Given the imperative of ensuring food security, the demand for micronutrient fertilizers in Asia-Pacific is projected to register a robust CAGR of 6.8% during 2023-2030.
Asia-Pacific Micronutrient Fertilizer Market Trends
The significant expansion in the cultivation of major growing crops is anticipated to boost the growth of the fertilizers market
- Field crop cultivation dominates the Asia-Pacific region, accounting for more than 95% of the total crop area. Rice, wheat, and corn are the major field crops produced in the region, together accounting for about 38% of the total crop area in 2022. The rising area under cultivation is expected to increase the need for fertilizer usage in the country.
- The Asia-Pacific region, which include China, India, Pakistan, and Australia, is among the world's largest wheat producers. China and India are also the world's largest wheat producers and consumers. Wheat is one of the major staple foods of this region, driving the increase increase in demand and consumption. Notably, the area under wheat cultivation increased by 638.6 thousand ha from 2018 to 2022. In 2022, China accounted for the production of 138 million metric tons of wheat, making it the largest wheat producer in the world, and India recorded wheat production of 103 million metric tons.
- Rice is the largest cultivated field crop in the region. Its cultivation alone accounted for about 16.44% of the total agricultural land in 2022. Rice is the staple food of Asia and most parts of the Pacific region. China was projected to produce 147 million tons of rice, and India was expected to harvest 124 million tons of rice in 2022. India was also expected to consume 109 million tons while exporting a world-leading 19.5 million tons.
- The surge in both domestic and international demand for field crops has prompted an expansion in the cultivation area dedicated to these crops. This significant increase in cultivated land is expected to have a direct and positive impact on the Asia-Pacific fertilizer market throughout the 2023-2030 period.
Rapeseed/canola accounted for the highest average nutrient application rate of 9.2 kg/hectare in 2022
- The demand for micronutrients has grown in recent years due to the accelerated rates of nutrient removal in high-yielding crops. Micronutrient deficiency is widespread in Asia-Pacific, which is one of the major regions affected by this deficiency. Zinc, manganese, and copper are estimated to be the major types of nutrients applied largely for field crops, accounting for 12 kg/hectare, 9.1 kg/hectare, and 7.2 kg/hectare, respectively, in 2022.
- The lack of awareness about the benefits of using micronutrient fertilizers among the farming community in developing countries and the high cost associated with the purchase of these fertilizers are some of the factors limiting the growth of micronutrient fertilizers in the region.
- By crop type, rapeseed/canola accounted for the highest average nutrient application rate of 9.2 kg/hectare in 2022, followed by corn/maize and rice, accounting for 6.7 kg/hectare and 5.4 kg/hectare, respectively. The impact of specific micronutrients differs among crops and across the region. For instance, in the case of wheat, the major micronutrient deficiencies are copper and manganese. In countries like China, India, and Japan, boron and molybdenum are identified as deficient in wheat. Similarly, in rapeseed/canola, the major deficiencies are zinc, manganese, and copper.
- As farmers aim to get more out of every planted hectare, the popularity of micronutrients in the production of crops has increased rapidly in the recent past. High micronutrient deficiency and increasing demand for crops have encouraged farmers to adopt more micronutrients to increase soil health and enhance crop productivity.
Asia-Pacific Micronutrient Fertilizer Industry Overview
The Asia-Pacific Micronutrient Fertilizer Market is fragmented, with the top five companies occupying 28.85%. The major players in this market are Chambal Fertilizers & Chemicals Ltd, Coromandel International Ltd., Indian Farmers Fertiliser Cooperative Limited, Yara International ASA and Zuari Agro Chemicals Ltd (sorted alphabetically).
Additional Benefits:
- The market estimate (ME) sheet in Excel format
- 3 months of analyst support
TABLE OF CONTENTS
1 EXECUTIVE SUMMARY & KEY FINDINGS
2 REPORT OFFERS
3 INTRODUCTION
- 3.1 Study Assumptions & Market Definition
- 3.2 Scope of the Study
- 3.3 Research Methodology
4 KEY INDUSTRY TRENDS
- 4.1 Acreage Of Major Crop Types
- 4.1.1 Field Crops
- 4.1.2 Horticultural Crops
- 4.2 Average Nutrient Application Rates
- 4.2.1 Micronutrients
- 4.2.1.1 Field Crops
- 4.2.1.2 Horticultural Crops
- 4.2.1 Micronutrients
- 4.3 Agricultural Land Equipped For Irrigation
- 4.4 Regulatory Framework
- 4.5 Value Chain & Distribution Channel Analysis
5 MARKET SEGMENTATION (includes market size in Value in USD and Volume, Forecasts up to 2030 and analysis of growth prospects)
- 5.1 Product
- 5.1.1 Boron
- 5.1.2 Copper
- 5.1.3 Iron
- 5.1.4 Manganese
- 5.1.5 Molybdenum
- 5.1.6 Zinc
- 5.1.7 Others
- 5.2 Application Mode
- 5.2.1 Fertigation
- 5.2.2 Foliar
- 5.2.3 Soil
- 5.3 Crop Type
- 5.3.1 Field Crops
- 5.3.2 Horticultural Crops
- 5.3.3 Turf & Ornamental
- 5.4 Country
- 5.4.1 Australia
- 5.4.2 Bangladesh
- 5.4.3 China
- 5.4.4 India
- 5.4.5 Indonesia
- 5.4.6 Japan
- 5.4.7 Pakistan
- 5.4.8 Philippines
- 5.4.9 Thailand
- 5.4.10 Vietnam
- 5.4.11 Rest of Asia-Pacific
6 COMPETITIVE LANDSCAPE
- 6.1 Key Strategic Moves
- 6.2 Market Share Analysis
- 6.3 Company Landscape
- 6.4 Company Profiles
- 6.4.1 Chambal Fertilizers & Chemicals Ltd
- 6.4.2 Coromandel International Ltd.
- 6.4.3 Grupa Azoty S.A. (Compo Expert)
- 6.4.4 Haifa Group
- 6.4.5 ICL Group Ltd
- 6.4.6 Indian Farmers Fertiliser Cooperative Limited
- 6.4.7 Yara International ASA
- 6.4.8 Zuari Agro Chemicals Ltd
7 KEY STRATEGIC QUESTIONS FOR FERTILIZER CEOS
8 APPENDIX
- 8.1 Global Overview
- 8.1.1 Overview
- 8.1.2 Porter's Five Forces Framework
- 8.1.3 Global Value Chain Analysis
- 8.1.4 Market Dynamics (DROs)
- 8.2 Sources & References
- 8.3 List of Tables & Figures
- 8.4 Primary Insights
- 8.5 Data Pack
- 8.6 Glossary of Terms
