


|
시장보고서
상품코드
1693528
북미의 미량영양소 비료 시장 : 점유율 분석, 산업 동향, 성장 예측(2025-2030년)North America Micronutrient Fertilizer - Market Share Analysis, Industry Trends & Statistics, Growth Forecasts (2025 - 2030) |
||||||
■ 보고서에 따라 최신 정보로 업데이트하여 보내드립니다. 배송일정은 문의해 주시기 바랍니다.
가격
※ 부가세 별도
한글목차
영문목차
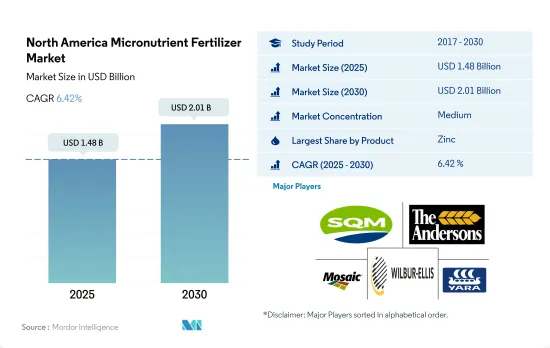
북미의 미량영양소 비료 시장 규모는 2025년에 14억 8,000만 달러, 2030년에는 20억 1,000만 달러에 이를 것으로 예측되며, 예측 기간(2025-2030년)의 CAGR은 6.42%를 나타낼 전망입니다.
재배 확대와 품질과 수율을 향상시키기 위한 미량영양소의 필요성은 미량영양소 수요를 촉진할 것으로 예측됩니다.
- 미량영양소는 식물의 성장에 불가결합니다. 밸런스가 취해진 작물 영양에 있어서 중요한 역할을 하고 있습니다.
- 작물 유형별로는 농작물이 2022년에 12억 6,000만 달러의 최고액과 39만 9,200톤의 소비량을 기록했습니다.
- 기존의 미량영양소 비료 부문은 시장 점유율의 79.0%를 차지하고 2022년에는 11억 2,000만 달러에 달했습니다. 2030년까지 15억 7천만 달러에 이를 것으로 예상됩니다. 특수 비료 부문은 21.0%를 차지해, 2022년에는 2억 9,870만 달러에 달했습니다.
- 2022년, 아연은 북미의 미량영양소 비료 시장 전체의 27.0%를 차지하고, 미량영양소 중에서 가장 큰 가치를 가지고 있습니다.아연은 식물 효소계의 주요 성분입니다. 아연은 다양한 종류의 효소를 활성화하여 탄수화물 대사를 촉진하는 데 도움이 됩니다
- 구리는 2022년 북미의 미량영양소 비료 시장의 17.3%를 차지합니다.
토양의 비옥도와 영양 부족을 개선할 필요성이 시장 성장을 가속
- 9,880만 헥타르 가까운 농지를 가진 미국은 북미에서 최고의 농업 생산국입니다.
- 2022년 미국의 작물 재배 면적은 전년 대비 1% 증가한 1억 3,970만 헥타르에 이르렀습니다.
- 북미에서 두 번째로 큰 농지 소유국인 캐나다는 약 3,090만 헥타르를 자랑합니다. 2022년에는 캐나다가 이 지역의 미량영양소 비료 시장에서 14.2%의 점유율을 차지하고 있었습니다. 캐나다 농지의 88.0% 이상이 작물 경작용이며, 대초원 지역, 퀘벡주, 온타리오주 남부에 집중되어 있습니다.
- 2022년에는 멕시코가 미량영양소 비료시장의 중요한 참가기업으로 대두해 시장금액으로 26.6%, 수량으로 26.4%의 점유율을 획득했습니다. 농작물은 멕시코의 미량영양소 비료 시장을 장악하여 전체 생산량의 88.3%를 차지했습니다. 원예 작물이 7.0%로 그 뒤를 이었고, 잔디 및 관상용 작물이 나머지의 4.7%를 차지했습니다.
- 다른 북미 국가들은 2022년 미량영양소 비료 시장 전체의 2.4%를 차지했습니다.
- 북미의 미량영양소 비료 시장은 꾸준한 성장 궤도에 있으며, 앞으로도 확대가 계속될 것으로 예측됩니다.
북미의 미량영양소 비료 시장 동향
보조금 등 정부 지원이 농작물 확대에 기여
- 북미의 농장에서는 다양한 작물이 재배되고 있으며, 주로 밭작물이 재배되고 있습니다. 다, 멕시코는 이 지역의 농업생산에 크게 공헌하고 있습니다.
- 국가별로는 미국이 작물재배면적 전체의 1억 3,570만 헥타르를 차지하고 시장을 독점하고 있습니다. 2018-2019년에 걸쳐, 이 나라는 작물 재배 면적의 대폭적인 침체를 목격했지만, 이것은 주로 텍사스주나 휴스턴 등의 지역에서 대홍수가 발생한 것에 의한 불리한 환경 조건에 의한 것이었습니다.
- 가장 큰 재배 작물은 옥수수이며, 대부분은 "옥수수 벨트"로 알려진 지역에서 재배됩니다. 옥수수 벨트는 미국 중서부의 전통적인 지역으로 인디애나주 서부, 일리노이주, 아이오와주, 미주리주, 네브래스카주 동부, 캔자스주 동부를 거의 커버하고, 옥수수(메이즈)와 콩이 주요 작물이 되고 있습니다. 미국은 미국의 주요 수출국이기도 합니다. 이 지역의 벼농사는 주로 4개 지역에 집중되어 있으며, 그 중 3개는 남부에, 1개는 캘리포니아에 있습니다. 따라서 이 지역의 농작물 시장 잠재력 증가는 정부의 자금 지원과 보호 강화와 함께 이 지역의 농작물 재배 면적을 긍정적으로 추진할 것으로 예측됩니다.
미량영양소의 결핍과 작물 손실 증가는 미량영양소의 살포율을 증가시킵니다.
- 2022년에는 망간, 구리, 아연, 철, 붕소의 적용률이 가장 높았으며 각각 10.6kg/ha, 6.9kg/ha, 6.8kg/ha, 3.3kg/ha, 1.5kg/ha였습니다. 대부분의 미량영양소는 작물에 대한 흡수율이 낮지만 식물을 사용할 수 없으면 식물의 중요한 기능이 현저하게 제한되어 비정상, 성장 불량 및 수율 감소로 이어집니다. 수율, 상품 가격 및 투입 비용이 증가함에 따라 생산자는 미량영양소의 결핍을 포함한 곡물 생산에 대한 잠재적 장애를 조사했습니다.
- 미량영양소의 비료 소비량은 밀, 설엄, 콩, 면화가 대부분을 차지하고, 옥수수와 쌀 등 다른 농작물의 역할은 작습니다. 특히 밀은 구리와 망간의 현저한 결핍에 직면하고 있으며, 철과 아연의 결핍도 수율에 가벼운 영향을 미칩니다.
- 각 작물에 필요한 미량영양소는 지역 토양 조건에 영향을 받습니다. 미국에서는 유기물이 적고 용출되기 쉬운 남동부의 모래 토양에서는 북동부의 비옥한 흑색 토양과 달리 일반적으로 붕소가 부족합니다. 마찬가지로 캐나다 앨버타 주 중부의 일부 밭에서는 곡물 재배에 필수적인 구리가 부족합니다.
- 멕시코의 농업 토양은 모두 아연 결핍증입니다.그러나, 이 상태는 케레타로주, 소노라주, 시나로아주에서 보다 일반적이며, 아연 미량영양소 비료의 필요성이 높아지고 있는 것을 나타내고 있습니다.북미의 토양은 원래 미량영양소가 부족해 재배 중 미량영양소 보충제의 소비가 증가합니다.
북미의 미량영양소 비료 산업 개요
북미의 미량영양소 비료 시장은 적당히 통합되어 있으며 상위 5개 기업에서 63.51%를 차지하고 있습니다.
기타 혜택
- 엑셀 형식 시장 예측(ME) 시트
- 3개월의 애널리스트 서포트
목차
제1장 주요 요약과 주요 조사 결과
제2장 보고서 제안
제3장 소개
- 조사의 전제조건과 시장 정의
- 조사 범위
- 조사 방법
제4장 주요 산업 동향
- 주요 작물의 작부 면적
- 밭작물
- 원예작물
- 평균 양분 시용률
- 미량영양소
- 밭작물
- 원예작물
- 미량영양소
- 관개 설비가 있는 농지
- 규제 프레임워크
- 밸류체인과 유통채널 분석
제5장 시장 세분화
- 제품
- 붕소
- 구리
- 철
- 망간
- 몰리브덴
- 아연
- 기타
- 적용방법
- 시비
- 잎면 살포
- 토양
- 작물 유형
- 밭작물
- 원예작물
- 잔디 및 관상용
- 생산국
- 캐나다
- 멕시코
- 미국
- 기타 북미
제6장 경쟁 구도
- 주요 전략 동향
- 시장 점유율 분석
- 기업 상황
- 기업 프로파일
- Haifa Group
- Koch Industries Inc.
- Nouryon
- Sociedad Quimica y Minera de Chile SA
- The Andersons Inc.
- The Mosaic Company
- Wilbur-Ellis Company LLC
- Yara International ASA
제7장 CEO에 대한 주요 전략적 질문
제8장 부록
- 세계 개요
- 개요
- Five Forces 분석 프레임워크
- 세계의 밸류체인 분석
- 시장 역학(DROs)
- 정보원과 참고문헌
- 도표 일람
- 주요 인사이트
- 데이터 팩
- 용어집
The North America Micronutrient Fertilizer Market size is estimated at 1.48 billion USD in 2025, and is expected to reach 2.01 billion USD by 2030, growing at a CAGR of 6.42% during the forecast period (2025-2030).

Expansion of cultivation and the need for micronutrients to enhance quality and yield are anticipated to drive the demand for micronutrients
- Micronutrients are essential for plant growth. They play an important role in balanced crop nutrition. The lack of any of the micronutrients may limit plant growth. Micronutrient fertilizers contain elements like boron, copper, manganese, zinc, and cobalt. Plants require these substances in small quantities.
- By crop type, field crops recorded the highest value of USD 1.26 billion and a consumption volume of 399.2 thousand metric tons in 2022. Field crops accounted for about 88.7% of agricultural land in North America during the same period.
- The conventional micronutrient fertilizers segment accounted for 79.0% of the market share and was valued at USD 1.12 billion in 2022. It is anticipated to reach USD 1.57 billion by 2030. The specialty fertilizers segment accounted for 21.0% and was valued at USD 298.7 million in 2022. It is expected to reach USD 435.1 million by the end of 2030.
- In 2022, zinc accounted for 27.0% of the total micronutrient fertilizer market in North America and is the largest valued micronutrient. Zinc is a major component of plant enzyme systems. Zinc aids in the activation of various types of enzymes, boosting carbohydrate metabolism. Zinc deficiency is particularly common in Washington orchards, maize, and wheat, and it primarily causes stunted growth and little leaf disorder.
- Copper accounted for 17.3% of the North American micronutrient fertilizers market in 2022. Copper deficiency is becoming more widespread across Western Canada, limiting the growth of the crop and reducing yield potential because the natural stores of copper have been depleted by plants that take up copper in higher amounts. The copper fertilizer market is anticipated to witness a CAGR of 5.3% during 2023-2030.
The need to improve soil fertility and nutrient deficiency will fuel the growth of the market
- With nearly 98.8 million hectares of agricultural land, the United States dominates as North America's top agriculture producer. In 2022, the US commanded a significant 56.9% share of the North American market for micronutrient fertilizers.
- In 2022, crop cultivation in the US covered 139.7 million hectares, a 1% increase from the previous year. This expansion in cultivated areas has coincided with a growing reliance on micronutrient fertilizers, driven by escalating soil nutrient deficiencies.
- Canada, the second-largest agricultural landowner in North America, boasted around 30.9 million hectares. In 2022, Canada held a 14.2% share of the region's micronutrient fertilizer market. Over 88.0% of Canada's agricultural land is dedicated to crops, with notable concentrations in the Prairies, Quebec, and Southern Ontario.
- In 2022, Mexico emerged as a significant player in the micronutrient fertilizer market, capturing a 26.6% share in market value and 26.4% in volume. Field crops dominated Mexico's micronutrient fertilizer market, accounting for 88.3% of the total volume. Horticulture crops followed at 7.0%, with turf & ornamental crops making up the remaining 4.7%. Key field crops in Mexico include corn, sugarcane, and wheat.
- Other North American countries collectively contributed 2.4% to the total micronutrient fertilizer market value in 2022. Nations like the Dominican Republic, El Salvador, and Nicaragua, in this segment, rely on fertilizer imports and heavily depend on imported agricultural commodities.
- The North American micronutrient fertilizer market is on a steady growth trajectory and is projected to continue expanding in the coming years. This growth is driven by the increasing recognition of micronutrients' pivotal role in ensuring robust crop growth.
North America Micronutrient Fertilizer Market Trends
Government support, such as subsidies, contributed to the expansion of field crops
- A wide array of crops are grown on North American farms, mainly covering field crops. Corn, cotton, rice, soybean, and wheat are some of the dominating field crops across the region. The United States, Canada, and Mexico are major contributors to the region's agricultural output. In 2022, field crops covered around 97.6% of the overall cultivation in North America, with cereals and oilseeds dominating the market.
- By country, the United States dominates the market by covering 135.7 million hectares of the overall area under crop cultivation. Among them, field crops and horticulture cover the majority of the area and accounted for 97.2% and 2.8% in the year 2022. However, between 2018-2019, the country witnessed a significant dip in crop acreages, which was mainly due to unfavorable environmental conditions resulting in heavy floods in areas like Texas and Houston.
- The largest crop cultivated is corn, the majority of which is grown in a region known as the 'Corn Belt'-a traditional area in the Midwestern United States, roughly covering western Indiana, Illinois, Iowa, Missouri, eastern Nebraska, and eastern Kansas, where corn (maize) and soybeans are the dominant crops. The United States is also a major rice exporter. The rice cultivation in the region is mainly concentrated within four regions, with three in the South and one in California. Therefore, the increased market potential for the region's field crop, coupled with increased government funding and protection, is anticipated to positively drive the area under field crop cultivation in the region.
Raising micronutrient deficiencies and crop losses increase micronutrient application rates
- In 2022, the highest application rates were observed for manganese, copper, zinc, iron, and boron, at 10.6 kg/ha, 6.9 kg/ha, 6.8 kg/ha, 3.3 kg/ha, and 1.5 kg/ha, respectively. Although most micronutrients have lower crop uptake, their unavailability can severely limit critical plant functions, leading to abnormalities, stunted growth, and reduced yields. Given the rising yields, commodity prices, and input costs, growers are scrutinizing potential barriers to grain production, including micronutrient deficiencies.
- Wheat, sorghum, soybean, and cotton dominate micronutrient fertilizer consumption, with other field crops like corn and rice playing a smaller role. Wheat, in particular, faces significant deficiencies in copper and manganese, while iron and zinc deficiencies also mildly impact its yield.
- The micronutrient requirements of each crop are influenced by regional soil conditions. In the United States, sandy soils in the southeast, which are low in organic matter and prone to leaching, commonly exhibit boron deficiencies, unlike the fertile black soils in the northeast. Similarly, certain fields in Central Alberta, Canada, face copper deficiencies, which are crucial for cereal cultivation.
- All agricultural soils in Mexico are zinc-deficient. However, this condition is more common in Queretaro, Sonora, and Sinaloa, indicating an increased need for zinc micronutrient fertilizers. North American soil is naturally deficient in micronutrients, leading to increased consumption of micronutrient supplements during cultivation.
North America Micronutrient Fertilizer Industry Overview
The North America Micronutrient Fertilizer Market is moderately consolidated, with the top five companies occupying 63.51%. The major players in this market are Sociedad Quimica y Minera de Chile SA, The Andersons Inc., The Mosaic Company, Wilbur-Ellis Company LLC and Yara International ASA (sorted alphabetically).
Additional Benefits:
- The market estimate (ME) sheet in Excel format
- 3 months of analyst support
TABLE OF CONTENTS
1 EXECUTIVE SUMMARY & KEY FINDINGS
2 REPORT OFFERS
3 INTRODUCTION
- 3.1 Study Assumptions & Market Definition
- 3.2 Scope of the Study
- 3.3 Research Methodology
4 KEY INDUSTRY TRENDS
- 4.1 Acreage Of Major Crop Types
- 4.1.1 Field Crops
- 4.1.2 Horticultural Crops
- 4.2 Average Nutrient Application Rates
- 4.2.1 Micronutrients
- 4.2.1.1 Field Crops
- 4.2.1.2 Horticultural Crops
- 4.2.1 Micronutrients
- 4.3 Agricultural Land Equipped For Irrigation
- 4.4 Regulatory Framework
- 4.5 Value Chain & Distribution Channel Analysis
5 MARKET SEGMENTATION (includes market size in Value in USD and Volume, Forecasts up to 2030 and analysis of growth prospects)
- 5.1 Product
- 5.1.1 Boron
- 5.1.2 Copper
- 5.1.3 Iron
- 5.1.4 Manganese
- 5.1.5 Molybdenum
- 5.1.6 Zinc
- 5.1.7 Others
- 5.2 Application Mode
- 5.2.1 Fertigation
- 5.2.2 Foliar
- 5.2.3 Soil
- 5.3 Crop Type
- 5.3.1 Field Crops
- 5.3.2 Horticultural Crops
- 5.3.3 Turf & Ornamental
- 5.4 Country
- 5.4.1 Canada
- 5.4.2 Mexico
- 5.4.3 United States
- 5.4.4 Rest of North America
6 COMPETITIVE LANDSCAPE
- 6.1 Key Strategic Moves
- 6.2 Market Share Analysis
- 6.3 Company Landscape
- 6.4 Company Profiles
- 6.4.1 Haifa Group
- 6.4.2 Koch Industries Inc.
- 6.4.3 Nouryon
- 6.4.4 Sociedad Quimica y Minera de Chile SA
- 6.4.5 The Andersons Inc.
- 6.4.6 The Mosaic Company
- 6.4.7 Wilbur-Ellis Company LLC
- 6.4.8 Yara International ASA
7 KEY STRATEGIC QUESTIONS FOR FERTILIZER CEOS
8 APPENDIX
- 8.1 Global Overview
- 8.1.1 Overview
- 8.1.2 Porter's Five Forces Framework
- 8.1.3 Global Value Chain Analysis
- 8.1.4 Market Dynamics (DROs)
- 8.2 Sources & References
- 8.3 List of Tables & Figures
- 8.4 Primary Insights
- 8.5 Data Pack
- 8.6 Glossary of Terms
