
|
시장보고서
상품코드
1693538
아프리카의 미량영양소 비료 시장 : 점유율 분석, 산업 동향, 성장 예측(2025-2030년)Africa Micronutrient Fertilizer - Market Share Analysis, Industry Trends & Statistics, Growth Forecasts (2025 - 2030) |
||||||
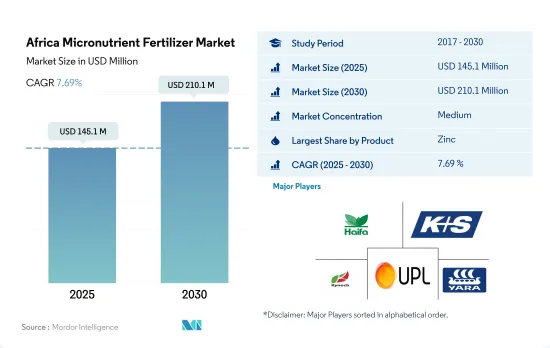
아프리카 미량영양소 비료 시장 규모는 2025년에는 1억 4,510만 달러, 2030년에는 2억 1,010만 달러에 이를 것으로 예측되며, 예측 기간(2025-2030년)의 CAGR은 7.69%를 나타낼 전망입니다.
이 지역의 토양에서 미량영양소의 결핍이 시장을 견인 할 가능성
- 이 지역에서 가장 널리 소비되는 미량영양소 비료인 아연은 2022년 총 소비량의 30.7%를 차지하고 있습니다. 이 비료가 주목받는 것은 작물의 수율을 높이는 역할을 담당하고 있기 때문입니다. 영양불량 등 사회경제적 과제를 다루는 아프리카 국가들은 생산성 향상을 위해 노력하고 있습니다. 특히 이 지역의 농업 토양에서는 아연 결핍이 만연하고 있으며, 아연 비료 수요를 더욱 끌어 올리고 있습니다.
- 붕소는 아프리카에서 두 번째로 소비량이 많은 미량영양소 비료로, 2022년 소비량은 2만 3,000톤에 달하고 시장 점유율은 24.8%입니다. 칼륨과 같은 주요 영양소의 흡수를 돕는 효소를 활성화하고 뿌리의 초기 개척에 중요한 역할을 하기 때문에 시장 전망이 강화될 수 있습니다.
- 철은 아프리카에서 세 번째로 많이 소비되는 미량영양소 비료로 2022년 총 소비량의 19.5%, 시장 매출의 11.7%를 차지합니다. 철의 사용은이 지역의 토양에 영양 부족이 만연하고 있다는 배경에 있습니다.
- 망간과 구리는 일반적으로 사용되는 미량영양소로 주로 결핍 증상이 발생했을 때 사용됩니다. 몰리브덴, 코발트, 염소, 니켈, 셀레늄 등의 미량영양소는 토양에 풍부하게 포함되어 있는 것, 필요량이 적기 때문에 수요는 적습니다.그러나, 토양의 질이 악화되고 있기 때문에 이러한 비료의 시용은 서서히 증가하고 있습니다.
인구 증가와 식량 불안 증대는 미량영양소 비료 시장을 촉진
- 2022년, 사하라 이남의 아프리카는 세계 인구의 13%를 옹호해, 세계의 농지의 약 20%를 차지하고 있었습니다. 이러한 이점에도 불구하고 이 지역은 심각한 식량 불안정으로 어려움을 겪고 있습니다. 이 문제는 현대적인 기계화의 부족, 비료의 미이용, 토양의 미량영양소의 결핍이 주요 원인이 되어, 식량 생산이 제한되고 있는 것에 기인하고 있습니다.
- 2022년에는 나이지리아가 미량영양소 비료 시장을 선도하여 총량의 26.0%를 차지했습니다. 작물의 점유율은 1.4%에 그쳤습니다. 이렇게 농작물이 선호되는 것은 이 지역의 집약적인 농법이 자주 비료의 보급을 필요로 하는 영양 부족으로 이어지기 때문이라고 생각됩니다.
- 2022년 아프리카의 미량영양소 비료 시장에서는 남아프리카가 24.4%라는 큰 금액 점유율을 차지했습니다. 남아프리카 공화국 내에서 기존의 미량영양소 비료는 91.0%, 5,260만 달러에 달하는 큰 비중을 차지했습니다. 한편, 특수 미량영양소 비료의 점유율은 9.0%로, 640만 달러였습니다.
- 이 지역의 경작 면적 확대와 식량 수요 증가를 고려하면 미량영양소 비료의 매출은 2023-2030년에 걸쳐 성장할 전망입니다.
아프리카의 미량영양소 비료 시장 동향
이 지역의 농업생산은 두배가 될 가능성이 있으며, 소비 수요가 높아짐에 따라 농작물의 재배면적은 확대될 전망입니다.
- 아프리카의 농업 생태적 구역은 연간 2회 강우량이 있는 밀생한 열대우림에서 강우량이 적은 건조한 사막까지 퍼져 있습니다. 이 지역의 주요 밭 작물은 옥수수, 수수, 밀, 쌀이 포함되어 있습니다.
- 가격 억제로 이어진 옥수수의 잉여재고를 받아 남아프리카의 옥수수 농업 종사자는 2018-19년 시즌에 재배 면적을 10% 축소해 210만 헥타르로 했습니다. 국내 옥수수 생산량은 1,300만 톤으로 11% 감소하여 수출량은 250만 톤에서 100만 톤으로 격감했습니다.
- 아프리카의 수수 생산은 나이지리아가 선도하고 에티오피아가 약간 차이가 납니다. 작부 면적의 45%를 차지하고 있습니다.가뭄이나 침수에 강하고, 다양한 토양 조건에 적응하는 사탕수수는 아프리카의 건조지대에서 좋아하는 주요 작물로서 대두해, 식량과 소득의 안정을 동시에 보장하고 있습니다.
- 케냐, 소말리아, 에티오피아의 대부분은 심각한 식량 부족의 임박한 위협에 직면해 있습니다.
토양에서 미량영양소의 부족이 높기 때문에 농업 종사자는 미량영양소의 적용을 늘리고 있습니다.
- 2022년에는 아연, 철, 붕소, 망간, 구리가 가장 소비된 미량영양소로 각각 30.9%, 30.1%, 17.3%, 16.40%, 4.5%를 차지했습니다. 물건의 성장에 필수적이기 때문에 작물의 영양에서 중요한 역할을 하고 있습니다. 옥수수, 설엄, 밀이 주요 농작물이며, 2022년의 미량영양소 총소비량의 92.6%(49만900톤)를 농작물이 차지합니다. 각 1헥타르당 4.3kg, 3.6kg, 4.3kg, 4.2kg입니다.
- 나이지리아는 아프리카 국가들 중에서도 두드러지며, 농작물 부문에서의 미량영양소 비료 소비량의 33.3%를 차지하며, 2022년에는 4억 715만 달러가 되었습니다. 나머지 아프리카 국가들은 미량영양소 시장의 66.6%를 차지하고 있습니다. 아프리카의 미량영양소 비료 시장은 지속 가능한 농법으로의 전환과 작물의 성장을 위해 토양 중의 미량영양소 수준을 최적으로 유지하는 것의 중요성의 인식에 의해 2023-2030년에 걸쳐 성장할 전망입니다.
- 농업 종사자가 헥타르 당 수율을 높이려고 노력하는 동안 작물 생산에서 미량영양소의 사용은 크게 급증하고 있습니다. 미량영양소의 결핍이 만연하고 있기 때문에 농업 종사자는 토양의 건강 상태를 개선해, 작물의 생산성을 높이기 위해서, 미량영양소를 보다 많이 채용하게 되어 있습니다.
아프리카의 미량영양소 비료 산업 개요
아프리카의 미량영양소 비료 시장은 적당히 통합되어 상위 5개사에서 48.12%를 차지하고 있습니다.이 시장의 주요 기업은 Haifa Group, KS Aktiengesellschaft, Kynoch Fertilizer, UPL Limited, Yara International ASA 등입니다.
기타 혜택
- 엑셀 형식 시장 예측(ME) 시트
- 3개월의 애널리스트 서포트
목차
제1장 주요 요약과 주요 조사 결과
제2장 보고서 제안
제3장 소개
- 조사의 전제조건과 시장 정의
- 조사 범위
- 조사 방법
제4장 주요 산업 동향
- 주요 작물의 작부 면적
- 밭작물
- 원예작물
- 평균 양분 시용률
- 미량영양소
- 밭작물
- 원예작물
- 미량영양소
- 관개 설비가 있는 농지
- 규제 프레임워크
- 밸류체인과 유통채널 분석
제5장 시장 세분화
- 제품
- 붕소
- 구리
- 철
- 망간
- 몰리브덴
- 아연
- 기타
- 적용방법
- 시비
- 잎면 살포
- 토양
- 작물 유형
- 밭작물
- 원예작물
- 잔디 및 관상용
- 생산국
- 나이지리아
- 남아프리카
- 기타 아프리카
제6장 경쟁 구도
- 주요 전략 동향
- 시장 점유율 분석
- 기업 상황
- 기업 프로파일
- Gavilon South Africa(MacroSource, LLC)
- Haifa Group
- KS Aktiengesellschaft
- Kynoch Fertilizer
- UPL Limited
- Yara International ASA
제7장 CEO에 대한 주요 전략적 질문
제8장 부록
- 세계 개요
- 개요
- Five Forces 분석 프레임워크
- 세계의 밸류체인 분석
- 시장 역학(DROs)
- 정보원과 참고문헌
- 도표 일람
- 주요 인사이트
- 데이터 팩
- 용어집
The Africa Micronutrient Fertilizer Market size is estimated at 145.1 million USD in 2025, and is expected to reach 210.1 million USD by 2030, growing at a CAGR of 7.69% during the forecast period (2025-2030).
Micronutrient deficiencies in the region's soils may drive the market
- Zinc, the most widely consumed micronutrient fertilizer in the region, accounted for 30.7% of the total consumption in the year 2022. Its prominence is attributed to its role in enhancing crop yields. African countries grappling with socio-economic challenges, such as malnutrition, are striving to boost productivity. Notably, zinc deficiency is prevalent in the region's agricultural soils, further driving up the demand for zinc fertilizers.
- Boron, the second most consumed micronutrient fertilizer in Africa, saw a volume consumption of 23.0 thousand metric tons in the year 2022, capturing a 24.8% market share. It plays a crucial role in early-stage root development and activating enzymes that aid in the uptake of major nutrients like potassium, potentially bolstering its market prospects.
- Iron, the third most consumed micronutrient fertilizer in Africa, constituted 19.5% of the total consumption and 11.7% of the market value in the year 2022. Its usage is propelled by prevalent nutrient deficiencies in the region's soils.
- Manganese and copper are commonly employed micronutrients, primarily used when deficiency symptoms arise. In 2022, manganese and copper accounted for shares of 12.1% and 9.0%, respectively. On the other hand, micronutrients like molybdenum, cobalt, chlorine, nickel, and selenium, though abundant in the soil, are less in demand due to their lower requirements. However, with soil quality deteriorating, there is a gradual uptick in the application of these fertilizers.
Growing population and increasing food insecurity concerns propel the micronutrient fertilizer market
- In 2022, the Sub-Saharan African region, home to 13% of the global population, boasted around 20% of the world's agricultural land. Despite this advantage, the region grapples with significant food insecurity. This issue stems from limited food production, largely due to a lack of modern mechanization, underutilization of fertilizers, and prevalent soil micronutrient deficiencies.
- In 2022, Nigeria led the way in the micronutrient fertilizer market, accounting for 26.0% of the total volume. Field crops dominated the fertilizer landscape, claiming a whopping 98.5% share, equivalent to 22.3 thousand metric tons. Horticulture crops trailed behind with a modest 1.4% market share. This preference for field crops can be attributed to the region's intensive agricultural practices, which often lead to nutrient deficiencies necessitating fertilizer supplementation.
- South Africa held a significant value share of 24.4% in the African micronutrient fertilizer market in 2022. Within South Africa, conventional micronutrient fertilizers commanded a lion's share of 91.0%, valued at USD 52.6 million. Specialty micronutrient fertilizers, on the other hand, held a 9.0% share, amounting to USD 6.4 million. The popularity of conventional fertilizers can be attributed to their efficacy in swiftly addressing micronutrient deficiencies, especially through soil application.
- Given the expanding cultivation areas and the region's escalating food demand, the sales of micronutrient fertilizers are poised for growth during 2023-2030.
Africa Micronutrient Fertilizer Market Trends
The region has the potential to double its agricultural production, and the area under field crops is expected to expand due to the rising consumption demand
- The agroecological zones in Africa span from dense rainforests with bi-annual rainfall to arid deserts with minimal precipitation. Key field crops in the region encompass corn, sorghum, wheat, and rice. In 2022, the cultivation area for these crops reached approximately 224.8 million hectares, constituting over 95% of the agricultural land in the region.
- In response to a surplus of corn stocks that led to price suppression, South African corn farmers scaled back their planting by 10% to 2.1 million hectares in the 2018-19 season. Consequently, corn production in the country dipped by 11% from 13 million to 12 million tonnes, and exports plummeted from 2.5 million to 1 million tonnes. This downward trend in corn cultivation is expected to continue in Africa for 2018-2019 as more producers pivot their fields toward oilseed crops, especially soybeans.
- Nigeria takes the lead in sorghum production in Africa, and Ethiopia is closely followed. Sorghum dominates as the primary cereal crop, accounting for 50% of the total output and occupying 45% of Nigeria's cereal cropland. With its resilience to drought and waterlogging and adaptability to diverse soil conditions, sorghum emerges as the preferred staple crop in Africa's arid regions, ensuring both food and income security.
- Kenya, Somalia, and significant parts of Ethiopia face an imminent threat of severe food shortages. Over the past decade, Africa's spending on food imports has nearly tripled despite a consistent expansion in its agricultural industry and cultivated land.
High micronutrient deficiencies in soil have encouraged farmers to apply more micronutrients
- In 2022, zinc, iron, boron, manganese, and copper were the most consumed micronutrients, accounting for 30.9%, 30.1%, 17.3%, 16.40%, and 4.5%, respectively. Micronutrients play a crucial role in crop nutrition, as they are essential for plant growth. Insufficient levels of any micronutrient can lead to plant abnormalities, stunted growth, and reduced yields. Rice, maize, sorghum, and wheat are the primary field crops in Africa, with field crops accounting for 92.6% (490.9 thousand metric tons) of the total micronutrient consumption in 2022. The average nutrient application rates for these crops are 4.3, 3.6, 4.3, and 4.2 kg per hectare, respectively. Wheat, in particular, faces deficiencies in copper and manganese, with slight yield impacts from iron and zinc deficiencies.
- Nigeria stands out among African nations, representing 33.3% of the micronutrient fertilizer consumption in the field crop segment, valued at USD 407.15 million in 2022. South Africa follows with a 0.5% share, valued at USD 6.7 million. The remaining African countries account for the remaining 66.6% of the micronutrient market. The African micronutrient fertilizers market is poised for growth during 2023-2030, driven by a shift toward sustainable farming practices and the recognition of the importance of maintaining optimal micronutrient levels in the soil for crop growth.
- As farmers strive for higher yields per hectare, the use of micronutrients in crop production has seen a significant surge. The prevalence of micronutrient deficiencies, coupled with the rising demand for crops, has prompted farmers to adopt more micronutrients to improve soil health and boost crop productivity.
Africa Micronutrient Fertilizer Industry Overview
The Africa Micronutrient Fertilizer Market is moderately consolidated, with the top five companies occupying 48.12%. The major players in this market are Haifa Group, K+S Aktiengesellschaft, Kynoch Fertilizer, UPL Limited and Yara International ASA (sorted alphabetically).
Additional Benefits:
- The market estimate (ME) sheet in Excel format
- 3 months of analyst support
TABLE OF CONTENTS
1 EXECUTIVE SUMMARY & KEY FINDINGS
2 REPORT OFFERS
3 INTRODUCTION
- 3.1 Study Assumptions & Market Definition
- 3.2 Scope of the Study
- 3.3 Research Methodology
4 KEY INDUSTRY TRENDS
- 4.1 Acreage Of Major Crop Types
- 4.1.1 Field Crops
- 4.1.2 Horticultural Crops
- 4.2 Average Nutrient Application Rates
- 4.2.1 Micronutrients
- 4.2.1.1 Field Crops
- 4.2.1.2 Horticultural Crops
- 4.2.1 Micronutrients
- 4.3 Agricultural Land Equipped For Irrigation
- 4.4 Regulatory Framework
- 4.5 Value Chain & Distribution Channel Analysis
5 MARKET SEGMENTATION (includes market size in Value in USD and Volume, Forecasts up to 2030 and analysis of growth prospects)
- 5.1 Product
- 5.1.1 Boron
- 5.1.2 Copper
- 5.1.3 Iron
- 5.1.4 Manganese
- 5.1.5 Molybdenum
- 5.1.6 Zinc
- 5.1.7 Others
- 5.2 Application Mode
- 5.2.1 Fertigation
- 5.2.2 Foliar
- 5.2.3 Soil
- 5.3 Crop Type
- 5.3.1 Field Crops
- 5.3.2 Horticultural Crops
- 5.3.3 Turf & Ornamental
- 5.4 Country
- 5.4.1 Nigeria
- 5.4.2 South Africa
- 5.4.3 Rest of Africa
6 COMPETITIVE LANDSCAPE
- 6.1 Key Strategic Moves
- 6.2 Market Share Analysis
- 6.3 Company Landscape
- 6.4 Company Profiles
- 6.4.1 Gavilon South Africa (MacroSource, LLC)
- 6.4.2 Haifa Group
- 6.4.3 K+S Aktiengesellschaft
- 6.4.4 Kynoch Fertilizer
- 6.4.5 UPL Limited
- 6.4.6 Yara International ASA
7 KEY STRATEGIC QUESTIONS FOR FERTILIZER CEOS
8 APPENDIX
- 8.1 Global Overview
- 8.1.1 Overview
- 8.1.2 Porter's Five Forces Framework
- 8.1.3 Global Value Chain Analysis
- 8.1.4 Market Dynamics (DROs)
- 8.2 Sources & References
- 8.3 List of Tables & Figures
- 8.4 Primary Insights
- 8.5 Data Pack
- 8.6 Glossary of Terms
