


|
시장보고서
상품코드
1693509
인도의 미량영양소 비료 시장 : 점유율 분석, 산업 동향, 통계, 성장 예측(2025-2030년)India Micronutrient Fertilizer - Market Share Analysis, Industry Trends & Statistics, Growth Forecasts (2025 - 2030) |
||||||
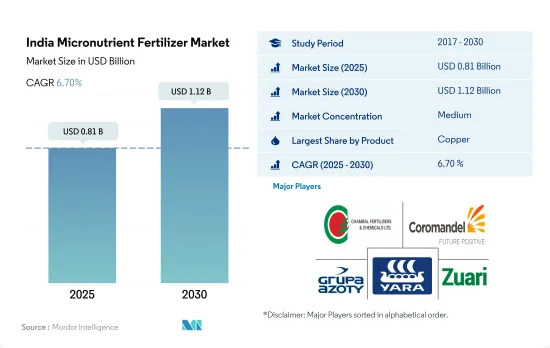
인도의 미량영양소 비료 시장 규모는 2025년에 8억 1,000만 달러, 2030년에는 11억 2,000만 달러에 이르고, 예측 기간(2025-2030년)의 CAGR은 6.70%를 나타낼 전망입니다.

품질과 수율을 향상시키기 위한 미량영양소의 요구가 높아지는 재배의 확대에 따라 미량영양소 수요는 확대될 것으로 예측됩니다.
- 2022년 인도의 미량영양소 비료의 소비량은 아연이 압도적으로 많아 전체의 26.9%를 차지합니다. 버팔로 회보는 마하라슈트라주(83%), 카르나타카주(73%), 안드라 프라데시주(58%)의 토양에서 아연이 현저하게 부족한 것으로 지적하고 있습니다.
- 철은 아연에 이어 인도에서 소비되는 미량영양소 비료의 2위로, 전체 소비량의 19.9%를 차지하고 있습니다.
- 망간은 미량영양소 소비량의 제3위로 전체의 8.1%를 차지합니다. 보다 높은 생산성과 품질에 대한 요구에 의해 망간 비료 수요는 증가해, 2023-2030년에 걸쳐 금액 기준으로 CAGR 5.2%를 보일 것으로 예측됩니다.
- 인도에서는 미량영양소의 소비가 현저하게 급증하고 있어 2023-2030년의 CAGR은 4.4%로 예측됩니다.
- 향후 인도에서의 미량영양소 비료 수요는 2023-2030년에 걸쳐 금액 기준으로 CAGR 6.5%를 기록할 전망입니다. 이 급증의 배경에는 작물의 수량과 생산성의 향상에 대한 요구와, 토양의 미량영양소 부족의 심각화라는 2개의 요인이 있습니다. 또한, 토양 시용으로 안정성이 높아지는 것으로 알려진 킬레이트 비료의 발전은 미량영양소의 성장을 더욱 촉진할 것으로 기대됩니다.
인도의 미량영양소 비료 시장 동향
망간 결핍은 유럽 국가에서 흔히 발견되는 문제로, 모래 토양이나 pH 6 이상의 유기질 토양에서 가장 많이 발견됩니다.
- 이 나라의 밭작물의 재배 면적은 2017-2021년에 걸쳐 3.5% 증가했습니다.
- 작물 유형별로는 쌀, 밀, 대두의 재배면적이 가장 크고, 2022년에는 각각 4,700만ha, 3,110만ha, 1,230만ha를 차지했습니다. 쌀은 인도에서 가장 중요한 식용 작물이며, 전체 경작 면적의 약 4분의 1을 차지해 인도 인구의 약 절반에게 식량을 공급하고 있습니다.
- 이에 따라 이 나라의 쌀 소비량은 2016년 9,580만 톤에서 2022년에는 1억 700만 톤으로 증가했으며, 이는 이 나라에서의 작물에 대한 수요 증가를 보여줍니다. 따라서 국내 및 국제 수요 증가와 함께 국내 곡물 재배가 활발해지면서 2023-2030년에 걸친 비료 수요를 더욱 끌어올릴 것으로 예측됩니다. 마찬가지로 밀 재배량은 2017년 9,850만 톤에서 2020년 1억 760만 톤으로 증가했습니다.주로 펀자브 주, 서 벵골 주, 하리아나 주, 라자스탄 주에서 재배되고 있습니다. 밀은 인도에서 두 번째로 중요한 곡물 작물이며 인도의 식량과 영양 안보에 중요한 역할을 합니다. 그 때문에 국내외에서 수요의 높아짐과 함께, 인도 곡물 재배의 활성화가, 2023-2030년에 걸쳐 인도 비료 시장을 견인할 것으로 예측됩니다.
인도의 토양에서 광범위한 미량영양소의 결핍은 작물 수율의 감소로 이어집니다.
- 화학비료의 소비량 증가로 토양중의 미량영양소의 결핍이 확대되어 작물의 수량이 해마다 감소하고 있습니다.
- 실증적 연구에 따르면 식량, 섬유, 연료 수요 증가에 대응하기 위해 고수익 품종이 도입되었습니다. 이 고수익 작물 품종들은 비료에 매우 민감했습니다. 따라서 토양은 영양분에서 서서히 고갈되었습니다. 2021년에는 망간, 구리, 아연의 평균 양분 시용량이 각각 9.8kg/ha, 7.3kg/ha, 4.1kg/ha로 가장 많은 것이 판명되었습니다.
- 유채, 카놀라, 옥수수, 벼 등의 작물은 2021년 평균 미량영양소 소비량이 가장 많아 각각 10.7kg/ha, 6.8kg/ha, 6.3kg/ha인 것으로 나타났습니다. 작물 품종과 불균형한 시비에 의한 집약적이고 현대적인 작제 방법의 채용은 인도의 토양과 작물에 있어서의 광범위한 미량영양소 결핍증의 출현을 가져오고, 작물 수량의 저하와 농산물 중의 미량영양소 농도의 저하로 이어졌습니다.
- 마하라슈트라, 카르나타카, 할리야나, 타밀 나두, 우타르 프라데시, 마디야 프라데시, 서 벵골, 오리사, 비하르, 우타르 프라데시 등은 아연과 붕소가 매우 부족합니다. 이 때문에 작물, 토양 유형, 결핍의 심각도, 시용률, 시용 빈도에 따른 미량영양소의 관리가 최근 수년간 국내 농업종사자에 의해 지속가능 농업생산을 위해 적응되고 있으며, 이것이 국내 미량영양소 시장을 견인할 것으로 예상되고 있습니다.
인도의 미량영양소 비료 산업 개요
인도의 미량영양소 비료 시장은 상위 5개사에서 60.83%를 차지하고 적당히 통합되어 있습니다.이 시장의 주요 기업은 Chambal Fertilizers & Chemicals Ltd, Coromandel International Ltd., Grupa Azoty S.A. (Compo Expert), Yara International ASA and Zuari Agro Chemicals Ltd (sorted alphabetically)입니다.
기타 혜택
- 엑셀 형식 시장 예측(ME) 시트
- 3개월의 애널리스트 서포트
목차
제1장 주요 요약과 주요 조사 결과
제2장 보고서 제안
제3장 소개
- 조사의 전제조건과 시장 정의
- 조사 범위
- 조사 방법
제4장 주요 산업 동향
- 주요 작물의 작부 면적
- 밭작물
- 원예작물
- 평균 양분 시용률
- 미량영양소
- 밭작물
- 원예작물
- 미량영양소
- 관개 설비가 있는 농지
- 규제 프레임워크
- 밸류체인과 유통채널 분석
제5장 시장 세분화
- 제품
- 붕소
- 구리
- 철
- 망간
- 몰리브덴
- 아연
- 기타
- 적용방법
- 시비
- 잎면 살포
- 토양
- 작물 유형
- 밭작물
- 원예작물
- 잔디 및 관상용
제6장 경쟁 구도
- 주요 전략 동향
- 시장 점유율 분석
- 기업 상황
- 기업 프로파일
- Chambal Fertilizers & Chemicals Ltd
- Coromandel International Ltd.
- Deepak fertilizers & Petrochemicals Corporation Ltd
- Grupa Azoty SA(Compo Expert)
- Haifa Group
- Indian Farmers Fertiliser Cooperative Limited
- Mangalore Chemicals & Fertilizers Ltd.
- Sociedad Quimica y Minera de Chile SA
- Yara International ASA
- Zuari Agro Chemicals Ltd
제7장 CEO에 대한 주요 전략적 질문
제8장 부록
- 세계 개요
- 개요
- Five Forces 분석 프레임워크
- 세계의 밸류체인 분석
- 시장 역학(DROs)
- 정보원과 참고문헌
- 도표 일람
- 주요 인사이트
- 데이터 팩
- 용어집
The India Micronutrient Fertilizer Market size is estimated at 0.81 billion USD in 2025, and is expected to reach 1.12 billion USD by 2030, growing at a CAGR of 6.70% during the forecast period (2025-2030).
With the expansion of cultivation with increasing requirements of micronutrients to improve quality and yield, the demand for micronutrients is expected to grow
- Zinc dominated India's micronutrient fertilizer consumption in 2022, accounting for 26.9% of the total. This high consumption is primarily driven by the prevalent zinc deficiency in Indian cropping soils. Notably, the buffalo bulletin highlights significant zinc deficiencies in the soils of Maharashtra (83%), Karnataka (73%), and Andhra Pradesh (58%).
- Iron follows zinc as the second-most consumed micronutrient fertilizer in India, representing 19.9% of the total consumption. Continuous cultivation of field crops in the same area for extended periods leads to soil nutrient depletion. These factors are projected to drive the market's value, registering a CAGR of 6.8% from 2023 to 2030.
- Manganese ranks third in micronutrient consumption, comprising 8.1% of the total. Driven by the need for higher productivity and quality, the demand for manganese fertilizers is expected to rise, registering a CAGR of 5.2% in terms of value during 2023-2030.
- India has witnessed a notable surge in micronutrient consumption, projected to register a 4.4% CAGR during 2023-2030. This uptick is attributed to the increasing awareness among farmers about the role of micronutrients in enhancing crop productivity.
- Looking ahead, the demand for micronutrient fertilizers in India is poised to register a 6.5% CAGR in value from 2023 to 2030. This surge is driven by the twin factors of a need for higher crop yields and productivity, coupled with escalating soil micronutrient deficiencies. Additionally, advancements in chelated fertilizers, known for their enhanced stability in soil applications, are expected to further bolster the growth of micronutrients.
India Micronutrient Fertilizer Market Trends
Manganese deficiency is a common problem in European countries, which most frequently affects sandy soils and organic soils with a pH above 6
- The area under field crop cultivation in the country increased by 3.5% from 2017 to 2021. The increased cultivation of cereals, pulses, and oilseeds in the country due to the rising consumer demand domestically and internationally is the major driving factor for the rising acreage.
- By crop type, rice, wheat, and soybean occupied the largest area under cultivation in the country, accounting for 47 million ha, 31.1 million ha, and 12.3 million ha, respectively, in the year 2022. Rice is the most important food crop of India, covering about one-fourth of the total cropped area and providing food to about half of the Indian population. It is cultivated in almost all the states of the country, mainly in West Bengal, Uttar Pradesh, Andhra Pradesh, Punjab, and Tamil Nadu.
- Accordingly, rice consumption in the country increased from 95.8 million tons in 2016 to 107 million tons in 2022, which shows the rising demand for the crop in the country. This trend is further anticipated to drive the demand for fertilizers during 2023-2030. Similarly, wheat cultivation in the country increased from 98.5 million tons in 2017 to 107.6 million tons in the year 2020. It is cultivated majorly in Punjab, West Bengal, Haryana, and Rajasthan. Wheat is the second most important cereal crop in India and plays a vital role in the food and nutritional security of the country. Therefore, the intense cereal cultivation in the country, coupled with rising domestic and international demand, is anticipated to drive the Indian fertilizer market during 2023-2030.
Widespread micronutrient deficiency in soils of India is leading to reduced crop yield
- The increasing consumption of chemical fertilizers has led to a higher deficiency of micronutrients in the soil, leading to lesser crop yield over the years. The State of Biofertilizers and Organic Fertilizers stated that the soil was highly deficient in boron (47.0%), zinc (39.0%), iron (37.0%), and sulfur (36.0%) in 2022.
- Empirical studies show that high-yielding cultivars were introduced to meet the growing demand for food, fiber, and fuel. These high-yielding crop cultivars were highly responsive to fertilizers. Thus, the soils were slowly exhausted from their nutrients. In 2021, manganese, copper, and zinc were found to have the highest average nutrient application rates of 9.8 kg/ha, 7.3 kg/ha, and 4.1 kg/ha, respectively.
- Crops such as rapeseed/canola, corn/maize, and rice were found to be the largest consumers of average micronutrients in 2021, accounting for 10.7, 6.8, and 6.3 kg/ha, respectively. The adoption of intensive and modern cropping practices with high-yielding crop cultivars and unbalanced fertilizer application resulted in the emergence of widespread micronutrient deficiency in soils and crops of India, leading to reduced crop yield and low micronutrient concentration in agricultural produce.
- States such as Maharashtra, Karnataka, Haryana, Tamil Nadu, Uttar Pradesh, Madhya Pradesh, West Bengal, Orissa, Bihar, and Uttar Pradesh are highly deficient in zinc and boron. Hence, micronutrient management depending upon crops, soil types, the severity of the deficiency, rates, and frequency of application has been adapted by the farmers in the country for sustainable agricultural production over the past few years, which is anticipated to drive the micronutrient market in the country.
India Micronutrient Fertilizer Industry Overview
The India Micronutrient Fertilizer Market is moderately consolidated, with the top five companies occupying 60.83%. The major players in this market are Chambal Fertilizers & Chemicals Ltd, Coromandel International Ltd., Grupa Azoty S.A. (Compo Expert), Yara International ASA and Zuari Agro Chemicals Ltd (sorted alphabetically).
Additional Benefits:
- The market estimate (ME) sheet in Excel format
- 3 months of analyst support
TABLE OF CONTENTS
1 EXECUTIVE SUMMARY & KEY FINDINGS
2 REPORT OFFERS
3 INTRODUCTION
- 3.1 Study Assumptions & Market Definition
- 3.2 Scope of the Study
- 3.3 Research Methodology
4 KEY INDUSTRY TRENDS
- 4.1 Acreage Of Major Crop Types
- 4.1.1 Field Crops
- 4.1.2 Horticultural Crops
- 4.2 Average Nutrient Application Rates
- 4.2.1 Micronutrients
- 4.2.1.1 Field Crops
- 4.2.1.2 Horticultural Crops
- 4.2.1 Micronutrients
- 4.3 Agricultural Land Equipped For Irrigation
- 4.4 Regulatory Framework
- 4.5 Value Chain & Distribution Channel Analysis
5 MARKET SEGMENTATION (includes market size in Value in USD and Volume, Forecasts up to 2030 and analysis of growth prospects)
- 5.1 Product
- 5.1.1 Boron
- 5.1.2 Copper
- 5.1.3 Iron
- 5.1.4 Manganese
- 5.1.5 Molybdenum
- 5.1.6 Zinc
- 5.1.7 Others
- 5.2 Application Mode
- 5.2.1 Fertigation
- 5.2.2 Foliar
- 5.2.3 Soil
- 5.3 Crop Type
- 5.3.1 Field Crops
- 5.3.2 Horticultural Crops
- 5.3.3 Turf & Ornamental
6 COMPETITIVE LANDSCAPE
- 6.1 Key Strategic Moves
- 6.2 Market Share Analysis
- 6.3 Company Landscape
- 6.4 Company Profiles
- 6.4.1 Chambal Fertilizers & Chemicals Ltd
- 6.4.2 Coromandel International Ltd.
- 6.4.3 Deepak fertilizers & Petrochemicals Corporation Ltd
- 6.4.4 Grupa Azoty S.A. (Compo Expert)
- 6.4.5 Haifa Group
- 6.4.6 Indian Farmers Fertiliser Cooperative Limited
- 6.4.7 Mangalore Chemicals & Fertilizers Ltd.
- 6.4.8 Sociedad Quimica y Minera de Chile SA
- 6.4.9 Yara International ASA
- 6.4.10 Zuari Agro Chemicals Ltd
7 KEY STRATEGIC QUESTIONS FOR FERTILIZER CEOS
8 APPENDIX
- 8.1 Global Overview
- 8.1.1 Overview
- 8.1.2 Porter's Five Forces Framework
- 8.1.3 Global Value Chain Analysis
- 8.1.4 Market Dynamics (DROs)
- 8.2 Sources & References
- 8.3 List of Tables & Figures
- 8.4 Primary Insights
- 8.5 Data Pack
- 8.6 Glossary of Terms
