
|
시장보고서
상품코드
2062318
전자상거래 창고 : 시장 점유율 분석, 업계 동향 및 통계, 성장 예측(2026-2031년)E-Commerce Warehousing - Market Share Analysis, Industry Trends & Statistics, Growth Forecasts (2026 - 2031) |
||||||
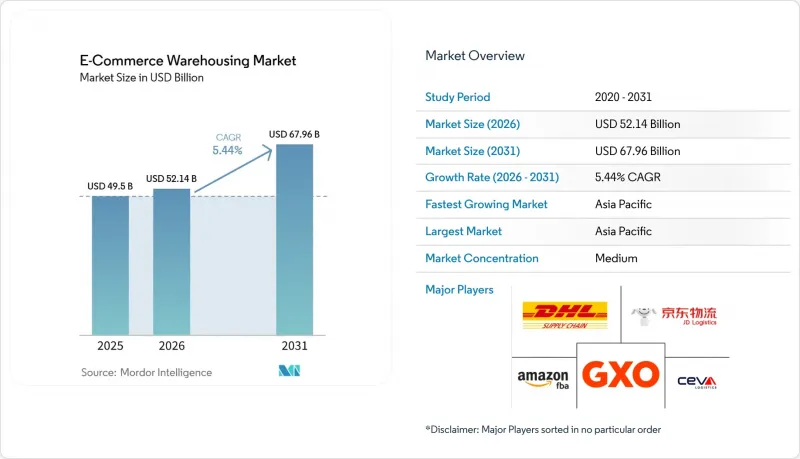
세계의 전자상거래 창고 시장 규모는 2025년 495억 달러로 평가되었습니다. 2026년에는 521억 4,000만 달러로 확대되어 2031년까지 679억 6,000만 달러에 이를 것으로 예상되고 2026년부터 2031년에 걸쳐 CAGR 5.44%로 성장할 전망입니다.
겉보기에는 안정적인 성장률 뒤에는 자유무역지역 주변에 보세 시설이 집중되고, 직접 투 컨슈머(DTC) 브랜드에 따른 유연한 팝업형 창고 공간에 대한 수요가 증가하며, 소셜 커머스로 인한 SKU 변동성으로 인해 사업자들이 적응형 자동화로 전환하고 있는 등 근본적인 변화가 숨어 있습니다. 본 보고서는 창고 유형(풀필먼트 센터, 물류 센터 등), 서비스 유형(보관, 피킹·포장 등), 자동화 수준(수동, 반자동 등), 최종 사용자(의류 및 신발, 가전제품 등) 및 지역(북미, 남미 등)별로 분류되어 있습니다. 시장 전망은 금액(달러) 기준으로 제시되어 있습니다.
세계의 전자상거래 창고 시장 동향 및 인사이트
크로스보더 전자상거래의 급증으로 보세창고 확장이 가속화되고 있습니다.
제벨 알리에서 싱가포르에 이르는 자유무역지역에서는 2024년 이후 보세창고의 수용 능력이 두 자릿수 성장률을 기록하며 확대되고 있으며, 이에 따라 크로스보더 전자상거래 상품을 소비자에게 3-5일 이내에 배송할 수 있게 되어 고가 상품의 비용 산정 균형이 바뀌었습니다. Tmall Global 등 중국 플랫폼들은 동남아시아의 보세 거점을 통해 재고를 유통함으로써 2주간의 리드타임을 단축하고 있는 반면, 유럽연합(EU)의 관세 개혁으로 행정 절차가 간소화되면서 중유럽의 보세 창고 건설이 28% 증가했습니다. 이러한 동향은 무역 경로의 변동에 유연하게 대응할 수 있는 국경 인근의 보관 거점으로 전 세계 전자상거래 창고 시장이 구조적으로 전환되는 기반이 되고 있습니다.
블록체인을 통한 관리 이력 검증에 대해 규제 대상 업계의 관심이 쏠리고 있습니다.
제약 회사와 명품 브랜드 기업들은 검증상의 미비점이 해소되는 대로 제3자 시설로 이전하고 있습니다. IBM Food Trust 및 이와 유사한 원장 시스템은 모든 취급 이력을 기록함으로써, 과거에는 자사 창고를 선호했던 규제 당국이나 명품 브랜드 기업의 요구 사항을 충족시키고 있습니다. 화이자로부터 모더나에 이르는 백신 프로그램이 이 모델의 유효성을 대규모로 입증했으며, LVMH와 같은 패션 그룹은 현재 창고 출하 시 QR 코드를 통해 원산지 정보를 제공합니다. 변조가 불가능한 로그 덕분에 규정 준수 관련 비용이 40% 절감되고 보험의 자동 적용도 실현되고 있지만, 기업에 도입하는 데는 여전히 최대 200만 달러의 비용이 소요되며 상호 운용성 문제도 남아 있습니다. 그럼에도 불구하고, 블록체인의 보급은 전 세계 전자상거래 물류 시장 내에서 새로운 프리미엄 서비스 수익의 조짐을 보이고 있습니다.
신흥 지역에서는 전력망의 제약으로 인해 자동화 시스템의 가동 시간이 제한되고 있습니다.
인도에서 나이지리아에 이르는 시장에서는 간헐적인 정전으로 인해 로봇 생산 라인이 예정 가동 시간의 15-25% 동안 가동을 중단하고 있습니다. 디젤 발전기를 이용한 백업은 비용을 35-40%나 증가시켜 AS/RS 시스템의 투자 대비 효과를 저해하고 있습니다. JD Logistics에서는 전압 저하로 인해 자카르타 거점의 가동률이 85%에서 62%로 급락하여, 하이브리드 방식(태양광·배터리)으로의 개조를 어쩔 수 없이 단행해야 했습니다. 이로 인해 설비 투자(CAPEX)가 1제곱피트당 100-150달러 증가했습니다. 전력망의 내결함성이 향상될 때까지는 전 세계 전자상거래 창고 시장에서 사업자들은 자동화에 대한 의지와 현지 전력 사정 사이의 균형을 맞추어야 합니다.
부문별 분석
마이크로 풀필먼트 센터와 다크 스토어는 연평균 성장률(CAGR) 10.68%(2026-2031년)로 성장하고 있으며, 2025년 기준 전 세계 전자상거래 물류 시장 규모의 43.42%를 차지한 기존 풀필먼트 센터에 도전하고 있습니다. 이러한 소규모의 지역 밀착형 시설은 초고속 배송을 가능하게 하며, 특히 인구 밀도가 높은 도시 지역에서 그 효과를 발휘합니다.
기존의 물류 센터는 여전히 중요하지만, 옴니채널 허브로 진화하고 있습니다. 또한, 식료품 및 의약품 수요를 뒷받침하기 위해 콜드체인 창고도 확대되고 있으며, 보세창고는 관세 유예 모델을 통해 크로스보더 전자상거래 분야에서 주목을 받고 있습니다. 동시에, 반품 및 재활용 처리를 위한 전문 시설도 등장하면서 역물류(Reverse Logistics)의 중요성이 부각되고 있습니다.
2025년 기준으로 보관 서비스는 전 세계 전자상거래 창고 시장 규모의 44.82%를 차지했으나, 브랜드들이 단순한 재고 관리 이상의 차별화를 모색함에 따라 부가가치 서비스는 연평균 성장률(CAGR) 10.15%로 성장할 전망입니다. 맞춤형 키트 구성, 최종 단계에서의 라벨 부착, 특별 주문 포장 등을 통해 DTC(Direct-to-Consumer) 판매업체는 창고라는 접점에서 브랜드 가치를 더할 수 있으며, 기본적인 피킹 및 포장에 비해 15-25%의 가격 인상을 실현하고 있습니다.
반품 건수가 증가함에 따라 창고에서는 검수, 재생, 재판매 과정을 추가해야 할 필요가 생겨 업무가 더욱 복잡해지고 있습니다. 보관 시간과 비용을 절감하기 위해, 회전율이 높은 상품은 크로스도킹을 통해 처리되는 사례가 늘고 있습니다. 한편, 제약 및 식품 등의 분야에서 요구되는 엄격한 추적 요건은 가치 있는 장기적인 서비스 기회를 창출하고 있습니다. 전반적으로 창고 업무는 더욱 전문화되고 있으며, 서비스 주도형으로 변화하고 있습니다.
지역별 분석
아시아태평양은 2025년에 전 세계 전자상거래 창고 시장 점유율의 38.95%를 차지했으며, 2031년까지 연평균 성장률(CAGR) 6.08%라는 가장 높은 성장률을 기록하고 있습니다. 중국의 자유무역지대 네트워크는 보세창고를 통해 3,000억 달러 규모의 국경 간 상품을 유통하고 있는 반면, 인도네시아, 베트남, 필리핀에서는 소셜 커머스의 급증하는 수요를 충족하기 위해 마이크로 풀필먼트의 서비스 범위를 확대되고 있습니다. 인도의 GST(상품 및 서비스세) 개혁으로 인해, 전력망의 불안정성에도 불구하고 기관 투자자 대상 시장이 40% 증가했으며, 자동화 시범 도입이 가속화되었습니다. 일본과 한국에서는 노동력의 고령화를 보완하기 위해 로봇 기술을 도입하고 있으며, 이로 인해 지역의 기술 집약도를 높이고 있습니다.
북미는 전 세계 전자상거래 창고 시장에서 2위의 규모를 차지하고 있습니다. 팬데믹 기간 동안 과도한 건설이 이루어진 결과, 2024년에는 서브리스 물건이 유휴 상태가 되었으나, 소매업체들이 옴니채널 거점 배치를 재검토함에 따라 2025년에는 흡수율이 회복되었습니다. 멕시코는 니어쇼어 거점으로 부상하고 있으며, 몬테레이와 티후아나에 건설 중인 보세창고는 미국으로 향하는 물류 회랑과 연결되어 있습니다. 미국에서는 지속가능성 향상을 위한 설비 투자가 주류를 이루고 있으며, 신규 입찰 프로젝트에서는 옥상 태양광 발전 및 LEED 골드 인증 설계가 표준으로 자리 잡고 있습니다.
유럽에서는 그린 딜의 추진과 BOPIS(매장 수령)의 보급을 배경으로 꾸준한 성장세가 나타나고 있습니다. 바르샤바와 로테르담이 복합운송 회랑의 거점으로 자리 잡고 있는 반면, 브렉시트로 인한 통관 마찰로 인해 영국-프랑스 해협 양안에 이중 재고 체제가 형성되고 있습니다. 현재 LEED 및 BREEAM 인증은 대출 조건에 영향을 미치고 있으며, 효율성 기준이 유럽 대륙의 창고 평가에 반영되고 있습니다. 아프리카은 규모는 작지만 급속히 성장하고 있습니다. 두바이와 리야드에서는 3개 대륙에 걸친 물류 흐름을 뒷받침하는 프리존 허브에 대한 투자가 진행되고 있으며, 이것이 전 세계 전자상거래 창고 시장 전체를 견인하고 있습니다.
기타 혜택 :
- 엑셀 형식 시장 예측(ME) 시트
- 3개월간의 애널리스트 지원
자주 묻는 질문
목차
제1장 서론
제2장 조사 방법
제3장 주요 요약
제4장 시장 구도
제5장 시장 규모 및 성장 예측(금액, 2024-2030년)
제6장 경쟁 구도
제7장 시장 기회 및 향후 전망
KTHAccording to Mordor Intelligence, the global e-commerce warehousing market size is expected to increase from USD 49.50 billion in 2025 to USD 52.14 billion in 2026 and reach USD 67.96 billion by 2031, growing at a CAGR of 5.44% over 2026-2031.

A steady headline rate hides sweeping shifts as bonded facilities cluster around free-trade zones, direct-to-consumer (DTC) brands demand flexible pop-up capacity, and social-commerce-driven SKU volatility pushes operators toward adaptive automation. This report is Segmented by Warehouse Type (Fulfilment Centres, Distribution Centres, and More), by Service Type (Storage, Picking & Packing, and More), by Automation Level (Manual, Semi-Automated, and More), by End-User (Apparel & Footwear, Consumer Electronics, and More), and by Region (North America, South America, and More). The Market Forecasts are Provided in Terms of Value (USD).
Global E-Commerce Warehousing Market Trends and Insights
Cross-Border E-Commerce Surge Fuels Bonded-Warehouse Expansion
Free-trade zones from Jebel Ali to Singapore have raised bonded capacity by double-digit rates since 2024, enabling 3-5-day delivery to cross-border consumers and tipping the cost calculus for high-value goods. Chinese platforms such as Tmall Global funnel inventory through Southeast Asian bonded sites to shave two-week lead times, while European Union customs reforms reduced paperwork and unlocked 28% growth in Central-European bonded builds. These dynamics anchor the global e-commerce warehousing market's structural shift toward near-border storage nodes that flex with trade-lane swings.
Blockchain-Verified Chain-of-Custody Attracts Regulated Verticals
Pharmaceutical and luxury operators are migrating to third-party sites once verification gaps close. IBM Food Trust and comparable ledgers log every handling event, satisfying regulators and luxury houses that previously preferred in-house stockrooms. Vaccine programs from Pfizer to Moderna proved the model at scale, and fashion groups like LVMH now imprint QR-based provenance on warehouse exits. Immutable logs trim compliance overhead by 40% and automate insurance triggers, although enterprise deployments still run up to USD 2 million and suffer interoperability frictions. Even so, blockchain uptake signals fresh premium-service revenue inside the global e-commerce warehousing market.
Power-Grid Constraints Limit Automation Uptime in Emerging Regions
Intermittent electricity knocks robotic lines offline for 15-25% of scheduled hours in markets from India to Nigeria. Diesel backups raise costs by 35-40% and undermine ROI on AS/RS systems. JD Logistics saw Jakarta utilization tumble from 85% to 62% when voltage dipped, forcing hybrid solar-battery retrofits that add USD 100-150 per ft2 to capex. Until grid resilience improves, operators must balance automation ambition with localized power realities across the global e-commerce warehousing market.
Other drivers and restraints analyzed in the detailed report include:
- Direct-to-Consumer Brand Boom Drives Flexible Pop-Up Warehousing
- Social-Commerce-Led SKU Volatility Spurs Adaptive Storage Systems
- Escalating Cyber-Attacks on WMS Disrupt Fulfillment Continuity
For complete list of drivers and restraints, kindly check the Table Of Contents.
Segment Analysis
Micro-fulfillment centers and dark stores are expanding at a 10.68% CAGR (2026-2031), challenging traditional fulfillment centers, which still hold 43.42% of the global e-commerce warehousing market size in 2025. Their small, hyperlocal setups enable ultra-fast delivery, making them especially effective in dense urban areas.
Traditional distribution centers remain important but are evolving into omnichannel hubs. Cold-chain warehouses are also growing to support grocery and pharmaceutical demand, while bonded warehouses are gaining traction in cross-border e-commerce through duty-deferred models. At the same time, specialized facilities for returns and refurbishment are emerging, highlighting the rising importance of reverse logistics.
Storage held a 44.82% revenue of the global e-commerce warehousing market size in 2025, but value-added services will advance at a 10.15% CAGR as brands seek differentiation beyond plain shelving. Customized kitting, late-stage labeling, and bespoke packaging allow DTC sellers to embed brand equity at the warehouse touchpoint, commanding 15-25% price uplifts over basic pick-pack.
Rising returns are pushing warehouses to add inspection, refurbishment, and resale processes, making operations more complex. Fast-moving goods are increasingly handled through cross-docking to reduce storage time and costs. Meanwhile, strict tracking requirements in sectors like pharma and food are creating valuable, long-term service opportunities. Overall, warehousing is becoming more specialized and service-driven.
Geography Analysis
Asia-Pacific controlled 38.95% of the global e-commerce warehousing market share in 2025 and posts the strongest 6.08% CAGR through 2031. China's free-trade-zone network funnels USD 300 billion in cross-border goods through bonded depots, while Indonesia, Vietnam, and the Philippines add micro-fulfillment coverage to satisfy social-commerce flash demand. India's GST reform triggered a 40% jump in institutional-grade space and accelerated automation pilots despite power-grid inconsistencies. Japan and South Korea deploy robotics to offset aging labor pools, pushing regional technology intensity higher.
North America forms the second-largest slice of the global e-commerce warehousing market. Pandemic-era overbuilding left sublease space idle in 2024, yet absorption picked up in 2025 as retailers recalibrated omnichannel footprints. Mexico flourishes as a nearshore alternative, attracting bonded builds in Monterrey and Tijuana that knit into United States distribution corridors. Sustainability upgrades dominate United States capex, with rooftop solar and LEED Gold designs standard in new bids.
Europe records steady expansion behind Green Deal imperatives and BOPIS adoption. Warsaw and Rotterdam anchor multimodal corridors, while Brexit-driven customs frictions spark dual-inventory positions on each side of the Channel. LEED and BREEAM labels now influence financing terms, embedding efficiency baselines into continental warehouse valuations. Middle East and Africa, though smaller, grow rapidly; Dubai and Riyadh bankroll free-zone hubs to service tri-continent flows that feed the broader global e-commerce warehousing market.
- DHL Supply Chain & Fulfilment
- JD Logistics
- GXO Logistics
- CEVA Logistics
- UPS Supply Chain Solutions
- FedEx Supply Chain
- Maersk
- Kuehne+Nagel
- ShipBob
- Aramex
- Yusen Logistics
- Hellmann Worldwide Logistics
- SF Express
- Ninja Van
- Lineage Logistics
- DSV
- Geodis
- Nippon Express
- Sinotrans
- Ryder Supply Chain Solutions
Additional Benefits:
- The market estimate (ME) sheet in Excel format
- 3 months of analyst support
TABLE OF CONTENTS
1 Introduction
- 1.1 Study Assumptions & Market Definition
- 1.2 Scope of the Study
2 Research Methodology
3 Executive Summary
4 Market Landscape
- 4.1 Market Overview
- 4.2 Market Drivers
- 4.2.1 Cross-Border E-Commerce Surge Fuels Bonded-Warehouse Expansion
- 4.2.2 Blockchain-Verified Chain-of-Custody Attracts Regulated Verticals
- 4.2.3 Direct-To-Consumer Brand Boom Drives Flexible Pop-Up Warehousing
- 4.2.4 Social-Commerce-Led SKU Volatility Spurs Adaptive Storage Systems
- 4.2.5 Net-Zero Mandates Accelerate Investment in Energy-Positive Facilities
- 4.2.6 BOPIS Proliferation Requires Urban Omni-Inventory Hubs
- 4.3 Market Restraints
- 4.3.1 Power-Grid Constraints Limit Automation Uptime in Emerging Regions
- 4.3.2 Escalating Cyber-Attacks on WMS Disrupt Fulfillment Continuity
- 4.3.3 Urban-Edge Zoning Restrictions Delay Warehouse Approvals
- 4.3.4 Volatile Ocean-Freight Rates Complicate Inventory Positioning
- 4.4 Value / Supply-Chain Analysis
- 4.5 Regulatory Landscape
- 4.6 Technological Outlook
- 4.7 Porter's Five Forces
- 4.7.1 Competitive Rivalry
- 4.7.2 Threat of New Entrants
- 4.7.3 Bargaining Power of Suppliers
- 4.7.4 Bargaining Power of Buyers
- 4.7.5 Threat of Substitutes
5 Market Size & Growth Forecasts (Value, 2024-2030)
- 5.1 By Warehouse Type
- 5.1.1 Fulfilment Centres
- 5.1.2 Distribution Centres (DCs)
- 5.1.3 Cold-Chain Warehouses
- 5.1.4 Dark Stores / Micro-Fulfillment Centers
- 5.1.5 Others (reverse logistics hubs, bonded warehouses, hybrid-use spaces, etc.)
- 5.2 By Service Type
- 5.2.1 Storage
- 5.2.2 Picking & Packing
- 5.2.3 Value-Added Services and Others (kitting, labelling)
- 5.3 By Automation Level
- 5.3.1 Manual
- 5.3.2 Semi-Automated
- 5.3.3 Fully Automated
- 5.4 By End-User Industry
- 5.4.1 Apparel & Footwear
- 5.4.2 Consumer Electronics
- 5.4.3 Grocery & FMCG
- 5.4.4 Pharmaceuticals, Beauty & Wellness
- 5.4.5 Home Essentials & Furnishings
- 5.4.6 Others
- 5.5 By Geography
- 5.5.1 North America
- 5.5.1.1 United States
- 5.5.1.2 Canada
- 5.5.1.3 Mexico
- 5.5.2 South America
- 5.5.2.1 Brazil
- 5.5.2.2 Peru
- 5.5.2.3 Chile
- 5.5.2.4 Argentina
- 5.5.2.5 Rest of South America
- 5.5.3 Asia-Pacific
- 5.5.3.1 India
- 5.5.3.2 China
- 5.5.3.3 Japan
- 5.5.3.4 Australia
- 5.5.3.5 South Korea
- 5.5.3.6 South East Asia (Singapore, Malaysia, Thailand, Indonesia, Vietnam, and Philippines)
- 5.5.3.7 Rest of Asia-Pacific
- 5.5.4 Europe
- 5.5.4.1 United Kingdom
- 5.5.4.2 Germany
- 5.5.4.3 France
- 5.5.4.4 Spain
- 5.5.4.5 Italy
- 5.5.4.6 BENELUX (Belgium, Netherlands, and Luxembourg)
- 5.5.4.7 NORDICS (Denmark, Finland, Iceland, Norway, and Sweden)
- 5.5.4.8 Rest of Europe
- 5.5.5 Middle East and Africa
- 5.5.5.1 United Arab Emirates
- 5.5.5.2 Saudi Arabia
- 5.5.5.3 South Africa
- 5.5.5.4 Nigeria
- 5.5.5.5 Rest of Middle East And Africa
- 5.5.1 North America
6 Competitive Landscape
- 6.1 Market Concentration
- 6.2 Strategic Moves
- 6.3 Market Share Analysis
- 6.4 Company Profiles (includes Global level Overview, Market level overview, Core Segments, Financials as available, Strategic Information, Market Rank/Share for key companies, Products & Services, and Recent Developments)
- 6.4.1 DHL Supply Chain & Fulfilment
- 6.4.2 JD Logistics
- 6.4.3 GXO Logistics
- 6.4.4 CEVA Logistics
- 6.4.5 UPS Supply Chain Solutions
- 6.4.6 FedEx Supply Chain
- 6.4.7 Maersk
- 6.4.8 Kuehne+Nagel
- 6.4.9 ShipBob
- 6.4.10 Aramex
- 6.4.11 Yusen Logistics
- 6.4.12 Hellmann Worldwide Logistics
- 6.4.13 SF Express
- 6.4.14 Ninja Van
- 6.4.15 Lineage Logistics
- 6.4.16 DSV
- 6.4.17 Geodis
- 6.4.18 Nippon Express
- 6.4.19 Sinotrans
- 6.4.20 Ryder Supply Chain Solutions
