
|
시장보고서
상품코드
2064519
기술 부문 보수 관리 : 시장 점유율 분석, 업계 동향 및 통계, 성장 예측(2026-2031년)Compensation Management In Technology Sector - Market Share Analysis, Industry Trends & Statistics, Growth Forecasts (2026 - 2031) |
||||||
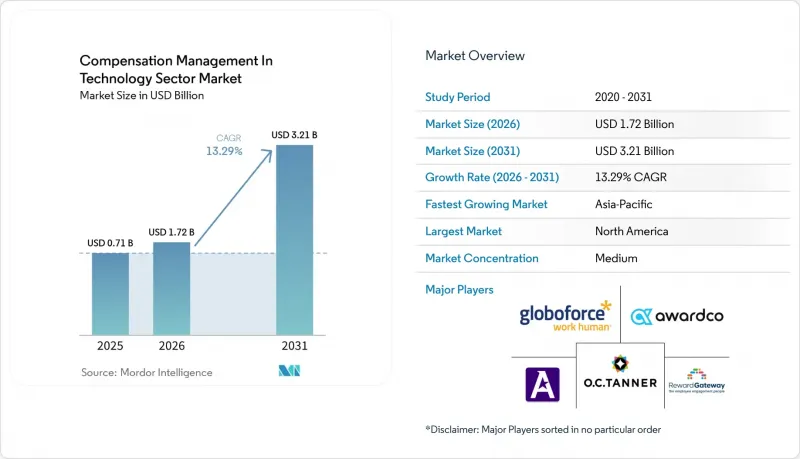
Mordor Intelligence에 의하면, 기술 부문 보수 관리 시장은 2025년에 7억 1,000만 달러로 평가되었습니다. 2026년에 17억 2,000만 달러에서 2031년까지 32억 1,000만 달러에 이를 것으로 예측됩니다.
2026년부터 2031년까지 연평균 성장률(CAGR) 13.29%를 나타낼 것으로 전망됩니다.

본 보고서는 구성 요소(소프트웨어 및 서비스), 도입 형태(클라우드 기반, On-Premise형, 하이브리드형), 기업 규모(대기업 및 중소기업), 기능(보상 계획, 기본급 관리, 인센티브 보상 관리 등) 및 지역별로 분류되어 있습니다. 시장 전망은 금액(달러) 기준으로 제시되어 있습니다.
세계의 기술 부문 보수 관리 시장 동향 및 인사이트
급여 투명성 및 급여 형평성에 관한 규정 준수 기한
기술 부문의 보상 관리 시장은 규정 준수 기한에 힘입어 강력한 성장세를 보이고 있으며, 보상 관리 소프트웨어는 단순한 선택적 인사 도구가 아닌 핵심 관리 시스템으로 변모하고 있습니다. EU 임금 투명성 지침에 따른 2026년 6월 7일 마감 기한으로 인해, 기술 기업 고용주들은 임금 범위 공개, 임금 결정 과정의 문서화, 그리고 사내 임금 격차 검증 등을 그 어느 때보다 엄격하게 수행해야만 합니다. 미국에서도 임금 투명성에 관한 규제가 각 주로 확대되고 있어, 원격 근무 채용 공고를 게시하는 고용주는 하나의 채용 공고에 대해 여러 가지 공개 의무를 준수해야 하는 경우가 많아지고 있습니다. 일리노이주도 임금 투명성과 관련하여 유사한 요건을 추가함에 따라, 여러 관할 구역에서 동시에 채용을 진행하는 고용주에 대한 압박이 커지고 있습니다. 이를 통해 단일 시스템 내에서 정책 로직, 승인 내역, 게시 관리를 유지할 수 있으므로, 관할 구역을 고려한 보상 관리 플랫폼은 기술 부문 시장의 보상 관리 분야에서 더욱 높은 가치를 지니게 되었습니다. 직원 수가 많은 고용주를 대상으로 한 다음 단계의 보고 의무는 초기 공시 준비 단계를 훨씬 넘어, 규정 준수를 중심으로 한 구매 활동을 활발하게 유지할 가능성이 높습니다.
보상 워크플로우에 클라우드와 AI 도입
기술 업계의 보상 관리는 연례 보상 주기에서 지속적인 의사결정 지원으로의 전환에 의해서도 형성되고 있습니다. 2026년에는 인센티브 보상 팀의 81%가 어떤 형태로든 AI를 활용하고 있는 것으로 보고되었으며, AI를 많이 사용하는 사용자 시장 변화에 대한 대비율은 67%에 달하고, 이용 빈도가 낮은 사용자보다 훨씬 높은 수치를 기록했습니다. 한 플랫폼은 700개 이상의 기업에서 제공한 실시간 시장 데이터와 대규모 스킬 그래프를 활용해 급여 제안을 지원하는 ‘AI Pay and Compensation Agent’를 내세워, 94%의 제안 수락률과 제안 제시까지 소요되는 시간을 23% 단축하는 성과를 거두었습니다. 또 다른 벤더는 SOC 2 Type II 준수 환경 내에서 임금 격차 분석, 예산 시나리오 모델링 및 실시간 보상 시뮬레이션을 위한 생성형 AI 기능을 추가함으로써, 공급업체들이 AI를 기업의 통제 프레임워크에 어떻게 통합하고 있는지를 보여주었습니다. 기술 부문의 보상 관리 시장에서 이러한 신제품 출시가 중요하게 여겨지는 이유는 구매자들이 현재 주기 종료 후의 결과 요약뿐만 아니라 상황 변화에 따라 보상 결정을 동적으로 이끌어내는 시스템을 기대하고 있기 때문입니다. AI를 감사 가능성, 거버넌스 및 안전한 도입과 연계하여 제공하는 벤더는 AI를 독립된 기능으로만 취급하는 벤더보다 더 많은 신뢰를 얻을 가능성이 높을 것입니다.
예산 제약으로 인한 보수 결정이 스위트 확장을 지연시키고 있습니다.
기술 부문의 보상 관리 시장에서는 기술 기업들의 예산 관리가 엄격해지는 가운데, 여전히 구매 사이클의 둔화가 나타나고 있습니다. 많은 기업들은 우선 핵심이 되는 계획 모듈을 확보한 뒤, 인원 수나 채용 계획이 명확해질 때까지 분석, 투명성 또는 주식 보상 기능 확장에 대한 지출을 미루고 있습니다. 이는 거버넌스의 필요성을 이해하면서도 도입에 신중한 시기에는 광범위한 플랫폼 도입을 항상 정당화할 수 없는 중소 기술 기업에서 특히 두드러집니다. 이러한 지출 패턴은 일반적으로 보상 관리 소프트웨어를 로드맵에서 제외시키는 요인은 아니지만, 도입을 단계적으로 분산시키고 단기적인 모듈 확장을 자제하는 경향이 있습니다. 기술 부문의 보상 관리 시장에서 이러한 추세는 번들 가격 책정과 폭넓은 제품 라인업을 갖춘 공급업체에 유리하게 작용합니다. 왜냐하면 구매자는 여러 개의 단일 기능 도구를 추가하는 것보다 기존 관계를 더욱 공고히 하는 것을 선호하는 경향이 있기 때문입니다. 이러한 추세는 대규모 플랫폼을 뒷받침하는 한편, 특정하고 좁은 보상 활용 사례만을 다루는 소규모 공급업체들에게는 어려운 상황을 초래하고 있습니다.
부문별 분석
2025년 기준으로 기술 부문의 보상 관리 시장에서 소프트웨어가 71.12%를 차지했으나, 서비스 부문은 2031년까지 연평균 성장률(CAGR) 15.23%로 확대될 것으로 전망됩니다. 이러한 내역은 소프트웨어 구독이 여전히 수익의 기반을 이루고 있음을 보여주는 한편, 구매자들이 플랫폼 그 자체를 넘어서는 지원을 점점 더 필요로 하고 있음을 시사합니다. 기술 부문의 보상 관리 시장에서 서비스에 대한 수요가 증가하고 있는 이유는 여러 국가에 걸친 보상 설계, 워크플로우 설정, 데이터 마이그레이션, 정책 통합과 같은 업무를 사내 팀만으로는 수행하기 어렵기 때문입니다. 또한, 기술 기업의 보상 체계 변경은 인사, 재무, 관리자, 채용 담당자, 법무 팀에 동시에 영향을 미치는 경우가 많기 때문에 이에 대한 서비스 수요가 증가하고 있는 점도 반영되어 있습니다.
따라서 기술 업계의 보상 관리는 소프트웨어 및 서비스가 예산을 놓고 경쟁하는 것이 아니라, 서로를 보완하는 모델로 전환되고 있습니다. 체계적으로 정리되고 상호 연계된 보상 데이터를 보유한 조직은 의사결정이 신속해지며, 노동 환경의 변화에도 혼란을 최소화하면서 적응할 수 있는 경향이 있습니다. 이를 통해 도입 및 자문 지원의 가치에 대한 인식이 높아집니다. 이러한 성과 차이는 중요합니다. 왜냐하면 많은 기술 기업의 고용주들은 단순한 도구를 구매하는 것이 아니라, 보상 거버넌스를 위한 운영 모델을 구매하고 있기 때문입니다. 또한, 기업 계약에서 보안 및 규정 준수와 관련된 조항의 활용이 증가하고 있는 점도 서비스 수요를 뒷받침하고 있으며, 이에 따라 벤더와 도입 파트너는 초기 도입 단계 이후에도 지속적으로 관여해야할 것으로 요구받고 있습니다.
2025년에는 클라우드 기반 도입이 68.45%의 점유율을 차지한 반면, 하이브리드 도입은 2031년까지 연평균 성장률(CAGR) 14.89%를 나타낼 것으로 전망됩니다. 클라우드가 주도적인 위치를 차지하고 있다는 사실은 관리형 인프라, 손쉬운 업데이트, 그리고 최신 HR 시스템과의 원활한 통합에 대한 강력한 수요를 반영하고 있습니다. 그렇다고는 해도, 기술 분야의 보상 관리는 On-Premise에서 클라우드로 일직선으로 전환되고 있는 것은 아닙니다. 많은 대기업에서는 당장 교체할 수 없는 시스템을 여전히 운영하고 있기 때문입니다. 하이브리드 모델은 클라우드 기반의 분석 기능과 워크플로우의 유연성을 추구하는 한편, 기밀성이 높은 기록, 데이터 상주 요건, 혹은 기존 엔터프라이즈 아키텍처로 인해 여전히 로컬 관리가 필요한 기업들 사이에서 지지를 얻고 있습니다.
기술 부문의 보상 관리 시장에서 하이브리드 방식의 도입이 증가하고 있는 이유는 보상 데이터가 한곳에 집약되는 경우가 드물기 때문입니다. 대기업의 경우, 클라우드 기반 HRIS, On-Premise 재무 도구, 독립적인 주식 보상 관리 시스템, 지역별 급여 계산 시스템 등을 병행하여 사용하는 경우가 있으므로, 시스템을 완전히 교체하는 것보다 보상 관리 체계를 하이브리드화하는 편이 더 현실적입니다. 2026년에, SOC 2 Type II를 준수하는 안전한 환경에서 ‘Compose Insights’ 및 ‘Predictive Compensation’이 출시된 것은 각 벤더들이 모든 구매자가 단순한 클라우드 전용 설정을 원한다고 가정하지 않고, 보다 엄격한 기업 거버넌스 요구에 부응하는 제품을 설계하고 있음을 보여줍니다. 그 결과, 하이브리드 모델의 성장은 기술 부문의 보상 관리 시장에서 일시적인 과도기가 아니라, 전 세계 기술 조직 전반에 걸쳐 혼합 환경을 지원해야 하는 지속적인 필요성을 반영한 것입니다.
지역별 분석
2025년, 북미는 기술 부문의 전 세계 보상 관리 시장의 41.05%를 차지했습니다. 이 지역이 주도적인 위치를 차지하고 있는 이유는 미국에 수많은 기술 분야 고용주가 있는 한편, 보수 공개에 관한 적극적인 규제로 인해 보수 거버넌스가 항상 중요한 과제로 자리 잡고 있기 때문입니다. ‘동일노동동일임금법(Equal Pay for Equal Work Act)’에 따른 시정 권고 및 과태료 부과 사례를 포함한 콜로라도주의 집행 실적이, 규정 준수 위험이 이론상의 문제가 아니라 현실적인 문제임을 보여주고 있습니다. COLORADO CDLE. 캐나다는 국경을 넘어 사업을 영위하는 고용주에게 추가적인 보고 요건을 부과하고 있습니다. 한편, 멕시코는 미국이나 유럽의 모회사가 정한 보상 거버넌스 기준의 영향을 받고 있습니다.
2025년, 유럽은 제2위의 지역 시장이 되었으며, 독일, 영국, 프랑스가 주요 수요 거점으로 자리 잡았습니다. EU의 임금 투명성 지침에 따라 고용주들은 보다 공식적이고 문서화된 보상 절차를 마련해야 하는 상황에 놓여 있어, 유럽 기술 분야의 보상 관리 시장은 구조적인 성장 동력을 얻고 있습니다. 또한, 유럽 내 국가별 차이도 업무 부담을 가중시키고 있어, 고용주는 지역별 보상 전략을 현지 공개, 문서화 및 직원과의 협의에 관한 규정에 맞추어 조정해야 합니다. 독일에서는 이미 임금 투명성 체계가 확립되어 있었기 때문에 이 나라의 많은 고용주들은 처음부터 시작하는 대신 기존 시스템의 개선에 주력하고 있습니다. 남미 전역에서 브라질과 아르헨티나는 여전히 가장 활발한 시장을 형성하고 있습니다. 이는 다국적 기술 기업의 고용주들이 현지 규정에 의해 완전히 의무화되기 전에 자사의 사업에 북미나 유럽의 보상 기준을 적용하는 경우가 많기 때문입니다.
아시아태평양은 가장 빠르게 성장하고 있는 지역이며, 기술 부문의 보상 관리 시장 규모는 2031년까지 연평균 성장률(CAGR) 16.73%로 확대될 것으로 전망됩니다. 인도, 한국, 동남아시아가 이러한 성장세의 대부분을 주도하고 있는데, 이는 기술 분야의 채용이 확대되고 있는 데다, 분산형 엔지니어링 모델에서 보다 강력한 보상 거버넌스가 요구되고 있기 때문입니다. 중국도 여전히 중요하지만, 현지 데이터 규제나 도입 선호도에 따라 단순한 클라우드 전용 서비스보다는 하이브리드형이나 현지 상황에 맞춘 모델이 더 적합합니다. 중동 및 아프리카에서는 도입이 초기 단계에 있지만, 다국적 기업의 보상 기준에 따라 지역 내 기술 사업이 확대됨에 따라 아랍에미리트, 사우디아라비아, 남아프리카공화국, 나이지리아에서는 꾸준한 관심이 쏠리고 있습니다.
기타 혜택 :
- 엑셀 형식 시장 예측(ME) 시트
- 3개월간의 애널리스트 지원
자주 묻는 질문
목차
제1장 서론
제2장 조사 방법
제3장 주요 요약
제4장 시장 구도
제5장 시장 규모 및 성장 예측
제6장 경쟁 구도
제7장 시장 기회 및 향후 전망
KTH 26.06.24According to Mordor Intelligence, the compensation management in technology sector market is projected to be USD 0.71 billion in 2025, USD 1.72 billion in 2026, and reach USD 3.21 billion by 2031, growing at a CAGR of 13.29% from 2026 to 2031.
This report is Segmented by Component (Software, and Services), Deployment Mode (Cloud-Based, On-Premises, and Hybrid), Enterprise Size (Large Enterprises, and Small and Medium-Sized Enterprises), Functionality (Compensation Planning, Base Pay Management, Incentive Compensation Management, and More), and Geography. The Market Forecasts are Provided in Terms of Value (USD).
Global Compensation Management In Technology Sector Market Trends and Insights
Pay Transparency and Pay Equity Compliance Deadlines
The compensation management market in the technology sector is receiving a strong push from compliance deadlines, turning compensation software into a core control system rather than an optional HR tool. The June 7, 2026, deadline under the EU Pay Transparency Directive has forced technology employers to prepare pay-range disclosures, document pay decisions, and review internal pay gaps with much greater discipline. In the United States, pay transparency rules have also expanded across states, and employers posting remote roles must often align a single job opening with multiple disclosure obligations. Illinois has added similar expectations around salary transparency, increasing the pressure on employers that hire across multiple jurisdictions simultaneously. This is making jurisdiction-aware compensation platforms more valuable for compensation management in technology sector market, as they can maintain policy logic, approval history, and posting controls in a single system. The next wave of reporting obligations for employers with larger workforces is likely to keep compliance-led buying active well beyond the first round of disclosure preparation.
Cloud and AI Adoption In Compensation Workflows
Compensation management in technology sector industry is also being shaped by the shift from annual compensation cycles to continuous decision support. In 2026, 81% of incentive compensation teams reported using AI in some capacity, and extensive users showed a 67% preparedness rate for market shifts, much higher than lighter users. One platform highlighted its AI Pay and Compensation Agent, which leverages real-time market data from over 700 enterprises and a large skills graph to support pay recommendations, achieving a 94% offer acceptance rate and a 23% reduction in time-to-offer. Another vendor added generative AI capabilities for pay equity analysis, budget scenario modeling, and real-time compensation simulation inside a SOC 2 Type II-compliant environment, showing how providers are embedding AI into enterprise control frameworks. In the compensation management market for the technology sector, these launches matter because buyers now expect systems to dynamically guide pay decisions as conditions change, not just summarize results after the cycle closes. Vendors that keep AI tied to auditability, governance, and secure deployment are likely to gain more trust than those positioning AI as a stand-alone feature.
Budget-Constrained Pay Decisions Delay Suite Expansion
The compensation management market in the technology sector still faces slower buying cycles as technology employers move into tighter budget-control periods. Many companies protect the core planning module first and delay spending on analytics, transparency, or equity extensions until headcount and hiring plans become clearer. This is especially visible among smaller technology firms that understand the governance need but cannot always defend a broader platform rollout during periods of hiring caution. The spending pattern does not usually remove compensation software from the roadmap, but it does stretch deployment into phases and reduce short-term module expansion. In the compensation management in technology sector market, this favors vendors with bundled pricing and a wider product footprint, as buyers often prefer to deepen an existing relationship rather than add several point tools. That dynamic supports large platforms while making it harder for smaller vendors that cover only one narrow compensation use case.
Other drivers and restraints analyzed in the detailed report include:
- Competition for Scarce AI, Cloud, And Cybersecurity Talent
- Enterprise Shift from Spreadsheets to Audit-Ready Compensation Systems
- Integration Complexity Across HRIS, Payroll, Equity, And Finance Systems
For complete list of drivers and restraints, kindly check the Table Of Contents.
Segment Analysis
Software accounted for 71.12% of the compensation management in the technology sector market in 2025, while services are projected to expand at a 15.23% CAGR through 2031. That split shows that software subscriptions remain the revenue base, but it also shows that buyers increasingly need support beyond the platform itself. In the compensation management market in the technology sector, demand for services is rising because multi-country compensation design, workflow setup, data migration, and policy alignment are difficult to execute with internal teams alone. The need for services also reflects the fact that compensation changes within technology firms often affect HR, finance, managers, recruiters, and legal teams simultaneously.
The compensation management in the technology sector is therefore moving toward a model in which software and services reinforce each other rather than compete for budget. Organizations with clean, connected compensation data tend to make faster decisions and adjust to labor shifts with less disruption, which increases the perceived value of implementation and advisory support. That outcome gap matters because many technology employers are not buying a tool alone; they are buying an operating model for compensation governance. Service demand is also supported by the growing use of security and compliance commitments in enterprise contracts, which pushes vendors and implementation partners to stay involved after the initial rollout.
Cloud-based deployment commanded 68.45% share in 2025, while hybrid deployment is forecast to grow at a 14.89% CAGR through 2031. The leading cloud position reflects the strong preference for managed infrastructure, easier updates, and smoother integration with modern HR systems. Even so, compensation management in the technology sector is not moving in a straight line from on-premises to the cloud, because many large employers still operate systems they cannot quickly replace. Hybrid models are gaining traction where employers want cloud analytics and workflow flexibility but still need local control for sensitive records, data residency requirements, or older enterprise architecture.
The compensation management market in the technology sector is seeing hybrid adoption rise because compensation data rarely resides in a single place. A large employer may use a cloud HRIS, on-premises finance tools, separate equity administration, and regional payroll systems, making a blended compensation layer more practical than a full replacement. The 2026 launch of Compose Insights and Predictive Compensation in a secure, SOC 2 Type II-compliant environment demonstrated that vendors are designing products that meet stricter enterprise governance expectations rather than assuming every buyer wants a simple cloud-only setup. As a result, hybrid growth is not a temporary transition in compensation management in technology sector market; it reflects a durable need to support mixed estates across global technology organizations.
Geography Analysis
North America accounted for 41.05% of the global compensation management in the technology sector market in 2025. The region leads because the United States combines a large technology employer base with active pay disclosure rules that keep compensation governance high on the agenda. Colorado's enforcement record, including citation fines issued under the Equal Pay for Equal Work Act, shows that compliance risk is real rather than theoretical. COLORADO CDLE. Canada adds another layer of reporting expectations for cross-border employers, while Mexico is being influenced by compensation governance standards set by U.S. and European parent companies.
Europe was the second-largest regional market in 2025, with Germany, the United Kingdom, and France acting as the main demand centers. The compensation management market in the technology sector is receiving a structural boost in Europe because the EU Pay Transparency Directive has forced employers to prepare for a more formal, documented compensation process. National differences within Europe are also increasing the workload, as employers must adapt their regional compensation strategy to local disclosure, documentation, and employee consultation rules. Germany already had an established pay transparency framework, so many employers there are focused on upgrading existing systems rather than starting from scratch. Across South America, Brazil and Argentina remain the most active markets because multinational technology employers often apply North American and European compensation standards to their operations before local regulations fully require it.
Asia-Pacific is the fastest-growing region, and the compensation management market size in the technology sector is forecast to grow at a 16.73% CAGR through 2031. India, South Korea, and Southeast Asia are driving much of that momentum because technology hiring is expanding and distributed engineering models need stronger pay governance. China remains important, but local data controls and deployment preferences make hybrid or locally adapted models more relevant than simple cloud-only offerings. In the Middle East and Africa, adoption is earlier in the cycle, yet the United Arab Emirates, Saudi Arabia, South Africa, and Nigeria are drawing steady interest as regional technology operations grow under multinational compensation standards.
- Payscale, Inc.
- Salary.com, LLC
- beqom SA
- Xactly Corporation
- CaptivateIQ, Inc.
- Varicent US Opco Corporation
- PerformanceCentre, Inc.
- HRSoft, Inc.
- Trove Information Technologies, Inc. dba Pave
- Compa Technologies, Inc.
- Syndio Solutions, Inc.
- Trusaic, Inc.
- Sysarb AB
- Aeqium, Inc.
- OpenComp, Inc.
- Everstage Inc.
- CellarStone, Inc.
- PayAnalytics hf.
- BullseyeEngagement LLC
- Iconixx Software Corporation
Additional Benefits:
- The market estimate (ME) sheet in Excel format
- 3 months of analyst support
TABLE OF CONTENTS
1 INTRODUCTION
- 1.1 Study Assumptions and Market Definition
- 1.2 Scope of the Study
2 RESEARCH METHODOLOGY
3 EXECUTIVE SUMMARY
4 MARKET LANDSCAPE
- 4.1 Market Overview
- 4.2 Market Drivers
- 4.2.1 Pay Transparency and Pay Equity Compliance Deadlines
- 4.2.2 Cloud and AI Adoption in Compensation Workflows
- 4.2.3 Competition for Scarce AI, Cloud, and Cybersecurity Talent
- 4.2.4 Enterprise Shift from Spreadsheets to Audit-Ready Compensation Systems
- 4.2.5 Growing Need for Multi-Country Compensation Governance in Distributed Tech Teams
- 4.2.6 Real-Time Benchmarking Demand as Annual Salary Surveys Age Too Quickly
- 4.3 Market Restraints
- 4.3.1 Budget-Constrained Pay Decisions Delay Suite Expansion
- 4.3.2 Integration Complexity Across HRIS, Payroll, Equity, and Finance Systems
- 4.3.3 Skill Premium Compression Forces Frequent Repricing of Tech Roles
- 4.3.4 Salary-Source Misinformation and Location-Pay Friction Undermine Trust in Formal Pay Programs
- 4.4 Industry Value-Chain Analysis
- 4.5 Impact of Macroeconomic Factors on the Market
- 4.6 Regulatory Landscape
- 4.7 Technological Outlook
- 4.8 Porter's Five Forces Analysis
- 4.8.1 Bargaining Power of Buyers
- 4.8.2 Bargaining Power of Suppliers
- 4.8.3 Threat of New Entrants
- 4.8.4 Threat of Substitutes
- 4.8.5 Intensity of Competitive Rivalry
5 MARKET SIZE AND GROWTH FORECASTS (VALUE)
- 5.1 By Component
- 5.1.1 Software
- 5.1.2 Services
- 5.2 By Deployment Mode
- 5.2.1 Cloud-Based
- 5.2.2 On-Premises
- 5.2.3 Hybrid
- 5.3 By Enterprise Size
- 5.3.1 Large Enterprises
- 5.3.2 Small and Medium-Sized Enterprises
- 5.4 By Functionality
- 5.4.1 Compensation Planning
- 5.4.2 Base Pay Management
- 5.4.3 Incentive Compensation Management
- 5.4.4 Equity Compensation Management
- 5.4.5 Pay Equity and Transparency Management
- 5.4.6 Compensation Analytics and Reporting
- 5.5 By Geography
- 5.5.1 North America
- 5.5.1.1 United States
- 5.5.1.2 Canada
- 5.5.1.3 Mexico
- 5.5.2 South America
- 5.5.2.1 Brazil
- 5.5.2.2 Argentina
- 5.5.2.3 Rest of South America
- 5.5.3 Europe
- 5.5.3.1 Germany
- 5.5.3.2 United Kingdom
- 5.5.3.3 France
- 5.5.3.4 Italy
- 5.5.3.5 Spain
- 5.5.3.6 Russia
- 5.5.3.7 Netherlands
- 5.5.3.8 Rest of Europe
- 5.5.4 Asia-Pacific
- 5.5.4.1 China
- 5.5.4.2 Japan
- 5.5.4.3 India
- 5.5.4.4 South Korea
- 5.5.4.5 Australia and New Zealand
- 5.5.4.6 Rest of Asia-Pacific
- 5.5.5 Middle East
- 5.5.5.1 Saudi Arabia
- 5.5.5.2 United Arab Emirates
- 5.5.5.3 Rest of Middle East
- 5.5.6 Africa
- 5.5.6.1 South Africa
- 5.5.6.2 Nigeria
- 5.5.6.3 Rest of Africa
- 5.5.1 North America
6 COMPETITIVE LANDSCAPE
- 6.1 Market Concentration
- 6.2 Strategic Moves
- 6.3 Market Share Analysis
- 6.4 Company Profiles (includes Global Level Overview, Market Level Overview, Core Segments, Financials as available, Strategic Information, Market Rank/Share, Products and Services, Recent Developments).
- 6.4.1 Payscale, Inc.
- 6.4.2 Salary.com, LLC
- 6.4.3 beqom SA
- 6.4.4 Xactly Corporation
- 6.4.5 CaptivateIQ, Inc.
- 6.4.6 Varicent US Opco Corporation
- 6.4.7 PerformanceCentre, Inc.
- 6.4.8 HRSoft, Inc.
- 6.4.9 Trove Information Technologies, Inc. dba Pave
- 6.4.10 Compa Technologies, Inc.
- 6.4.11 Syndio Solutions, Inc.
- 6.4.12 Trusaic, Inc.
- 6.4.13 Sysarb AB
- 6.4.14 Aeqium, Inc.
- 6.4.15 OpenComp, Inc.
- 6.4.16 Everstage Inc.
- 6.4.17 CellarStone, Inc.
- 6.4.18 PayAnalytics hf.
- 6.4.19 BullseyeEngagement LLC
- 6.4.20 Iconixx Software Corporation
7 MARKET OPPORTUNITIES AND FUTURE OUTLOOK
- 7.1 White-Space and Unmet-Need Assessment
