
|
시장보고서
상품코드
2073587
반도체 디바이스 : 시장 점유율 분석, 업계 동향 및 통계, 성장 예측(2025-2030년)Semiconductor Device - Market Share Analysis, Industry Trends & Statistics, Growth Forecasts (2025 - 2030) |
||||||
 Mordor Intelligence
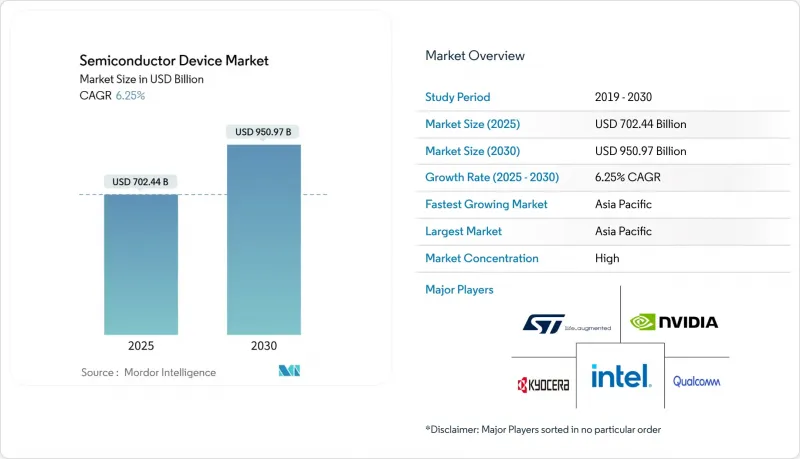
Mordor Intelligence에 의하면, 반도체 디바이스 시장 규모는 2025년에 7,024억 4,000만 달러로 평가되었습니다. 2030년까지 9,509억 7,000만 달러에 이를 것으로 예측되며, 이 기간 CAGR은 6.25%를 나타낼 전망입니다.
본 보고서는 디바이스 유형별(디스크리트 반도체(다이오드 등), 광전자, 센서 및 MEMS, 집적 회로), 비즈니스 모델(IDM, 설계/팹리스 벤더), 최종 이용 산업(자동차, 통신, 소비자용, 산업용, 컴퓨팅/데이터 스토리지, 데이터센터, AI, 정부), 지역(북미, 유럽, 아시아태평양, 남미, 중동 및 아프리카)별로 분류되어 있습니다.
세계의 반도체 디바이스 시장 동향 및 인사이트
하이퍼스케일 데이터센터에서의 AI 가속기 수요
미국과 중국의 하이퍼스케일 사업자들은 장당 1kW를 초과하는 전력을 소비하는 가속기 카드를 수용하기 위해 서버실 개보수를 진행 중이며, 이에 따라 2029년까지 1조 달러를 넘는 설비 투자 계획이 수립되었습니다. 이러한 전환을 위해서는 고대역폭 메모리와 첨단 패키징 기술을 갖춘 맞춤형 반도체가 필요하며, 최첨단 노드에서 파운드리 가동률은 90%를 초과하고 있습니다. 그 결과 발생한 미처리 수주량은 반도체 시장이 기존 예측치를 계속해서 상회하고 있는 이유를 여실히 보여주고 있습니다. 첨단 기판 및 열 관리 소재공급 부족은 공급업체의 가격 결정력을 더욱 강화하고 있습니다.
전기차 1대당 탑재되는 전력 전자 장치의 양이 급증하고 있습니다.
내연기관에서 전기 구동 시스템으로의 전환에 따라, 차량 1대당 반도체 탑재량은 약 600달러에서 2,000달러 이상으로 증가합니다. 실리콘 카바이드(SiC) MOSFET는 인버터의 효율을 최대 3퍼센트 포인트 향상시켜 주행 거리를 직접적으로 늘려줍니다. 유럽의 자동차 제조업체들이 800V 아키텍처를 선도하고 있어, 와이드 밴드갭 소자 수요가 급증하고 있습니다. 반도체 시장은 동일한 파워 모듈을 채택한 충전 인프라의 병행적인 성장에 힘입어 호조를 보이고 있습니다.
리소그래피 장비의 리드타임은 18개월 이상입니다.
대당 약 3억 8,000만 달러에 달하는 고-NA 극자외선 스테퍼는 생산 병목 현상에 직면해 있으며, 납기 기간이 18개월 이상 소요되고 있습니다. 3nm 이하 공정에 대한 수요가 증가하고 있음에도 불구하고, 장비 공급이 제한적이어서 생산 능력 확대에 제약을 받고 있습니다. 조기에 장비를 확보한 기업은 일시적으로 가격 협상에서 유리한 고지를 점할 수 있지만, 대응이 늦어진 기업은 설계 수주가 경쟁사로 넘어갈 위험을 감수해야 합니다. 공급 부족이 장기화되면서, 본래라면 견조했을 반도체 시장의 성장 전망이 둔화되고 있습니다.
부문별 분석
2024년, 집적회로(IC)는 반도체 시장의 86.1%를 차지했으며, 2030년까지 연평균 성장률(CAGR) 7.9%로 확대될 것으로 전망됩니다. 로직 및 아날로그 하위 부문은 AI 추론 엔진, 자동차 전동화 제어, 산업용 자동화 도입 확대의 혜택을 받고 있습니다. 고대역폭 메모리와 3D NAND는 AI 가속기의 성능을 뒷받침하는 기반으로서 계속해서 고가 시장 유지에 기여하고 있습니다. 디스크리트 파워 디바이스, 옵토일렉트로닉스, 센서는 매출 규모는 작지만, 전기차용 인버터나 광통신 모듈에 필수적인 시스템 수준의 기능을 구현하고 있습니다. 실리콘 카바이드(SiC) MOSFET와 갈륨 나이탈리아드(GaN) HEMT는 구동 회로의 전압 상승 추세를 반영하여 출하량이 두 자릿수 증가를 기록하고 있습니다. MEMS 관성 센서 및 환경 센서는 인더스트리 4.0 프로젝트에서 보급이 확대되고 있으며, 전체 디바이스 부문에서 균형 잡힌 성장을 보장하고 있습니다. 이러한 동향들이 맞물리면서, 집적 회로는 반도체 시장 규모 확대의 최전선에 자리매김하는 한편, 특수 부품은 신흥 틈새 시장을 개척할 수 있게 되었습니다.
지역별 분석
아시아태평양은 2024년에 전 세계 매출의 63.2%를 차지했으며, 대만의 첨단 노드 분야 리더십과 한국의 4,710억 달러 규모 메가클러스터 구축을 원동력으로 삼아 2030년까지 연평균 성장률(CAGR) 7.1%를 기록하며 성장할 것으로 전망됩니다. 중국 본토는 최첨단 노드에서는 제약을 받고 있지만, 성숙한 공정 기술을 보유한 파크와 국내 장비 공급업체에 막대한 투자를 단행하며 현지 조달률 향상을 목표로 하고 있습니다. 일본은 국내 소재 기술과 해외 파운드리 전문 지식을 결합한 합작 사업에 3조 9,000억 엔(261억 달러)을 투자하고 있는 반면, 인도는 조립·시험 및 설계 서비스의 성장을 가속화하고 있습니다.
북미는 애리조나주, 오하이오주, 텍사스주에 새로운 팹 건설을 지원하기 위한 520억 달러 규모의 “CHIPS법"에 따른 인센티브에 힘입어, 금액 기준으로 2위를 차지했습니다. 인텔은 미국 내 사업 확장을 위해 78억 6,500만 달러, TSMC는 66억 달러, 삼성은 47억 4,500만 달러의 자금을 확보했습니다. 이 지역에는 팹리스 기업의 AI 및 네트워크용 칩 설계 업체들이 밀집해 있어, 이것이 첨단 웨이퍼에 대한 지속적인 수요로 이어지고 있습니다. 미시간주와 캘리포니아주의 자동차 전기화 프로그램은 수익원을 더욱 다각화하여, 소비자 가전 시장의 주기적인 변동 속에서도 반도체 시장이 견조한 성장세를 유지할 수 있도록 보장하고 있습니다. 2023년 국방수권법(NDAA) 제5949조에 따라, 2027년부터 조달 제한이 단계적으로 도입되어 방위 관련 업무량에 있어 공급망이 국내 제조 거점으로 이전되도록 장려됩니다.
유럽 시장 점유율은 10% 미만에 그치고 있지만, 전 세계 칩 사양을 결정짓는 엄격한 자동차 및 환경 규제를 통해 기술 발전 방향에 영향을 미치고 있습니다. EU의 “칩법"는 파워 일렉트로닉스와 특수 아날로그 분야에 중점을 둔 드레스덴 및 아인트호벤 프로젝트에 대한 인센티브 제도를 통해, 2030년까지 생산 점유율 20% 달성을 목표로 하고 있습니다. 독일은 고급차용 반도체 수요를 뒷받침하는 한편, 북유럽 국가들의 전력망에서는 재생에너지용으로 와이드밴드갭 소자가 채택되고 있습니다. 산학 협력을 통한 공동 연구 개발 얼라이언스는 대학과 산업계의 협력을 바탕으로, 반도체 시장 전반에서 높이 평가받는 신뢰성과 안전성 인증이라는 강점을 활용하여 유럽을 역량 센터로 자리매김하고 있습니다.
기타 혜택 :
- 엑셀 형식 시장 예측(ME) 시트
- 3개월간의 애널리스트 지원
자주 묻는 질문
목차
제1장 서론
제2장 조사 방법
제3장 주요 요약
제4장 시장 구도
제5장 시장 규모 및 성장 예측
제6장 경쟁 구도
제7장 시장 기회 및 향후 전망
KTH 26.07.08According to Mordor Intelligence, the semiconductor device market size reached USD 702.44 billion in 2025 and is forecast to attain USD 950.97 billion by 2030, translating into a 6.25% CAGR over the period.
This report is Segmented by Device Type (Discrete Semiconductors [Diodes, and More], Optoelectronics, Sensors and MEMS, and Integrated Circuits), Business Model (IDM, and Design/ Fabless Vendor), End-Use Industry (Automotive, Communication, Consumer, Industrial, Computing/Data Storage, Data Center, AI, and Government), and Geography (North America, Europe, Asia-Pacific, South America, and Middle East and Africa).
Global Semiconductor Device Market Trends and Insights
AI accelerator demand in hyperscale data centers
Hyperscale operators in the United States and China are retrofitting server halls to support accelerator cards that draw over 1 kW each, prompting capital-expenditure plans topping USD 1 trillion by 2029. The shift requires custom silicon with high-bandwidth memory and advanced packaging, pushing foundry utilization above 90% at leading-edge nodes. The resulting backlog underlines why the semiconductor market continues to outpace earlier forecasts. Scarcity of advanced substrates and thermal-management materials further amplifies pricing power for suppliers.
EV power-electronics content per vehicle surging.
Transition from internal-combustion to electric drivetrains lifts silicon content from roughly USD 600 to more than USD 2,000 per car. Silicon-carbide MOSFETs raise inverter efficiency by up to 3 percentage points, directly extending driving range. European automakers spearhead 800-V architectures, accelerating demand for wide-bandgap devices. The semiconductor market benefits from parallel growth in charging infrastructure that employs the same power modules.
Lithography tool lead times> 18 months
High-NA extreme-ultraviolet steppers priced near USD 380 million each face production bottlenecks, with deliveries stretching beyond 18 months. Limited tool availability caps capacity additions even as demand for 3 nm-and-below processes climbs. Early tool recipients obtain temporary pricing leverage, while laggards risk design wins migrating to competitors. Prolonged supply gaps temper the semiconductor market's otherwise strong growth outlook.
Other drivers and restraints analyzed in the detailed report include:
- ADAS semiconductor penetration in next-gen vehicles
- Industrial edge-IoT sensor proliferation
- Export-control curbs on advanced nodes
For complete list of drivers and restraints, kindly check the Table Of Contents.
Segment Analysis
Integrated circuits captured 86.1% of the semiconductor market in 2024 and are projected to advance at a 7.9% CAGR through 2030. Logic and analog sub-segments gain from AI inference engines, vehicle-electrification control, and industrial automation rollouts. High-bandwidth memory and 3-D NAND remain cornerstones of AI accelerator performance, reinforcing premium pricing. Discrete power devices, optoelectronics, and sensors, though smaller in dollar terms, enable system-level functionality vital for EV inverters and optical-communication modules. Silicon-carbide MOSFETs and gallium-nitride HEMTs post double-digit volume gains, reflecting drivetrain voltage escalation trends. MEMS inertial and environmental sensors proliferate in Industry 4.0 projects, ensuring balanced growth across device classes. These trends collectively position integrated circuits at the forefront of the semiconductor market size expansion while permitting specialized components to capture emerging niches.
Complete Report Scope:
- By Device Type (Shipment Volume for Device Type is Complementary)
- Discrete Semiconductors
- Diodes
- Transistors
- Power Transistors
- Rectifier and Thyristor
- Other Discrete Devices
- Optoelectronics
- Light-Emitting Diodes (LEDs)
- Laser Diodes
- Image Sensors
- Optocouplers
- Other Device Types
- Sensors and MEMS
- Pressure
- Magnetic Field
- Actuators
- Acceleration and Yaw Rate
- Temperature and Others
- Integrated Circuits
- By Integrated Circuit Type
- Analog
- Micro
- Microprocessors (MPU)
- Microcontrollers (MCU)
- Digital Signal Processors
- Logic
- Memory
- By Technology Node (Shipment Volume Not Applicable)
- < 3nm
- 3nm
- 5nm
- 7nm
- 16nm
- 28nm
- > 28nm
- By Integrated Circuit Type
- Discrete Semiconductors
- By Business Model
- IDM
- Design/ Fabless Vendor
- By End-user Industry
- Automotive
- Communication (Wired and Wireless)
- Consumer
- Industrial
- Computing/Data Storage
- Data Center
- AI
- Government (Aerospace and Defense)
- By Geography
- North America
- United States
- Canada
- Mexico
- South America
- Brazil
- Mexico
- Argentina
- Rest of South America
- Europe
- Germany
- France
- United Kingdom
- Nordics
- Rest of Europe
- Asia-Pacific
- China
- Taiwan
- South Korea
- Japan
- India
- Rest of Asia-Pacific
- Middle East and Africa
- Middle East
- Saudi Arabia
- United Arab Emirates
- Turkey
- Rest of Middle East
- Africa
- South Africa
- Rest of Africa
- Middle East
- North America
Geography Analysis
Asia-Pacific commanded 63.2% of global revenue in 2024 and is forecast to grow at a 7.1% CAGR to 2030, anchored by Taiwan's advanced-node leadership and South Korea's USD 471 billion megacluster build-out. Mainland China, while constrained at leading nodes, invests heavily in mature-process parks and domestic equipment suppliers, aiming to lift local content ratios. Japan channels ¥3.9 trillion (USD 26.1 billion) into joint ventures that couple domestic materials prowess with external foundry expertise, while India accelerates assembly-test and design-services growth.
North America ranks second by value, catalyzed by USD 52 billion CHIPS Act incentives that underwrite new fabs in Arizona, Ohio, and Texas. Intel secured USD 7.865 billion, TSMC USD 6.6 billion, and Samsung USD 4.745 billion for U.S. expansions. The region houses a dense cluster of fabless AI and networking chip designers, translating into sustained demand for advanced wafers. Automotive electrification programs in Michigan and California further diversify revenue streams, ensuring the semiconductor market remains robust even amid cyclical consumer-electronics swings. Section 5949 of the 2023 NDAA will phase in procurement restrictions in 2027, nudging supply chains toward domestic nodes for defense-linked workloads.
Europe, holding under 10% share, nonetheless influences technology direction through stringent automotive and environmental regulations that shape chip specifications worldwide. The EU Chips Act targets a 20% production share by 2030 via incentive pools for Dresden and Eindhoven projects focusing on power electronics and specialty analog. Germany anchors premium vehicle semiconductor demand, while Nordic grids adopt wide-bandgap devices for renewables. Collaborative R&D alliances leverage university-industry ties, positioning the continent as a competence center for reliability and safety certification-attributes prized across the semiconductor market.
- Intel Corporation
- Taiwan Semiconductor Manufacturing Co. Ltd. (TSMC)
- Samsung Electronics Co. Ltd.
- Nvidia Corporation
- Qualcomm Incorporated
- Texas Instruments Inc.
- SK Hynix Inc.
- Micron Technology Inc.
- Broadcom Inc.
- Advanced Micro Devices Inc. (AMD)
- Analog Devices Inc.
- NXP Semiconductors NV
- Infineon Technologies AG
- STMicroelectronics NV
- ON Semiconductor Corp.
- Renesas Electronics Corp.
- Wolfspeed Inc.
- GlobalFoundries Inc.
- United Microelectronics Corp. (UMC)
- ASE Technology Holding Co. Ltd.
- ROHM Co. Ltd.
- Kyocera Corp.
- Toshiba Corp.
- Fujitsu Semiconductor Ltd.
- Marvell Technology Inc.
Additional Benefits:
- The market estimate (ME) sheet in Excel format
- 3 months of analyst support
TABLE OF CONTENTS
1 INTRODUCTION
- 1.1 Study Assumptions and Market Definition
- 1.2 Scope of the Study
2 RESEARCH METHODOLOGY
3 EXECUTIVE SUMMARY
4 MARKET LANDSCAPE
- 4.1 Market Overview
- 4.2 Market Drivers
- 4.2.1 AI Accelerator Demand in Hyperscale Data Centers (US and China)
- 4.2.2 EV Power-Electronics Content per Vehicle Surging
- 4.2.3 ADAS Semiconductor Penetration in Next-Gen Vehicles
- 4.2.4 Industrial Edge-IoT Sensor Proliferation (Europe)
- 4.2.5 5G RF-Front-End Complexity (Korea and China)
- 4.2.6 US/EU CHIPS-Act Fab Incentives
- 4.3 Market Restraints
- 4.3.1 Lithography Tool Lead-Times >18 Months
- 4.3.2 Export-Control Curbs on Advanced Nodes (China)
- 4.3.3 High Fab Capex and Energy Intensity
- 4.3.4 Engineering-Talent Shortage
- 4.4 Technological Trends
- 4.5 Industry Value Chain Analysis
- 4.6 Semiconductor Foundry Landscape
- 4.6.1 Foundry Revenue and Share by Player
- 4.6.2 IDM vs Fabless Semiconductor Sales
- 4.6.3 Installed Wafer Capacity by Fab Location
- 4.6.4 Wafer Capacity by Company and Node Technology
- 4.7 Regulatory and Trade-Policy Outlook
- 4.8 Porter's Five Forces Analysis
- 4.8.1 Bargaining Power of Suppliers
- 4.8.2 Bargaining Power of Buyers
- 4.8.3 Threat of New Entrants
- 4.8.4 Threat of Substitutes
- 4.8.5 Intensity of Competitive Rivalry
- 4.9 Investment Analysis
- 4.10 Impact of Macroeconomic Factors
5 MARKET SIZE AND GROWTH FORECASTS (VALUE)
- 5.1 By Device Type (Shipment Volume for Device Type is Complementary)
- 5.1.1 Discrete Semiconductors
- 5.1.1.1 Diodes
- 5.1.1.2 Transistors
- 5.1.1.3 Power Transistors
- 5.1.1.4 Rectifier and Thyristor
- 5.1.1.5 Other Discrete Devices
- 5.1.2 Optoelectronics
- 5.1.2.1 Light-Emitting Diodes (LEDs)
- 5.1.2.2 Laser Diodes
- 5.1.2.3 Image Sensors
- 5.1.2.4 Optocouplers
- 5.1.2.5 Other Device Types
- 5.1.3 Sensors and MEMS
- 5.1.3.1 Pressure
- 5.1.3.2 Magnetic Field
- 5.1.3.3 Actuators
- 5.1.3.4 Acceleration and Yaw Rate
- 5.1.3.5 Temperature and Others
- 5.1.4 Integrated Circuits
- 5.1.4.1 By Integrated Circuit Type
- 5.1.4.1.1 Analog
- 5.1.4.1.2 Micro
- 5.1.4.1.2.1 Microprocessors (MPU)
- 5.1.4.1.2.2 Microcontrollers (MCU)
- 5.1.4.1.2.3 Digital Signal Processors
- 5.1.4.1.3 Logic
- 5.1.4.1.4 Memory
- 5.1.4.2 By Technology Node (Shipment Volume Not Applicable)
- 5.1.4.2.1 < 3nm
- 5.1.4.2.2 3nm
- 5.1.4.2.3 5nm
- 5.1.4.2.4 7nm
- 5.1.4.2.5 16nm
- 5.1.4.2.6 28nm
- 5.1.4.2.7 > 28nm
- 5.1.4.1 By Integrated Circuit Type
- 5.1.1 Discrete Semiconductors
- 5.2 By Business Model
- 5.2.1 IDM
- 5.2.2 Design/ Fabless Vendor
- 5.3 By End-user Industry
- 5.3.1 Automotive
- 5.3.2 Communication (Wired and Wireless)
- 5.3.3 Consumer
- 5.3.4 Industrial
- 5.3.5 Computing/Data Storage
- 5.3.6 Data Center
- 5.3.7 AI
- 5.3.8 Government (Aerospace and Defense)
- 5.4 By Geography
- 5.4.1 North America
- 5.4.1.1 United States
- 5.4.1.2 Canada
- 5.4.1.3 Mexico
- 5.4.2 South America
- 5.4.2.1 Brazil
- 5.4.2.2 Mexico
- 5.4.2.3 Argentina
- 5.4.2.4 Rest of South America
- 5.4.3 Europe
- 5.4.3.1 Germany
- 5.4.3.2 France
- 5.4.3.3 United Kingdom
- 5.4.3.4 Nordics
- 5.4.3.5 Rest of Europe
- 5.4.4 Asia-Pacific
- 5.4.4.1 China
- 5.4.4.2 Taiwan
- 5.4.4.3 South Korea
- 5.4.4.4 Japan
- 5.4.4.5 India
- 5.4.4.6 Rest of Asia-Pacific
- 5.4.5 Middle East and Africa
- 5.4.5.1 Middle East
- 5.4.5.1.1 Saudi Arabia
- 5.4.5.1.2 United Arab Emirates
- 5.4.5.1.3 Turkey
- 5.4.5.1.4 Rest of Middle East
- 5.4.5.2 Africa
- 5.4.5.2.1 South Africa
- 5.4.5.2.2 Rest of Africa
- 5.4.5.1 Middle East
- 5.4.1 North America
6 COMPETITIVE LANDSCAPE
- 6.1 Market Concentration
- 6.2 Strategic Moves
- 6.3 Market Share Analysis
- 6.4 Company Profiles (includes Global level Overview, Market level overview, Core Segments, Financials as available, Strategic Information, Market Rank/Share for key companies, Products and Services, and Recent Developments)
- 6.4.1 Intel Corporation
- 6.4.2 Taiwan Semiconductor Manufacturing Co. Ltd. (TSMC)
- 6.4.3 Samsung Electronics Co. Ltd.
- 6.4.4 Nvidia Corporation
- 6.4.5 Qualcomm Incorporated
- 6.4.6 Texas Instruments Inc.
- 6.4.7 SK Hynix Inc.
- 6.4.8 Micron Technology Inc.
- 6.4.9 Broadcom Inc.
- 6.4.10 Advanced Micro Devices Inc. (AMD)
- 6.4.11 Analog Devices Inc.
- 6.4.12 NXP Semiconductors NV
- 6.4.13 Infineon Technologies AG
- 6.4.14 STMicroelectronics NV
- 6.4.15 ON Semiconductor Corp.
- 6.4.16 Renesas Electronics Corp.
- 6.4.17 Wolfspeed Inc.
- 6.4.18 GlobalFoundries Inc.
- 6.4.19 United Microelectronics Corp. (UMC)
- 6.4.20 ASE Technology Holding Co. Ltd.
- 6.4.21 ROHM Co. Ltd.
- 6.4.22 Kyocera Corp.
- 6.4.23 Toshiba Corp.
- 6.4.24 Fujitsu Semiconductor Ltd.
- 6.4.25 Marvell Technology Inc.
7 MARKET OPPORTUNITIES AND FUTURE OUTLOOK
- 7.1 White-space and Unmet-Need Assessment