
|
시장보고서
상품코드
2100006
처리용 반도체 소자 시장 : 점유율 분석, 업계 동향 및 통계, 성장 예측(2026-2031년)Asia-Pacific Semiconductor Device For Processing Applications - Market Share Analysis, Industry Trends & Statistics, Growth Forecasts (2026 - 2031) |
||||||
 Mordor Intelligence
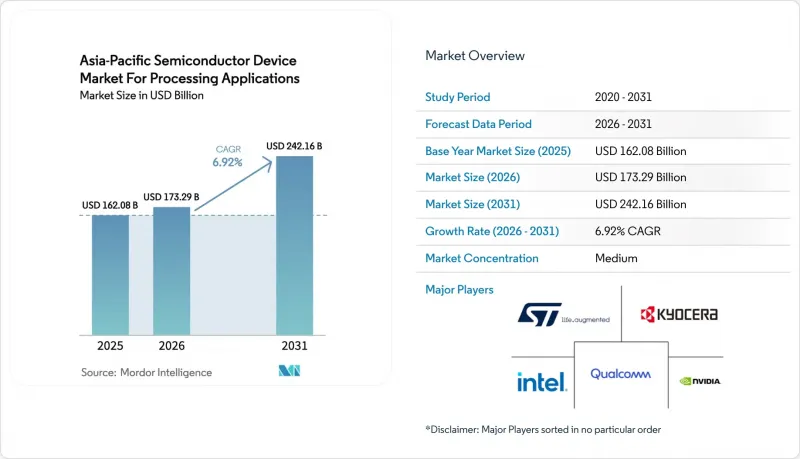
Mordor Intelligence에 의하면, 아시아태평양 처리용 반도체 소자 시장 규모는 2025년에 1,620억 8,000만 달러로 평가되었고 2026년 1,732억 9,000만 달러에서 성장하여 2031년까지 2,421억 6,000만 달러에 이를 것으로 예측되며, 예측 기간(2026-2031년) CAGR은 6.92%를 나타낼 전망입니다.
본 보고서는 디바이스 유형(디스크리트 반도체, 옵토일렉트로닉스 등), 처리 아키텍처(x86, ARM 등), 제조 공정(7nm 미만, 8-16nm 등), 최종 사용자 산업(소비자 가전, 자동차, 산업 및 제조 등) 및 지역별로 분류되어 있습니다. 시장 전망은 금액(달러) 기준으로 제시되어 있습니다.
아시아태평양 처리용 반도체 소자 시장 인사이트 및 동향
AI/ML 및 데이터센터 수요 급증
생성형 AI 클러스터에서는 각 GPU에 8개의 HBM3 스택을 결합한 도메인 특화형 가속기가 도입되고 있으며, 이로 인해 메모리의 평균 판매 가격(ASP)이 상승하고, 첨단 패키징 능력에 대한 부담이 커지고 있습니다. TSMC는 2024년에 CoWoS 생산 라인을 50% 증설하고, 2.5D 및 3D 통합을 지원하기 위해 구마모토에 새로운 거점을 건설하는 데 110억 달러를 투자하기로 결정했습니다. 클라우드 사업자들은 ARM 기반의 Graviton 및 Ampere CPU를 도입하고 있으며, 이는 2024년 아시아태평양의 인스턴스 출시의 28%를 차지하여 x86에서 전환하는 추세가 두드러지고 있습니다. 중국의 ‘주권 AI’ 정책에 따라 국내 클라우드 사업자들은 14나노미터 노드라도 국내에서 제조된 추론용 칩을 채택해야 할 의무가 있으며, 이에 따라 수요는 SMIC와 화웨이 하이실리콘으로 이동하고 있습니다. 한편, 랙당 전력 밀도가 100kW에 육박하는 상황은 액체 냉각 인프라가 칩 조립 공정과 동일한 시설 내에 배치되어 있는 싱가포르와 말레이시아에 유리하게 작용하고 있습니다.
5G 지원 IoT 기기의 보급
2024년, 아시아태평양의 셀룰러 IoT 연결 건수는 21억 건을 돌파했습니다. 이는 유틸리티자가 NB-IoT 지원 스마트 계량기를 도입하고, 물류 기업이 콜드체인 컨테이너에 Cat-M 모듈을 탑재한 것이 주된 요인입니다. 각 엔드포인트에는 3-5개의 반도체가 탑재되어 있지만, 평균 판매 가격(ASP)이 1달러 미만이어서 이익률이 압박받고 있으며, 대량 생산 업무는 성숙한 28나노미터 및 40나노미터 제조 라인을 가동하는 파운드리로 이동하고 있습니다. 인도의 5G 구축은 400개 도시에 이르고 있으며, 대만 및 일본의 전문 제조업체로부터 조달되는 6GHz 미만 RF 필터에 대한 수요를 견인하고 있습니다. 자동차용 텔레매틱스 모듈은 5G RedCap으로 전환되고 있으며, 이러한 변화는 기능 안전 인증을 취득한 르네사스와 NXP에게 호재가 되고 있습니다.
첨단 제조 장비를 둘러싼 수출 규제와 지정학적 상황
미국은 2024년 10월, 중국 팹에서의 DUV 침지 스캐너 유지보수 서비스를 금지했으며, 일본은 23유형의 반도체 제조 장비 수출을 제한했습니다. 이로 인해 중국의 파운드리 업체들은 14나노미터 노드에서 멀티패터닝에 의존할 수밖에 없게 되었고, 웨이퍼 사이클이 장기화되면서 트랜지스터당 비용이 3분의 1 증가했습니다. TSMC와 삼성이 62대의 High-NA EUV 시스템을 선주문함에 따라 ASML의 수주 잔고는 18개월 분에 달하고 있으며, 설령 라이선싱 규제가 완화된다 하더라도 신규 진출기업을 위한 단기적인 생산 능력은 남아 있지 않습니다.
부문 분석
아시아태평양의 반도체 소자 시장에서 2025년 매출의 45.12%를 집적 회로가 차지하고 있으며, 하이퍼스케일러가 기판 수준에서 모노리식 AI 가속기로 전환함에 따라 2031년까지 연평균 성장률(CAGR) 7.85%로 확대되어 디스크리트 반도체를 능가할 전망입니다. 이러한 급성장을 주도하고 있는 것은 로직 제품이며, TSMC의 N3E 공정 노드를 채택한 NVIDIA의 H200은 이전 세대 제품에 비해 TOPS/와트가 40% 향상되어 웨이퍼의 평균 단가를 끌어올리고 있습니다.
디스크리트 반도체, 광전자, 센서의 합계 점유율은 54.88%를 차지하고 있지만, 경쟁으로 인해 평균 판매 가격(ASP) 상승세가 둔화되고 있어 연평균 성장률(CAGR)은 6.35%에 그칠 것으로 예상되며, IC의 성장률에는 미치지 못할 전망입니다. 실리콘 카바이드(SiC) 디바이스의 매출은 150mm 웨이퍼 공급 부족으로 제약을 받고 있으며, 리드타임이 52주에 달하고 있습니다. 한편, 코패키지드 옵틱스의 도입으로 모듈의 BOM(부품표) 비용이 22% 절감되면서 포토닉스 분야의 이익률이 압박받고 있습니다.
2025년에는 ARM 설계가 72.45%의 점유율을 차지하며 스마트폰, 클라우드 서버, 자동차용 컴퓨팅을 주도하는 한편, 각국 정부가 명령어 세트의 자율성을 우선시하는 가운데 RISC-V 코어는 연평균 성장률(CAGR) 8.48%로 성장할 전망입니다.
아시아태평양의 RISC-V 솔루션용 반도체 소자 시장 규모는 로열티 프리 라이선싱과 빠르게 성숙해 가는 툴체인의 혜택을 받아 소규모 기반에서 성장하고 있습니다. 알리바바의 'Xuantie C920'은 더 낮은 유지 비용으로 ARM Cortex-A76과 동등한 정수 연산 성능을 실현하고 있는 반면, 인도의 'Shakti' 코어는 방위용 항공 전자 기기를 위한 보안 강화 버전을 제공합니다. 대조적으로, x86은 고성능 서버로 한정된 17.85%의 점유율에 그치고 있으며, 연평균 성장률(CAGR)은 4.62%로 가장 낮은 성장률을 보이고 있습니다.
기타 혜택:
- 엑셀 형식 시장 예측(ME) 시트
- 3개월간의 애널리스트 지원
자주 묻는 질문
목차
제1장 서론
제2장 조사 방법
제3장 주요 요약
제4장 시장 구도
제5장 시장 규모와 성장 예측
제6장 경쟁 구도
제7장 시장 기회와 향후 전망
JHS 26.08.11According to Mordor Intelligence, the Asia-Pacific semiconductor device market size for processing applications was valued at USD 162.08 billion in 2025 and estimated to grow from USD 173.29 billion in 2026 to reach USD 242.16 billion by 2031, at a CAGR of 6.92% during the forecast period (2026-2031).
This report is Segmented by Device Type (Discrete Semiconductors, Optoelectronics, and More), Processing Architecture (x86, ARM, and More), Fabrication Node (Below 7 Nm, 8-16 Nm, and More), End-User Industry (Consumer Electronics, Automotive, Industrial and Manufacturing, and More), and Geography. The Market Forecasts are Provided in Terms of Value (USD).
Insights and Trends of Asia-Pacific Semiconductor Device Market For Processing Applications
AI/ML and Data-center Demand Surge
Generative-AI clusters deploy domain-specific accelerators that pair every GPU with eight HBM3 stacks, boosting memory ASPs and stressing advanced packaging capacity.TSMC increased CoWoS lines by 50% in 2024 and committed USD 11 billion for an additional site in Kumamoto to support 2.5D and 3D integration. Cloud operators are rolling out ARM-based Graviton and Ampere CPUs, which captured 28% of Asia-Pacific instance launches in 2024, underscoring the shift away from x86. China's sovereign-AI mandate obliges local clouds to adopt domestically fabricated inference chips even at 14-nanometer nodes, redirecting demand toward SMIC and Huawei HiSilicon. Meanwhile, rack-power densities approaching 100 kW favor Singapore and Malaysia, where liquid-cooling infrastructure is colocated with chip-assembly operations.
5G-enabled IoT Device Proliferation
Asia-Pacific surpassed 2.1 billion cellular-IoT connections in 2024 as utilities deployed NB-IoT smart meters and logistics firms embedded Cat-M modules in cold-chain containers. Each endpoint carries three to five semiconductors, yet sub-USD 2 ASPs compress margins, pushing high-volume work to foundries running mature 28- and 40-nanometer lines. India's 5G rollout covers 400 cities, driving demand for sub-6 GHz RF filters sourced from Taiwanese and Japanese specialists. Automotive telematics modules are migrating to 5G RedCap, a shift that benefits Renesas and NXP owing to functional-safety credentials.
Export-control Geopolitics on Advanced Tools
The United States barred servicing of DUV immersion scanners at Chinese fabs in October 2024 and Japan restricted 23 classes of chip-equipment exports, forcing Chinese foundries to rely on multi-patterning at 14 nanometer nodes, lengthening wafer cycles and inflating cost-per-transistor by one-third. With TSMC and Samsung pre-ordering 62 High-NA EUV systems, ASML's backlog stretches 18 months, leaving no near-term capacity for new entrants even if licenses loosen.
Other drivers and restraints analyzed in the detailed report include:
- Government Fab Incentives Across Asia-Pacific
- Memory-cycle Rebound and HBM Adoption
- EUV-talent Bottleneck in Asia-Pacific Fabs
For complete list of drivers and restraints, kindly check the Table Of Contents.
Segment Analysis
Integrated circuits accounted for 45.12% of 2025 revenue within the Asia-Pacific semiconductor device market and will advance at an 7.85% CAGR through 2031, outpacing discretes as hyperscalers migrate from board-level to monolithic AI accelerators. Logic products lead the surge, with NVIDIA's H200 on TSMC's N3E node delivering 40% more TOPS-per-watt than its predecessor, pushing average wafer values higher.
Discrete semiconductors, optoelectronics, and sensors collectively held a 54.88% share; however, growth trails ICs at a 6.35% CAGR, as price competition dilutes ASP gains. Silicon-carbide device revenue is constrained by 150 mm wafer shortages, which stretch lead times to 52 weeks, while co-packaged optics trim the module bill of materials by 22%, compressing photonics margins.
ARM designs commanded 72.45% share in 2025, powering smartphones, cloud servers and automotive compute, whereas RISC-V cores will expand at 8.48% CAGR as governments prioritize instruction-set autonomy.
The Asia-Pacific semiconductor device market size for RISC-V solutions is growing from a small base, benefiting from royalty-free licensing and rapidly maturing toolchains. Alibaba's Xuantie C920 matched ARM Cortex-A76 integer performance at lower recurring fees, while India's Shakti core delivers secure variants for defense avionics. In contrast, x86 clings to an 17.85% share confined to high-performance servers, posting the slowest 4.62% CAGR.
Complete Report Scope:
- By Device Type
- Discrete Semiconductors
- Optoelectronics
- Sensors
- Integrated Circuits
- Analog
- Logic
- Memory
- Micro
- By Processing Architecture
- x86
- ARM
- RISC-V
- MIPS and Other Processing Architectures
- By Fabrication Node
- Below 7 nm (N7, N5, N3 and below)
- 8-16 nm
- 22-28 nm
- Above 32 nm (Legacy and Specialty)
- By End-User Industry
- Consumer Electronics
- Automotive
- Industrial and Manufacturing
- Data Centre and Cloud
- Telecommunications
- Healthcare Devices
- Aerospace and Defence
- Other End-User Industries
- By Country
- China
- India
- Japan
- South Korea
- Taiwan
- Singapore
- Rest of Asia-Pacific
List of Companies Covered in this Report:
- Taiwan Semiconductor Manufacturing Company Limited
- Samsung Electronics Co., Ltd.
- SK hynix Inc.
- Intel Corporation
- NVIDIA Corporation
- Qualcomm Incorporated
- Micron Technology, Inc.
- Advanced Micro Devices, Inc.
- Broadcom Inc.
- Texas Instruments Incorporated
- STMicroelectronics N.V.
- NXP Semiconductors N.V.
- Renesas Electronics Corporation
- Infineon Technologies AG
- Kyocera Corporation
- Rohm Co., Ltd.
- Toshiba Electronic Devices and Storage Corporation
- ON Semiconductor Corporation
- Xilinx Inc. (AMD Adaptive Computing)
- United Microelectronics Corporation
- Semiconductor Manufacturing International Corporation
- GlobalFoundries Inc.
- Powerchip Semiconductor Manufacturing Co. Ltd.
- ASE Technology Holding Co., Ltd.
Additional Benefits:
- The market estimate (ME) sheet in Excel format
- 3 months of analyst support
TABLE OF CONTENTS
1 INTRODUCTION
- 1.1 Study Assumptions and Market Definition
- 1.2 Scope of the Study
2 RESEARCH METHODOLOGY
3 EXECUTIVE SUMMARY
4 MARKET LANDSCAPE
- 4.1 Market Overview
- 4.2 Market Drivers
- 4.2.1 AI/ML And Data-Centre Demand Surge
- 4.2.2 5G-Enabled IoT Device Proliferation
- 4.2.3 Government Fab Incentives Across Asia-Pacific
- 4.2.4 Memory-Cycle Rebound And HBM Adoption
- 4.2.5 RISC-V Localisation Push In China And India
- 4.2.6 Edge-AI Modules For Smart Factories In SEA
- 4.3 Market Restraints
- 4.3.1 Supply-Chain Fragility And Material Shortages
- 4.3.2 Export-Control Geopolitics On Advanced Tools
- 4.3.3 EUV-Talent Bottleneck In Asia-Pacific Fabs
- 4.3.4 Water-Scarcity Risk At Leading Foundries
- 4.4 Industry Value Chain Analysis
- 4.5 Technological Outlook
- 4.6 Regulatory Landscape
- 4.7 Porter's Five Forces Analysis
- 4.7.1 Threat of New Entrants
- 4.7.2 Bargaining Power of Buyers
- 4.7.3 Bargaining Power of Suppliers
- 4.7.4 Threat of Substitutes
- 4.7.5 Competitive Rivalry
- 4.8 Impact of Macroeconomic Factors on the Market
- 4.9 Semiconductor Foundry Landscape
5 MARKET SIZE AND GROWTH FORECASTS (VALUE)
- 5.1 By Device Type
- 5.1.1 Discrete Semiconductors
- 5.1.2 Optoelectronics
- 5.1.3 Sensors
- 5.1.4 Integrated Circuits
- 5.1.4.1 Analog
- 5.1.4.2 Logic
- 5.1.4.3 Memory
- 5.1.4.4 Micro
- 5.2 By Processing Architecture
- 5.2.1 x86
- 5.2.2 ARM
- 5.2.3 RISC-V
- 5.2.4 MIPS and Other Processing Architectures
- 5.3 By Fabrication Node
- 5.3.1 Below 7 nm (N7, N5, N3 and below)
- 5.3.2 8-16 nm
- 5.3.3 22-28 nm
- 5.3.4 Above 32 nm (Legacy and Specialty)
- 5.4 By End-User Industry
- 5.4.1 Consumer Electronics
- 5.4.2 Automotive
- 5.4.3 Industrial and Manufacturing
- 5.4.4 Data Centre and Cloud
- 5.4.5 Telecommunications
- 5.4.6 Healthcare Devices
- 5.4.7 Aerospace and Defence
- 5.4.8 Other End-User Industries
- 5.5 By Country
- 5.5.1 China
- 5.5.2 India
- 5.5.3 Japan
- 5.5.4 South Korea
- 5.5.5 Taiwan
- 5.5.6 Singapore
- 5.5.7 Rest of Asia-Pacific
6 COMPETITIVE LANDSCAPE
- 6.1 Market Concentration
- 6.2 Strategic Moves
- 6.3 Market Share Analysis
- 6.4 Company Profiles (includes Global level Overview, Market level overview, Core Segments, Financials as available, Strategic Information, Market Rank/Share for key companies, Products and Services, and Recent Developments)
- 6.4.1 Taiwan Semiconductor Manufacturing Company Limited
- 6.4.2 Samsung Electronics Co., Ltd.
- 6.4.3 SK hynix Inc.
- 6.4.4 Intel Corporation
- 6.4.5 NVIDIA Corporation
- 6.4.6 Qualcomm Incorporated
- 6.4.7 Micron Technology, Inc.
- 6.4.8 Advanced Micro Devices, Inc.
- 6.4.9 Broadcom Inc.
- 6.4.10 Texas Instruments Incorporated
- 6.4.11 STMicroelectronics N.V.
- 6.4.12 NXP Semiconductors N.V.
- 6.4.13 Renesas Electronics Corporation
- 6.4.14 Infineon Technologies AG
- 6.4.15 Kyocera Corporation
- 6.4.16 Rohm Co., Ltd.
- 6.4.17 Toshiba Electronic Devices and Storage Corporation
- 6.4.18 ON Semiconductor Corporation
- 6.4.19 Xilinx Inc. (AMD Adaptive Computing)
- 6.4.20 United Microelectronics Corporation
- 6.4.21 Semiconductor Manufacturing International Corporation
- 6.4.22 GlobalFoundries Inc.
- 6.4.23 Powerchip Semiconductor Manufacturing Co. Ltd.
- 6.4.24 ASE Technology Holding Co., Ltd.
7 MARKET OPPORTUNITIES AND FUTURE OUTLOOK
- 7.1 White-space and Unmet-Need Assessment